

Key Insights
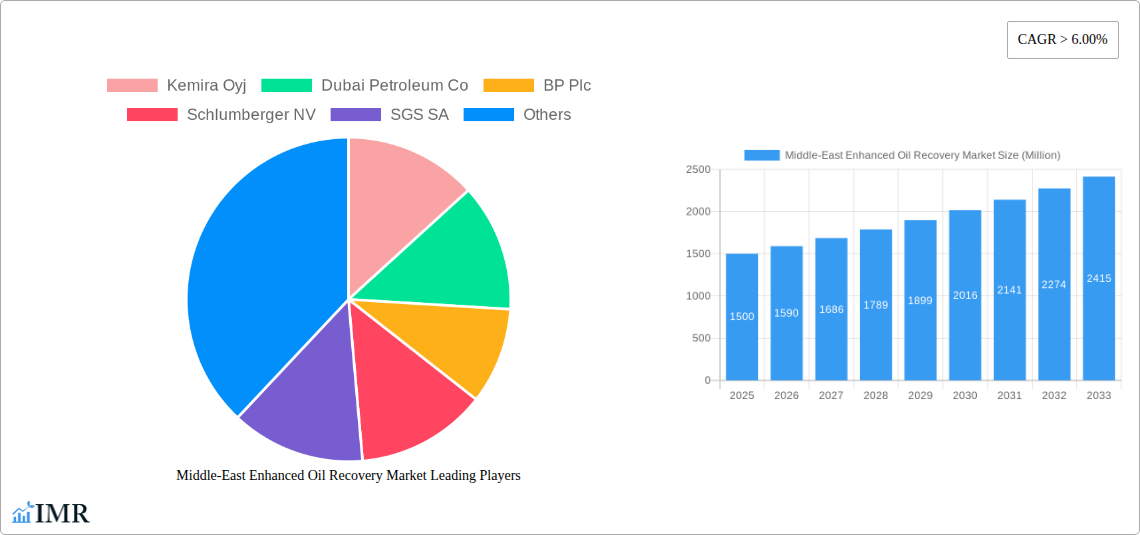
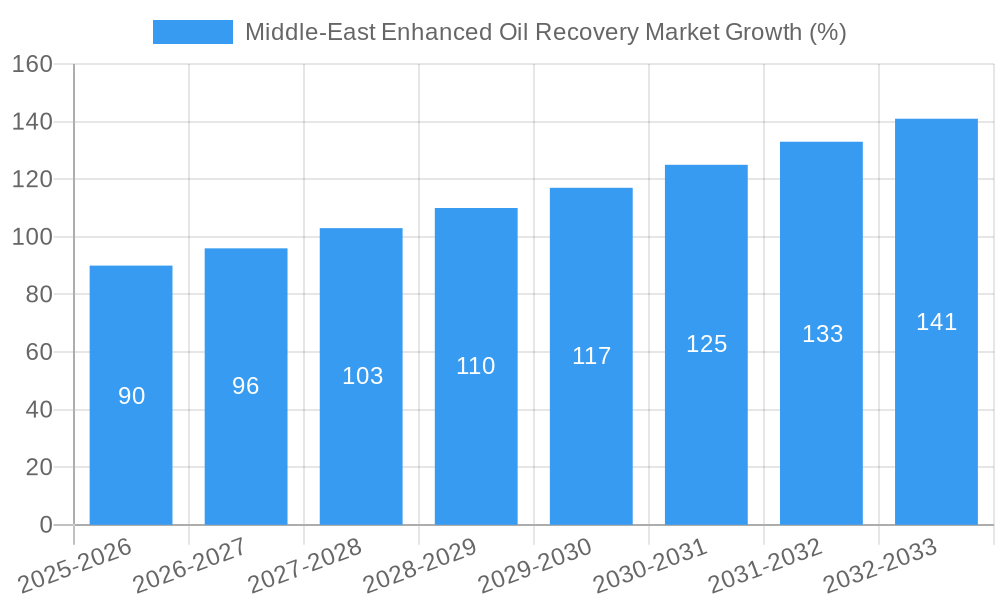
The Middle East Enhanced Oil Recovery (EOR) market is experiencing robust growth, driven by the region's significant oil reserves and the increasing need to maximize production from mature fields. A CAGR exceeding 6% from 2025 to 2033 indicates a substantial expansion. Key drivers include dwindling conventional oil reserves, escalating global energy demand, and supportive government policies aimed at boosting domestic production and energy security. The market is segmented by EOR technique, with thermal recovery, gas injection, and chemical injection methods all contributing to the overall growth. Major players like Saudi Aramco, ADNOC, and international corporations such as Schlumberger and BP are actively investing in advanced EOR technologies to enhance efficiency and profitability. The high concentration of oil reserves within the Middle East, especially in countries like Saudi Arabia, the UAE, and Oman, significantly contributes to the market's size and potential. The region's strategic location and existing infrastructure further support the sector's growth. Despite the potential for growth, challenges such as high initial investment costs, complex geological conditions, and fluctuating oil prices can influence market dynamics.
Technological advancements in EOR techniques, coupled with increasing collaborations between international and regional companies, are further propelling market expansion. Specific growth in gas injection and chemical injection techniques is anticipated due to their relative cost-effectiveness compared to thermal methods in certain geological settings. The rising adoption of digital technologies for reservoir monitoring and optimization is expected to improve EOR efficiency and reduce operational costs. However, environmental concerns associated with certain EOR methods, such as greenhouse gas emissions, present a challenge that needs to be addressed through the adoption of sustainable EOR practices and regulatory frameworks. The long-term outlook for the Middle East EOR market remains positive, with sustained growth expected throughout the forecast period.
Middle East Enhanced Oil Recovery (EOR) Market Report: 2019-2033
This comprehensive report provides an in-depth analysis of the Middle East Enhanced Oil Recovery market, encompassing market dynamics, growth trends, regional segmentation, product landscape, key players, and future outlook. With a focus on the parent market (Oil & Gas) and child market (EOR techniques), this report is an essential resource for industry professionals, investors, and strategic decision-makers. The study period covers 2019-2033, with a base year of 2025 and a forecast period of 2025-2033. The market size is presented in million units.
Middle-East Enhanced Oil Recovery Market Dynamics & Structure
This section analyzes the competitive landscape, technological advancements, regulatory influences, and market trends within the Middle East EOR market. We examine market concentration, M&A activity, and the impact of substitute products. The analysis considers both quantitative data (market share, deal volumes) and qualitative factors (innovation barriers).
- Market Concentration: The Middle East EOR market exhibits a moderately concentrated structure, with several major international and national oil companies dominating. xx% market share is held by the top 5 players.
- Technological Innovation: Significant investments are being made in advanced EOR techniques, particularly in CO2 injection and chemical flooding. However, the high upfront costs and technological complexities pose significant barriers to wider adoption.
- Regulatory Framework: Government policies and regulations play a crucial role in shaping the market, influencing investment decisions and project approvals. Variations in regulations across different countries in the region impact market growth.
- Competitive Substitutes: While EOR techniques are crucial for maximizing oil extraction, conventional methods still compete. The economic viability of EOR heavily influences its adoption rate versus traditional methods.
- M&A Activity: The past five years have witnessed a moderate level of M&A activity, driven by companies seeking to expand their EOR capabilities and access new resources. An estimated xx M&A deals were completed during the historical period.
- End-User Demographics: The primary end-users are national oil companies (NOCs) and international oil companies (IOCs) operating within the Middle East.
Middle-East Enhanced Oil Recovery Market Growth Trends & Insights
This section delves into the historical and projected growth of the Middle East EOR market. We analyze market size evolution, adoption rates across different techniques, and the impact of technological advancements. The analysis incorporates key metrics such as CAGR and market penetration rates. The market is expected to witness significant growth driven by factors such as increasing oil demand, depleting conventional oil reserves, and government initiatives to enhance oil production.
The Middle East EOR market is projected to reach xx million units by 2033, exhibiting a CAGR of xx% during the forecast period. This growth is primarily driven by the rising demand for oil, coupled with the declining production from mature oil fields and the need to increase extraction efficiency. The adoption rate of advanced EOR techniques, such as CO2 injection, is expected to increase significantly.
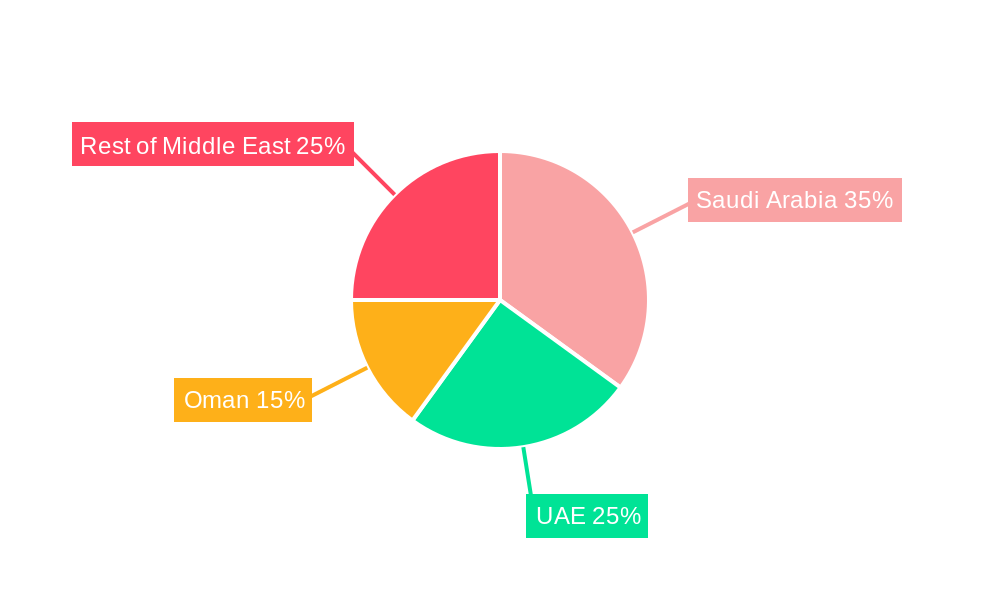
Dominant Regions, Countries, or Segments in Middle-East Enhanced Oil Recovery Market
This section identifies the leading regions, countries, and EOR techniques driving market growth within the Middle East. We examine the factors contributing to their dominance, such as economic policies, infrastructure, and resource availability.
- Leading Region/Country: Saudi Arabia and the UAE are currently the dominant players due to their large oil reserves and significant investments in EOR technologies.
- Leading Technique: Gas injection currently holds the largest market share, followed by chemical injection and thermal methods. The increasing availability of CO2 from various sources is driving the adoption of CO2 injection.
- Key Drivers:
- Significant oil reserves in the region.
- Government support and incentives for EOR projects.
- Technological advancements in EOR techniques.
- Development of efficient and cost-effective CO2 capture and sequestration technologies.
Middle-East Enhanced Oil Recovery Market Product Landscape
The Middle East EOR market features a diverse range of products and services, including chemicals, equipment, and specialized software for enhanced oil recovery operations. Recent innovations focus on improving efficiency, reducing environmental impact, and optimizing cost-effectiveness. These advancements are driving market growth and increasing the adoption of EOR technologies.
Key Drivers, Barriers & Challenges in Middle-East Enhanced Oil Recovery Market
Key Drivers:
- Rising global oil demand.
- Depletion of conventional oil reserves.
- Government incentives and regulations supporting EOR projects.
- Technological advancements in EOR techniques, including CO2 injection.
Key Barriers & Challenges:
- High initial investment costs associated with EOR projects.
- Technological complexities involved in implementing EOR techniques.
- Environmental concerns associated with certain EOR methods (e.g., CO2 emissions).
- Uncertainties related to oil price volatility.
- xx% project failure rate due to various factors.
Emerging Opportunities in Middle-East Enhanced Oil Recovery Market
Emerging opportunities include the increasing adoption of advanced EOR techniques such as CO2 injection and chemical flooding, the development of cost-effective and environmentally friendly EOR solutions, and the expansion into untapped reserves. Furthermore, partnerships and collaborations between NOCs, IOCs, and technology providers are creating new opportunities for market growth.
Growth Accelerators in the Middle-East Enhanced Oil Recovery Market Industry
Several factors are accelerating the long-term growth of the Middle East EOR market, including technological breakthroughs in CO2 capture and utilization, strategic partnerships between oil companies and technology providers, and the expansion of EOR activities into new geographical areas within the region. Government support and investment in research and development are further enhancing market growth prospects.
Key Players Shaping the Middle-East Enhanced Oil Recovery Market Market
- Kemira Oyj
- Dubai Petroleum Co
- BP Plc
- Schlumberger NV
- SGS SA
- Linde Plc
- Saudi Aramco
- China National Offshore Oil Corporation
- Abu Dhabi National Oil Company (ADNOC)
- Petroleum Development Oman
Notable Milestones in Middle-East Enhanced Oil Recovery Market Sector
- November 2021: Qatar Petroleum partnered with Axens for a CO2 dehydration project, supporting future EOR initiatives and CO2 sequestration. Medgulf Construction was selected as the EPC contractor.
- 2019: ADNOC set a goal to rank among the top four globally in CCUS EOR projects by 2025, securing gas from Shah-Ultra Sour Gas Plant, Habshan, and Bab gas fields for CO2 sourcing.
In-Depth Middle-East Enhanced Oil Recovery Market Market Outlook
The Middle East EOR market is poised for robust growth over the next decade, driven by sustained oil demand, technological advancements, and supportive government policies. Strategic partnerships and investments in research and development will further propel market expansion, creating significant opportunities for both established players and new entrants. The increasing focus on sustainable EOR practices will also drive innovation and market growth.
Middle-East Enhanced Oil Recovery Market Segmentation
-
1. Technique
- 1.1. Thermal
- 1.2. Gas Injection
- 1.3. Chemical Injection
-
2. Geography
- 2.1. Oman
- 2.2. United Arab Emirates
- 2.3. Qatar
- 2.4. Rest of Middle-East
Middle-East Enhanced Oil Recovery Market Segmentation By Geography
- 1. Oman
- 2. United Arab Emirates
- 3. Qatar
- 4. Rest of Middle East
Middle-East Enhanced Oil Recovery Market REPORT HIGHLIGHTS
| Aspects | Details |
|---|---|
| Study Period | 2019-2033 |
| Base Year | 2024 |
| Estimated Year | 2025 |
| Forecast Period | 2025-2033 |
| Historical Period | 2019-2024 |
| Growth Rate | CAGR of > 6.00% from 2019-2033 |
| Segmentation |
|
Table of Contents
- 1. Introduction
- 1.1. Research Scope
- 1.2. Market Segmentation
- 1.3. Research Methodology
- 1.4. Definitions and Assumptions
- 2. Executive Summary
- 2.1. Introduction
- 3. Market Dynamics
- 3.1. Introduction
- 3.2. Market Drivers
- 3.2.1 4.; Recovering Number of Air Passengers
- 3.2.2 on Account of the Cheaper Airfare in Recent Times4.; Increasing Disposable Income of Population
- 3.3. Market Restrains
- 3.3.1. 4.; High Share of Fossil-Fuel-Based Aviation Fuels in South American Countries
- 3.4. Market Trends
- 3.4.1. Gas Injection Expected to Witness Significant Growth
- 4. Market Factor Analysis
- 4.1. Porters Five Forces
- 4.2. Supply/Value Chain
- 4.3. PESTEL analysis
- 4.4. Market Entropy
- 4.5. Patent/Trademark Analysis
- 5. Global Middle-East Enhanced Oil Recovery Market Analysis, Insights and Forecast, 2019-2031
- 5.1. Market Analysis, Insights and Forecast - by Technique
- 5.1.1. Thermal
- 5.1.2. Gas Injection
- 5.1.3. Chemical Injection
- 5.2. Market Analysis, Insights and Forecast - by Geography
- 5.2.1. Oman
- 5.2.2. United Arab Emirates
- 5.2.3. Qatar
- 5.2.4. Rest of Middle-East
- 5.3. Market Analysis, Insights and Forecast - by Region
- 5.3.1. Oman
- 5.3.2. United Arab Emirates
- 5.3.3. Qatar
- 5.3.4. Rest of Middle East
- 5.1. Market Analysis, Insights and Forecast - by Technique
- 6. Oman Middle-East Enhanced Oil Recovery Market Analysis, Insights and Forecast, 2019-2031
- 6.1. Market Analysis, Insights and Forecast - by Technique
- 6.1.1. Thermal
- 6.1.2. Gas Injection
- 6.1.3. Chemical Injection
- 6.2. Market Analysis, Insights and Forecast - by Geography
- 6.2.1. Oman
- 6.2.2. United Arab Emirates
- 6.2.3. Qatar
- 6.2.4. Rest of Middle-East
- 6.1. Market Analysis, Insights and Forecast - by Technique
- 7. United Arab Emirates Middle-East Enhanced Oil Recovery Market Analysis, Insights and Forecast, 2019-2031
- 7.1. Market Analysis, Insights and Forecast - by Technique
- 7.1.1. Thermal
- 7.1.2. Gas Injection
- 7.1.3. Chemical Injection
- 7.2. Market Analysis, Insights and Forecast - by Geography
- 7.2.1. Oman
- 7.2.2. United Arab Emirates
- 7.2.3. Qatar
- 7.2.4. Rest of Middle-East
- 7.1. Market Analysis, Insights and Forecast - by Technique
- 8. Qatar Middle-East Enhanced Oil Recovery Market Analysis, Insights and Forecast, 2019-2031
- 8.1. Market Analysis, Insights and Forecast - by Technique
- 8.1.1. Thermal
- 8.1.2. Gas Injection
- 8.1.3. Chemical Injection
- 8.2. Market Analysis, Insights and Forecast - by Geography
- 8.2.1. Oman
- 8.2.2. United Arab Emirates
- 8.2.3. Qatar
- 8.2.4. Rest of Middle-East
- 8.1. Market Analysis, Insights and Forecast - by Technique
- 9. Rest of Middle East Middle-East Enhanced Oil Recovery Market Analysis, Insights and Forecast, 2019-2031
- 9.1. Market Analysis, Insights and Forecast - by Technique
- 9.1.1. Thermal
- 9.1.2. Gas Injection
- 9.1.3. Chemical Injection
- 9.2. Market Analysis, Insights and Forecast - by Geography
- 9.2.1. Oman
- 9.2.2. United Arab Emirates
- 9.2.3. Qatar
- 9.2.4. Rest of Middle-East
- 9.1. Market Analysis, Insights and Forecast - by Technique
- 10. North America Middle-East Enhanced Oil Recovery Market Analysis, Insights and Forecast, 2019-2031
- 10.1. Market Analysis, Insights and Forecast - By Country/Sub-region
- 10.1.1 United States
- 10.1.2 Canada
- 10.1.3 Mexico
- 11. Europe Middle-East Enhanced Oil Recovery Market Analysis, Insights and Forecast, 2019-2031
- 11.1. Market Analysis, Insights and Forecast - By Country/Sub-region
- 11.1.1 Germany
- 11.1.2 United Kingdom
- 11.1.3 France
- 11.1.4 Spain
- 11.1.5 Italy
- 11.1.6 Spain
- 11.1.7 Belgium
- 11.1.8 Netherland
- 11.1.9 Nordics
- 11.1.10 Rest of Europe
- 12. Asia Pacific Middle-East Enhanced Oil Recovery Market Analysis, Insights and Forecast, 2019-2031
- 12.1. Market Analysis, Insights and Forecast - By Country/Sub-region
- 12.1.1 China
- 12.1.2 Japan
- 12.1.3 India
- 12.1.4 South Korea
- 12.1.5 Southeast Asia
- 12.1.6 Australia
- 12.1.7 Indonesia
- 12.1.8 Phillipes
- 12.1.9 Singapore
- 12.1.10 Thailandc
- 12.1.11 Rest of Asia Pacific
- 13. South America Middle-East Enhanced Oil Recovery Market Analysis, Insights and Forecast, 2019-2031
- 13.1. Market Analysis, Insights and Forecast - By Country/Sub-region
- 13.1.1 Brazil
- 13.1.2 Argentina
- 13.1.3 Peru
- 13.1.4 Chile
- 13.1.5 Colombia
- 13.1.6 Ecuador
- 13.1.7 Venezuela
- 13.1.8 Rest of South America
- 14. MEA Middle-East Enhanced Oil Recovery Market Analysis, Insights and Forecast, 2019-2031
- 14.1. Market Analysis, Insights and Forecast - By Country/Sub-region
- 14.1.1 United Arab Emirates
- 14.1.2 Saudi Arabia
- 14.1.3 South Africa
- 14.1.4 Rest of Middle East and Africa
- 15. Competitive Analysis
- 15.1. Global Market Share Analysis 2024
- 15.2. Company Profiles
- 15.2.1 Kemira Oyj
- 15.2.1.1. Overview
- 15.2.1.2. Products
- 15.2.1.3. SWOT Analysis
- 15.2.1.4. Recent Developments
- 15.2.1.5. Financials (Based on Availability)
- 15.2.2 Dubai Petroleum Co
- 15.2.2.1. Overview
- 15.2.2.2. Products
- 15.2.2.3. SWOT Analysis
- 15.2.2.4. Recent Developments
- 15.2.2.5. Financials (Based on Availability)
- 15.2.3 BP Plc
- 15.2.3.1. Overview
- 15.2.3.2. Products
- 15.2.3.3. SWOT Analysis
- 15.2.3.4. Recent Developments
- 15.2.3.5. Financials (Based on Availability)
- 15.2.4 Schlumberger NV
- 15.2.4.1. Overview
- 15.2.4.2. Products
- 15.2.4.3. SWOT Analysis
- 15.2.4.4. Recent Developments
- 15.2.4.5. Financials (Based on Availability)
- 15.2.5 SGS SA
- 15.2.5.1. Overview
- 15.2.5.2. Products
- 15.2.5.3. SWOT Analysis
- 15.2.5.4. Recent Developments
- 15.2.5.5. Financials (Based on Availability)
- 15.2.6 Linde Plc*List Not Exhaustive
- 15.2.6.1. Overview
- 15.2.6.2. Products
- 15.2.6.3. SWOT Analysis
- 15.2.6.4. Recent Developments
- 15.2.6.5. Financials (Based on Availability)
- 15.2.7 Saudi Aramco
- 15.2.7.1. Overview
- 15.2.7.2. Products
- 15.2.7.3. SWOT Analysis
- 15.2.7.4. Recent Developments
- 15.2.7.5. Financials (Based on Availability)
- 15.2.8 China National Offshore Oil Corporation
- 15.2.8.1. Overview
- 15.2.8.2. Products
- 15.2.8.3. SWOT Analysis
- 15.2.8.4. Recent Developments
- 15.2.8.5. Financials (Based on Availability)
- 15.2.9 Abu Dhabi National Oil Company (ADNOC)
- 15.2.9.1. Overview
- 15.2.9.2. Products
- 15.2.9.3. SWOT Analysis
- 15.2.9.4. Recent Developments
- 15.2.9.5. Financials (Based on Availability)
- 15.2.10 Petroleum Development Oman
- 15.2.10.1. Overview
- 15.2.10.2. Products
- 15.2.10.3. SWOT Analysis
- 15.2.10.4. Recent Developments
- 15.2.10.5. Financials (Based on Availability)
- 15.2.1 Kemira Oyj
List of Figures
- Figure 1: Global Middle-East Enhanced Oil Recovery Market Revenue Breakdown (Million, %) by Region 2024 & 2032
- Figure 2: North America Middle-East Enhanced Oil Recovery Market Revenue (Million), by Country 2024 & 2032
- Figure 3: North America Middle-East Enhanced Oil Recovery Market Revenue Share (%), by Country 2024 & 2032
- Figure 4: Europe Middle-East Enhanced Oil Recovery Market Revenue (Million), by Country 2024 & 2032
- Figure 5: Europe Middle-East Enhanced Oil Recovery Market Revenue Share (%), by Country 2024 & 2032
- Figure 6: Asia Pacific Middle-East Enhanced Oil Recovery Market Revenue (Million), by Country 2024 & 2032
- Figure 7: Asia Pacific Middle-East Enhanced Oil Recovery Market Revenue Share (%), by Country 2024 & 2032
- Figure 8: South America Middle-East Enhanced Oil Recovery Market Revenue (Million), by Country 2024 & 2032
- Figure 9: South America Middle-East Enhanced Oil Recovery Market Revenue Share (%), by Country 2024 & 2032
- Figure 10: MEA Middle-East Enhanced Oil Recovery Market Revenue (Million), by Country 2024 & 2032
- Figure 11: MEA Middle-East Enhanced Oil Recovery Market Revenue Share (%), by Country 2024 & 2032
- Figure 12: Oman Middle-East Enhanced Oil Recovery Market Revenue (Million), by Technique 2024 & 2032
- Figure 13: Oman Middle-East Enhanced Oil Recovery Market Revenue Share (%), by Technique 2024 & 2032
- Figure 14: Oman Middle-East Enhanced Oil Recovery Market Revenue (Million), by Geography 2024 & 2032
- Figure 15: Oman Middle-East Enhanced Oil Recovery Market Revenue Share (%), by Geography 2024 & 2032
- Figure 16: Oman Middle-East Enhanced Oil Recovery Market Revenue (Million), by Country 2024 & 2032
- Figure 17: Oman Middle-East Enhanced Oil Recovery Market Revenue Share (%), by Country 2024 & 2032
- Figure 18: United Arab Emirates Middle-East Enhanced Oil Recovery Market Revenue (Million), by Technique 2024 & 2032
- Figure 19: United Arab Emirates Middle-East Enhanced Oil Recovery Market Revenue Share (%), by Technique 2024 & 2032
- Figure 20: United Arab Emirates Middle-East Enhanced Oil Recovery Market Revenue (Million), by Geography 2024 & 2032
- Figure 21: United Arab Emirates Middle-East Enhanced Oil Recovery Market Revenue Share (%), by Geography 2024 & 2032
- Figure 22: United Arab Emirates Middle-East Enhanced Oil Recovery Market Revenue (Million), by Country 2024 & 2032
- Figure 23: United Arab Emirates Middle-East Enhanced Oil Recovery Market Revenue Share (%), by Country 2024 & 2032
- Figure 24: Qatar Middle-East Enhanced Oil Recovery Market Revenue (Million), by Technique 2024 & 2032
- Figure 25: Qatar Middle-East Enhanced Oil Recovery Market Revenue Share (%), by Technique 2024 & 2032
- Figure 26: Qatar Middle-East Enhanced Oil Recovery Market Revenue (Million), by Geography 2024 & 2032
- Figure 27: Qatar Middle-East Enhanced Oil Recovery Market Revenue Share (%), by Geography 2024 & 2032
- Figure 28: Qatar Middle-East Enhanced Oil Recovery Market Revenue (Million), by Country 2024 & 2032
- Figure 29: Qatar Middle-East Enhanced Oil Recovery Market Revenue Share (%), by Country 2024 & 2032
- Figure 30: Rest of Middle East Middle-East Enhanced Oil Recovery Market Revenue (Million), by Technique 2024 & 2032
- Figure 31: Rest of Middle East Middle-East Enhanced Oil Recovery Market Revenue Share (%), by Technique 2024 & 2032
- Figure 32: Rest of Middle East Middle-East Enhanced Oil Recovery Market Revenue (Million), by Geography 2024 & 2032
- Figure 33: Rest of Middle East Middle-East Enhanced Oil Recovery Market Revenue Share (%), by Geography 2024 & 2032
- Figure 34: Rest of Middle East Middle-East Enhanced Oil Recovery Market Revenue (Million), by Country 2024 & 2032
- Figure 35: Rest of Middle East Middle-East Enhanced Oil Recovery Market Revenue Share (%), by Country 2024 & 2032
List of Tables
- Table 1: Global Middle-East Enhanced Oil Recovery Market Revenue Million Forecast, by Region 2019 & 2032
- Table 2: Global Middle-East Enhanced Oil Recovery Market Revenue Million Forecast, by Technique 2019 & 2032
- Table 3: Global Middle-East Enhanced Oil Recovery Market Revenue Million Forecast, by Geography 2019 & 2032
- Table 4: Global Middle-East Enhanced Oil Recovery Market Revenue Million Forecast, by Region 2019 & 2032
- Table 5: Global Middle-East Enhanced Oil Recovery Market Revenue Million Forecast, by Country 2019 & 2032
- Table 6: United States Middle-East Enhanced Oil Recovery Market Revenue (Million) Forecast, by Application 2019 & 2032
- Table 7: Canada Middle-East Enhanced Oil Recovery Market Revenue (Million) Forecast, by Application 2019 & 2032
- Table 8: Mexico Middle-East Enhanced Oil Recovery Market Revenue (Million) Forecast, by Application 2019 & 2032
- Table 9: Global Middle-East Enhanced Oil Recovery Market Revenue Million Forecast, by Country 2019 & 2032
- Table 10: Germany Middle-East Enhanced Oil Recovery Market Revenue (Million) Forecast, by Application 2019 & 2032
- Table 11: United Kingdom Middle-East Enhanced Oil Recovery Market Revenue (Million) Forecast, by Application 2019 & 2032
- Table 12: France Middle-East Enhanced Oil Recovery Market Revenue (Million) Forecast, by Application 2019 & 2032
- Table 13: Spain Middle-East Enhanced Oil Recovery Market Revenue (Million) Forecast, by Application 2019 & 2032
- Table 14: Italy Middle-East Enhanced Oil Recovery Market Revenue (Million) Forecast, by Application 2019 & 2032
- Table 15: Spain Middle-East Enhanced Oil Recovery Market Revenue (Million) Forecast, by Application 2019 & 2032
- Table 16: Belgium Middle-East Enhanced Oil Recovery Market Revenue (Million) Forecast, by Application 2019 & 2032
- Table 17: Netherland Middle-East Enhanced Oil Recovery Market Revenue (Million) Forecast, by Application 2019 & 2032
- Table 18: Nordics Middle-East Enhanced Oil Recovery Market Revenue (Million) Forecast, by Application 2019 & 2032
- Table 19: Rest of Europe Middle-East Enhanced Oil Recovery Market Revenue (Million) Forecast, by Application 2019 & 2032
- Table 20: Global Middle-East Enhanced Oil Recovery Market Revenue Million Forecast, by Country 2019 & 2032
- Table 21: China Middle-East Enhanced Oil Recovery Market Revenue (Million) Forecast, by Application 2019 & 2032
- Table 22: Japan Middle-East Enhanced Oil Recovery Market Revenue (Million) Forecast, by Application 2019 & 2032
- Table 23: India Middle-East Enhanced Oil Recovery Market Revenue (Million) Forecast, by Application 2019 & 2032
- Table 24: South Korea Middle-East Enhanced Oil Recovery Market Revenue (Million) Forecast, by Application 2019 & 2032
- Table 25: Southeast Asia Middle-East Enhanced Oil Recovery Market Revenue (Million) Forecast, by Application 2019 & 2032
- Table 26: Australia Middle-East Enhanced Oil Recovery Market Revenue (Million) Forecast, by Application 2019 & 2032
- Table 27: Indonesia Middle-East Enhanced Oil Recovery Market Revenue (Million) Forecast, by Application 2019 & 2032
- Table 28: Phillipes Middle-East Enhanced Oil Recovery Market Revenue (Million) Forecast, by Application 2019 & 2032
- Table 29: Singapore Middle-East Enhanced Oil Recovery Market Revenue (Million) Forecast, by Application 2019 & 2032
- Table 30: Thailandc Middle-East Enhanced Oil Recovery Market Revenue (Million) Forecast, by Application 2019 & 2032
- Table 31: Rest of Asia Pacific Middle-East Enhanced Oil Recovery Market Revenue (Million) Forecast, by Application 2019 & 2032
- Table 32: Global Middle-East Enhanced Oil Recovery Market Revenue Million Forecast, by Country 2019 & 2032
- Table 33: Brazil Middle-East Enhanced Oil Recovery Market Revenue (Million) Forecast, by Application 2019 & 2032
- Table 34: Argentina Middle-East Enhanced Oil Recovery Market Revenue (Million) Forecast, by Application 2019 & 2032
- Table 35: Peru Middle-East Enhanced Oil Recovery Market Revenue (Million) Forecast, by Application 2019 & 2032
- Table 36: Chile Middle-East Enhanced Oil Recovery Market Revenue (Million) Forecast, by Application 2019 & 2032
- Table 37: Colombia Middle-East Enhanced Oil Recovery Market Revenue (Million) Forecast, by Application 2019 & 2032
- Table 38: Ecuador Middle-East Enhanced Oil Recovery Market Revenue (Million) Forecast, by Application 2019 & 2032
- Table 39: Venezuela Middle-East Enhanced Oil Recovery Market Revenue (Million) Forecast, by Application 2019 & 2032
- Table 40: Rest of South America Middle-East Enhanced Oil Recovery Market Revenue (Million) Forecast, by Application 2019 & 2032
- Table 41: Global Middle-East Enhanced Oil Recovery Market Revenue Million Forecast, by Country 2019 & 2032
- Table 42: United Arab Emirates Middle-East Enhanced Oil Recovery Market Revenue (Million) Forecast, by Application 2019 & 2032
- Table 43: Saudi Arabia Middle-East Enhanced Oil Recovery Market Revenue (Million) Forecast, by Application 2019 & 2032
- Table 44: South Africa Middle-East Enhanced Oil Recovery Market Revenue (Million) Forecast, by Application 2019 & 2032
- Table 45: Rest of Middle East and Africa Middle-East Enhanced Oil Recovery Market Revenue (Million) Forecast, by Application 2019 & 2032
- Table 46: Global Middle-East Enhanced Oil Recovery Market Revenue Million Forecast, by Technique 2019 & 2032
- Table 47: Global Middle-East Enhanced Oil Recovery Market Revenue Million Forecast, by Geography 2019 & 2032
- Table 48: Global Middle-East Enhanced Oil Recovery Market Revenue Million Forecast, by Country 2019 & 2032
- Table 49: Global Middle-East Enhanced Oil Recovery Market Revenue Million Forecast, by Technique 2019 & 2032
- Table 50: Global Middle-East Enhanced Oil Recovery Market Revenue Million Forecast, by Geography 2019 & 2032
- Table 51: Global Middle-East Enhanced Oil Recovery Market Revenue Million Forecast, by Country 2019 & 2032
- Table 52: Global Middle-East Enhanced Oil Recovery Market Revenue Million Forecast, by Technique 2019 & 2032
- Table 53: Global Middle-East Enhanced Oil Recovery Market Revenue Million Forecast, by Geography 2019 & 2032
- Table 54: Global Middle-East Enhanced Oil Recovery Market Revenue Million Forecast, by Country 2019 & 2032
- Table 55: Global Middle-East Enhanced Oil Recovery Market Revenue Million Forecast, by Technique 2019 & 2032
- Table 56: Global Middle-East Enhanced Oil Recovery Market Revenue Million Forecast, by Geography 2019 & 2032
- Table 57: Global Middle-East Enhanced Oil Recovery Market Revenue Million Forecast, by Country 2019 & 2032
Frequently Asked Questions
1. What is the projected Compound Annual Growth Rate (CAGR) of the Middle-East Enhanced Oil Recovery Market?
The projected CAGR is approximately > 6.00%.
2. Which companies are prominent players in the Middle-East Enhanced Oil Recovery Market?
Key companies in the market include Kemira Oyj, Dubai Petroleum Co, BP Plc, Schlumberger NV, SGS SA, Linde Plc*List Not Exhaustive, Saudi Aramco, China National Offshore Oil Corporation, Abu Dhabi National Oil Company (ADNOC), Petroleum Development Oman.
3. What are the main segments of the Middle-East Enhanced Oil Recovery Market?
The market segments include Technique, Geography.
4. Can you provide details about the market size?
The market size is estimated to be USD XX Million as of 2022.
5. What are some drivers contributing to market growth?
4.; Recovering Number of Air Passengers. on Account of the Cheaper Airfare in Recent Times4.; Increasing Disposable Income of Population.
6. What are the notable trends driving market growth?
Gas Injection Expected to Witness Significant Growth.
7. Are there any restraints impacting market growth?
4.; High Share of Fossil-Fuel-Based Aviation Fuels in South American Countries.
8. Can you provide examples of recent developments in the market?
In November 2021, Qatar Petroleum planned the CO2 dehydration project with Axens, an IFP group company, for the upcoming EOR projects and the CO2 sequestration process. The Medgulf Construction company was selected as the EPC contractor.
9. What pricing options are available for accessing the report?
Pricing options include single-user, multi-user, and enterprise licenses priced at USD 4750, USD 5250, and USD 8750 respectively.
10. Is the market size provided in terms of value or volume?
The market size is provided in terms of value, measured in Million.
11. Are there any specific market keywords associated with the report?
Yes, the market keyword associated with the report is "Middle-East Enhanced Oil Recovery Market," which aids in identifying and referencing the specific market segment covered.
12. How do I determine which pricing option suits my needs best?
The pricing options vary based on user requirements and access needs. Individual users may opt for single-user licenses, while businesses requiring broader access may choose multi-user or enterprise licenses for cost-effective access to the report.
13. Are there any additional resources or data provided in the Middle-East Enhanced Oil Recovery Market report?
While the report offers comprehensive insights, it's advisable to review the specific contents or supplementary materials provided to ascertain if additional resources or data are available.
14. How can I stay updated on further developments or reports in the Middle-East Enhanced Oil Recovery Market?
To stay informed about further developments, trends, and reports in the Middle-East Enhanced Oil Recovery Market, consider subscribing to industry newsletters, following relevant companies and organizations, or regularly checking reputable industry news sources and publications.
Methodology
Step 1 - Identification of Relevant Samples Size from Population Database


Step 2 - Approaches for Defining Global Market Size (Value, Volume* & Price*)

Note*: In applicable scenarios
Step 3 - Data Sources
Primary Research
- Web Analytics
- Survey Reports
- Research Institute
- Latest Research Reports
- Opinion Leaders
Secondary Research
- Annual Reports
- White Paper
- Latest Press Release
- Industry Association
- Paid Database
- Investor Presentations

Step 4 - Data Triangulation
Involves using different sources of information in order to increase the validity of a study
These sources are likely to be stakeholders in a program - participants, other researchers, program staff, other community members, and so on.
Then we put all data in single framework & apply various statistical tools to find out the dynamic on the market.
During the analysis stage, feedback from the stakeholder groups would be compared to determine areas of agreement as well as areas of divergence
