

Key Insights
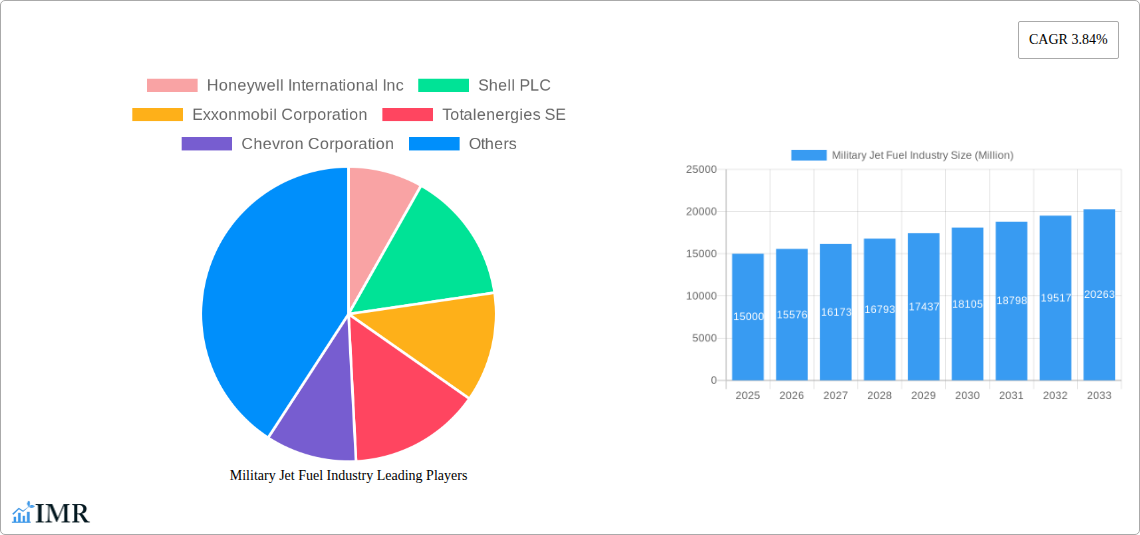
The military jet fuel market, while exhibiting a relatively moderate CAGR of 3.84%, is poised for significant growth driven by increasing global defense budgets and modernization of air forces worldwide. The market's value, estimated at $XX million in 2025, is projected to expand considerably by 2033, fueled by rising demand from both established and emerging military powers. The shift towards advanced fighter jets and increased flight hours for training and operational deployments significantly contributes to this growth. While air turbine fuel remains the dominant fuel type, the burgeoning adoption of renewable aviation fuel (RAF) represents a key trend, driven by sustainability concerns and environmental regulations. This transition, however, is currently constrained by RAF's higher production costs and limited availability compared to traditional fuels. Major players like Honeywell, Shell, ExxonMobil, and others are strategically investing in both the production and distribution of traditional and alternative jet fuels, aiming to capitalize on this evolving market landscape. Regional variations are expected, with North America and Asia-Pacific likely to dominate due to their substantial military expenditures and robust air forces. However, regions like the Middle East and Africa are also anticipated to show substantial growth, driven by increased investment in their defense sectors.
The competitive landscape is characterized by a handful of large, integrated oil and gas companies alongside specialized fuel providers. These companies are actively engaging in research and development to improve fuel efficiency, reduce emissions, and enhance fuel performance under diverse operational conditions. The market’s future trajectory hinges on factors such as geopolitical stability, technological advancements in RAF production, fluctuating crude oil prices, and evolving government regulations regarding emissions and sustainability. While traditional air turbine fuel will retain its dominance in the near future, the growing adoption of RAF will significantly reshape the market dynamics over the long term, creating both opportunities and challenges for existing and emerging market participants.
Military Jet Fuel Industry Market Report: 2019-2033
This comprehensive report provides an in-depth analysis of the Military Jet Fuel industry, encompassing market dynamics, growth trends, regional landscapes, product innovations, and key player strategies. The study covers the period 2019-2033, with a base year of 2025 and a forecast period of 2025-2033. The report is essential for industry professionals, investors, and strategic decision-makers seeking to understand and capitalize on opportunities within this crucial sector. Parent market (Aviation Fuel) and child market (Military Jet Fuel) analysis is incorporated for a complete understanding of market dynamics.
Military Jet Fuel Industry Market Dynamics & Structure
The global military jet fuel market, a subset of the larger aviation fuel market, is characterized by a moderately concentrated landscape dominated by major integrated energy companies and specialized fuel suppliers. The market size in 2024 was estimated at xx Million and is projected to reach xx Million by 2033. Market concentration is influenced by factors including economies of scale, access to refining infrastructure, and long-term supply contracts with defense ministries. Technological innovation, primarily focused on enhancing fuel efficiency, reducing emissions, and improving sustainability, is a key driver. Stringent regulatory frameworks governing fuel quality, safety, and environmental impact significantly shape market dynamics. The presence of alternative fuels, particularly renewable aviation fuels (RAF), presents a competitive substitute and influences market growth. End-user demographics, largely concentrated within military air forces globally, influence demand patterns, with variations across regions based on defense spending and geopolitical factors. M&A activity within the broader energy sector indirectly impacts the military jet fuel market. While the specific number of M&A deals within the military jet fuel segment is unavailable (xx), consolidation within the parent aviation fuel market can influence pricing and supply chain dynamics.
- Market Concentration: Moderately concentrated, with top players holding xx% market share.
- Technological Innovation: Focus on biofuels, synthetic fuels, and improved combustion efficiency.
- Regulatory Frameworks: Stringent safety, environmental, and quality standards.
- Competitive Substitutes: Growing adoption of renewable aviation fuels (RAF).
- End-User Demographics: Primarily military air forces, influenced by defense budgets.
- M&A Trends: Indirect influence through consolidation in the broader energy sector; xx M&A deals in the period 2019-2024 (estimated).
Military Jet Fuel Industry Growth Trends & Insights
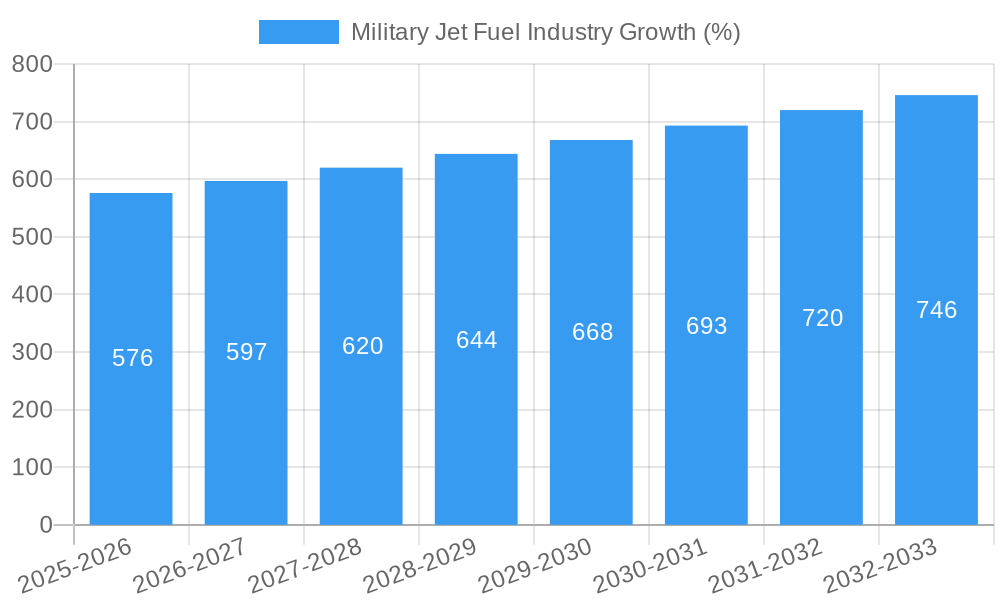
The military jet fuel market exhibits a steady growth trajectory driven by increasing defense spending globally, modernization of military aircraft fleets, and ongoing geopolitical instability. The historical period (2019-2024) witnessed a CAGR of xx%, primarily attributed to increasing military exercises and operational deployments. The market size is projected to experience a CAGR of xx% during the forecast period (2025-2033), reaching xx Million by 2033. Adoption rates of renewable aviation fuels (RAF) are gradually increasing, albeit from a low base, representing a significant growth opportunity. Technological disruptions, such as the development of sustainable aviation fuels (SAFs) and improved engine technologies, are poised to reshape the market landscape. Consumer behavior, in this context, is driven by national defense needs and strategic priorities of governments, with little direct consumer influence on fuel choice. Market penetration of RAF is expected to reach xx% by 2033, while the overall market penetration remains high due to the essential nature of the product.
Dominant Regions, Countries, or Segments in Military Jet Fuel Industry
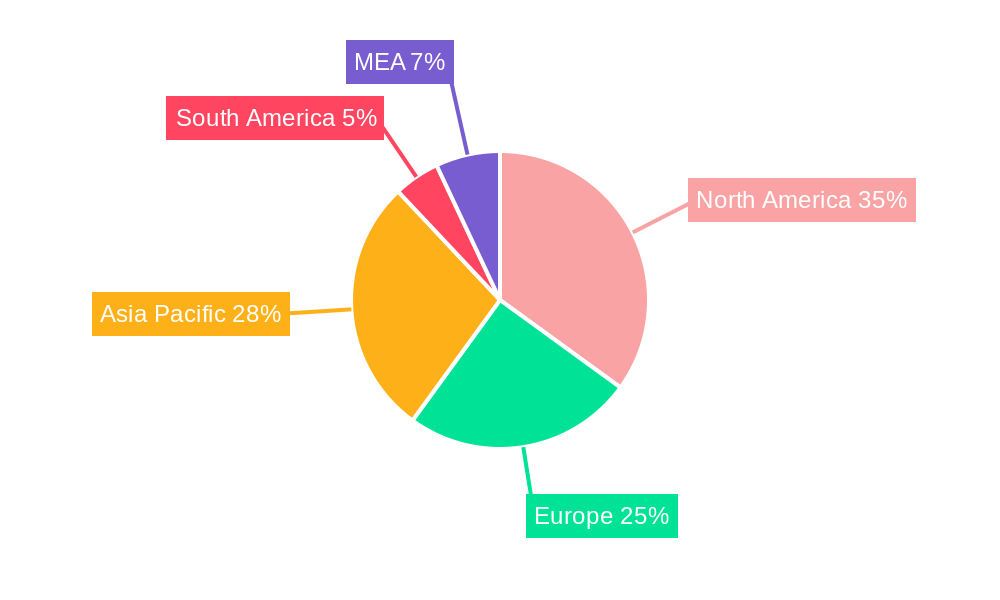
The North American region currently holds the largest market share in military jet fuel consumption due to high defense spending and a large military air force. Europe follows closely, with significant defense budgets driving demand. Asia-Pacific is anticipated to exhibit robust growth due to increasing military modernization efforts and rising defense expenditure in several nations. Within fuel types, Air Turbine Fuel (ATF) dominates the market due to its widespread use in current military aircraft. However, Renewable Aviation Fuel (RAF) is witnessing increasing adoption driven by environmental concerns and government initiatives promoting sustainable aviation.
- Key Drivers (North America): High defense spending, strong military air force, technological advancements.
- Key Drivers (Europe): Significant defense budgets, geopolitical factors, focus on sustainability.
- Key Drivers (Asia-Pacific): Military modernization efforts, increasing defense expenditure, growing air forces.
- Fuel Type Dominance: Air Turbine Fuel (ATF) dominates, with RAF gaining traction.
Military Jet Fuel Industry Product Landscape
Military jet fuel specifications vary based on operational requirements and aircraft types (e.g., JP-5, JP-8). Product innovation focuses on enhancing fuel efficiency, improving cold weather performance, and reducing emissions. The development of sustainable aviation fuels (SAFs) represents a significant technological advancement, offering a pathway to more environmentally friendly military jet fuel. Key selling propositions include superior performance under extreme conditions, high energy density, and compliance with strict military specifications.
Key Drivers, Barriers & Challenges in Military Jet Fuel Industry
Key Drivers: Increased defense budgets, modernization of military aircraft, geopolitical instability, and growing demand for sustainable aviation fuels (SAFs).
Challenges and Restraints: Fluctuations in crude oil prices, stringent environmental regulations, geopolitical risks disrupting supply chains, and competition from alternative fuels (e.g. RAF) impacting profitability. Supply chain vulnerabilities, exacerbated by geopolitical tensions, could lead to xx% disruptions in supply (estimated).
Emerging Opportunities in Military Jet Fuel Industry
Emerging opportunities include the increased adoption of renewable aviation fuels (RAF), expansion into new geographical markets with growing military air forces, development of advanced biofuels and synthetic fuels, and strategic partnerships between energy companies and defense contractors to develop and deploy sustainable fuel solutions.
Growth Accelerators in the Military Jet Fuel Industry
Technological advancements in fuel efficiency and sustainability are paramount. Strategic alliances between energy companies and defense organizations to secure fuel supply chains and develop innovative fuel solutions will accelerate market growth. Expansion into emerging markets with growing military capabilities will also drive significant expansion.
Key Players Shaping the Military Jet Fuel Industry Market
- Honeywell International Inc
- Shell PLC
- Exxonmobil Corporation
- TotalEnergies SE
- Chevron Corporation
- GS Caltex Corporation
- BP PLC
- Repsol SA
Notable Milestones in Military Jet Fuel Industry Sector
- July 2023: Viva Energy secures a six-year (potentially 12-year) contract with the Australian Department of Defense to supply aviation fuel, restarting JP-5 production at its Geelong Refinery. This significantly impacts the Australian market and demonstrates a commitment to domestic fuel production.
- March 2023: US sanctions on Myanmar's military regime disrupt jet fuel supply, highlighting geopolitical risks impacting the industry's stability.
In-Depth Military Jet Fuel Industry Market Outlook
The military jet fuel market is poised for steady growth, driven by sustained defense spending, technological advancements in sustainable aviation fuels, and strategic partnerships fostering innovation. Opportunities exist in expanding RAF adoption, optimizing supply chain resilience against geopolitical risks, and developing next-generation biofuels and synthetic alternatives. The market’s future potential rests on the ability of key players to adapt to evolving geopolitical landscapes, stringent environmental regulations, and consumer demands for sustainable solutions.
Military Jet Fuel Industry Segmentation
-
1. Fuel Type
- 1.1. Air Turbine Fuel
- 1.2. Renewable Avaition Fuel
Military Jet Fuel Industry Segmentation By Geography
-
1. North America
- 1.1. United States
- 1.2. Canada
- 1.3. Rest of North America
-
2. Europe
- 2.1. Germany
- 2.2. United Kingdom
- 2.3. Italy
- 2.4. France
- 2.5. Russia
- 2.6. Rest of North America
-
3. Asia Pacific
- 3.1. China
- 3.2. India
- 3.3. Japan
- 3.4. South Korea
- 3.5. Rest of Asia Pacific
-
4. Rest of the World
- 4.1. Saudi Arabia
- 4.2. United Arab Emirates
- 4.3. South Africa
- 4.4. Algeria
Military Jet Fuel Industry REPORT HIGHLIGHTS
| Aspects | Details |
|---|---|
| Study Period | 2019-2033 |
| Base Year | 2024 |
| Estimated Year | 2025 |
| Forecast Period | 2025-2033 |
| Historical Period | 2019-2024 |
| Growth Rate | CAGR of 3.84% from 2019-2033 |
| Segmentation |
|
Table of Contents
- 1. Introduction
- 1.1. Research Scope
- 1.2. Market Segmentation
- 1.3. Research Methodology
- 1.4. Definitions and Assumptions
- 2. Executive Summary
- 2.1. Introduction
- 3. Market Dynamics
- 3.1. Introduction
- 3.2. Market Drivers
- 3.2.1. 4.; Modernization and Upgrades of Existing Military Aircraft Fleets4.; Increasing Defense Budgets
- 3.3. Market Restrains
- 3.3.1. 4.; Shift Toward Unmanned Aircraft
- 3.4. Market Trends
- 3.4.1. Renewable Aviation Fuel to be the Fastest Growing Market
- 4. Market Factor Analysis
- 4.1. Porters Five Forces
- 4.2. Supply/Value Chain
- 4.3. PESTEL analysis
- 4.4. Market Entropy
- 4.5. Patent/Trademark Analysis
- 5. Global Military Jet Fuel Industry Analysis, Insights and Forecast, 2019-2031
- 5.1. Market Analysis, Insights and Forecast - by Fuel Type
- 5.1.1. Air Turbine Fuel
- 5.1.2. Renewable Avaition Fuel
- 5.2. Market Analysis, Insights and Forecast - by Region
- 5.2.1. North America
- 5.2.2. Europe
- 5.2.3. Asia Pacific
- 5.2.4. Rest of the World
- 5.1. Market Analysis, Insights and Forecast - by Fuel Type
- 6. North America Military Jet Fuel Industry Analysis, Insights and Forecast, 2019-2031
- 6.1. Market Analysis, Insights and Forecast - by Fuel Type
- 6.1.1. Air Turbine Fuel
- 6.1.2. Renewable Avaition Fuel
- 6.1. Market Analysis, Insights and Forecast - by Fuel Type
- 7. Europe Military Jet Fuel Industry Analysis, Insights and Forecast, 2019-2031
- 7.1. Market Analysis, Insights and Forecast - by Fuel Type
- 7.1.1. Air Turbine Fuel
- 7.1.2. Renewable Avaition Fuel
- 7.1. Market Analysis, Insights and Forecast - by Fuel Type
- 8. Asia Pacific Military Jet Fuel Industry Analysis, Insights and Forecast, 2019-2031
- 8.1. Market Analysis, Insights and Forecast - by Fuel Type
- 8.1.1. Air Turbine Fuel
- 8.1.2. Renewable Avaition Fuel
- 8.1. Market Analysis, Insights and Forecast - by Fuel Type
- 9. Rest of the World Military Jet Fuel Industry Analysis, Insights and Forecast, 2019-2031
- 9.1. Market Analysis, Insights and Forecast - by Fuel Type
- 9.1.1. Air Turbine Fuel
- 9.1.2. Renewable Avaition Fuel
- 9.1. Market Analysis, Insights and Forecast - by Fuel Type
- 10. North America Military Jet Fuel Industry Analysis, Insights and Forecast, 2019-2031
- 10.1. Market Analysis, Insights and Forecast - By Country/Sub-region
- 10.1.1 United States
- 10.1.2 Canada
- 10.1.3 Mexico
- 11. Europe Military Jet Fuel Industry Analysis, Insights and Forecast, 2019-2031
- 11.1. Market Analysis, Insights and Forecast - By Country/Sub-region
- 11.1.1 Germany
- 11.1.2 United Kingdom
- 11.1.3 France
- 11.1.4 Spain
- 11.1.5 Italy
- 11.1.6 Spain
- 11.1.7 Belgium
- 11.1.8 Netherland
- 11.1.9 Nordics
- 11.1.10 Rest of Europe
- 12. Asia Pacific Military Jet Fuel Industry Analysis, Insights and Forecast, 2019-2031
- 12.1. Market Analysis, Insights and Forecast - By Country/Sub-region
- 12.1.1 China
- 12.1.2 Japan
- 12.1.3 India
- 12.1.4 South Korea
- 12.1.5 Southeast Asia
- 12.1.6 Australia
- 12.1.7 Indonesia
- 12.1.8 Phillipes
- 12.1.9 Singapore
- 12.1.10 Thailandc
- 12.1.11 Rest of Asia Pacific
- 13. South America Military Jet Fuel Industry Analysis, Insights and Forecast, 2019-2031
- 13.1. Market Analysis, Insights and Forecast - By Country/Sub-region
- 13.1.1 Brazil
- 13.1.2 Argentina
- 13.1.3 Peru
- 13.1.4 Chile
- 13.1.5 Colombia
- 13.1.6 Ecuador
- 13.1.7 Venezuela
- 13.1.8 Rest of South America
- 14. MEA Military Jet Fuel Industry Analysis, Insights and Forecast, 2019-2031
- 14.1. Market Analysis, Insights and Forecast - By Country/Sub-region
- 14.1.1 United Arab Emirates
- 14.1.2 Saudi Arabia
- 14.1.3 South Africa
- 14.1.4 Rest of Middle East and Africa
- 15. Competitive Analysis
- 15.1. Global Market Share Analysis 2024
- 15.2. Company Profiles
- 15.2.1 Honeywell International Inc
- 15.2.1.1. Overview
- 15.2.1.2. Products
- 15.2.1.3. SWOT Analysis
- 15.2.1.4. Recent Developments
- 15.2.1.5. Financials (Based on Availability)
- 15.2.2 Shell PLC
- 15.2.2.1. Overview
- 15.2.2.2. Products
- 15.2.2.3. SWOT Analysis
- 15.2.2.4. Recent Developments
- 15.2.2.5. Financials (Based on Availability)
- 15.2.3 Exxonmobil Corporation
- 15.2.3.1. Overview
- 15.2.3.2. Products
- 15.2.3.3. SWOT Analysis
- 15.2.3.4. Recent Developments
- 15.2.3.5. Financials (Based on Availability)
- 15.2.4 Totalenergies SE
- 15.2.4.1. Overview
- 15.2.4.2. Products
- 15.2.4.3. SWOT Analysis
- 15.2.4.4. Recent Developments
- 15.2.4.5. Financials (Based on Availability)
- 15.2.5 Chevron Corporation
- 15.2.5.1. Overview
- 15.2.5.2. Products
- 15.2.5.3. SWOT Analysis
- 15.2.5.4. Recent Developments
- 15.2.5.5. Financials (Based on Availability)
- 15.2.6 GS Caltex Corporation
- 15.2.6.1. Overview
- 15.2.6.2. Products
- 15.2.6.3. SWOT Analysis
- 15.2.6.4. Recent Developments
- 15.2.6.5. Financials (Based on Availability)
- 15.2.7 BP PLC
- 15.2.7.1. Overview
- 15.2.7.2. Products
- 15.2.7.3. SWOT Analysis
- 15.2.7.4. Recent Developments
- 15.2.7.5. Financials (Based on Availability)
- 15.2.8 Repsol SA
- 15.2.8.1. Overview
- 15.2.8.2. Products
- 15.2.8.3. SWOT Analysis
- 15.2.8.4. Recent Developments
- 15.2.8.5. Financials (Based on Availability)
- 15.2.1 Honeywell International Inc
List of Figures
- Figure 1: Global Military Jet Fuel Industry Revenue Breakdown (Million, %) by Region 2024 & 2032
- Figure 2: Global Military Jet Fuel Industry Volume Breakdown (Litre, %) by Region 2024 & 2032
- Figure 3: North America Military Jet Fuel Industry Revenue (Million), by Country 2024 & 2032
- Figure 4: North America Military Jet Fuel Industry Volume (Litre), by Country 2024 & 2032
- Figure 5: North America Military Jet Fuel Industry Revenue Share (%), by Country 2024 & 2032
- Figure 6: North America Military Jet Fuel Industry Volume Share (%), by Country 2024 & 2032
- Figure 7: Europe Military Jet Fuel Industry Revenue (Million), by Country 2024 & 2032
- Figure 8: Europe Military Jet Fuel Industry Volume (Litre), by Country 2024 & 2032
- Figure 9: Europe Military Jet Fuel Industry Revenue Share (%), by Country 2024 & 2032
- Figure 10: Europe Military Jet Fuel Industry Volume Share (%), by Country 2024 & 2032
- Figure 11: Asia Pacific Military Jet Fuel Industry Revenue (Million), by Country 2024 & 2032
- Figure 12: Asia Pacific Military Jet Fuel Industry Volume (Litre), by Country 2024 & 2032
- Figure 13: Asia Pacific Military Jet Fuel Industry Revenue Share (%), by Country 2024 & 2032
- Figure 14: Asia Pacific Military Jet Fuel Industry Volume Share (%), by Country 2024 & 2032
- Figure 15: South America Military Jet Fuel Industry Revenue (Million), by Country 2024 & 2032
- Figure 16: South America Military Jet Fuel Industry Volume (Litre), by Country 2024 & 2032
- Figure 17: South America Military Jet Fuel Industry Revenue Share (%), by Country 2024 & 2032
- Figure 18: South America Military Jet Fuel Industry Volume Share (%), by Country 2024 & 2032
- Figure 19: MEA Military Jet Fuel Industry Revenue (Million), by Country 2024 & 2032
- Figure 20: MEA Military Jet Fuel Industry Volume (Litre), by Country 2024 & 2032
- Figure 21: MEA Military Jet Fuel Industry Revenue Share (%), by Country 2024 & 2032
- Figure 22: MEA Military Jet Fuel Industry Volume Share (%), by Country 2024 & 2032
- Figure 23: North America Military Jet Fuel Industry Revenue (Million), by Fuel Type 2024 & 2032
- Figure 24: North America Military Jet Fuel Industry Volume (Litre), by Fuel Type 2024 & 2032
- Figure 25: North America Military Jet Fuel Industry Revenue Share (%), by Fuel Type 2024 & 2032
- Figure 26: North America Military Jet Fuel Industry Volume Share (%), by Fuel Type 2024 & 2032
- Figure 27: North America Military Jet Fuel Industry Revenue (Million), by Country 2024 & 2032
- Figure 28: North America Military Jet Fuel Industry Volume (Litre), by Country 2024 & 2032
- Figure 29: North America Military Jet Fuel Industry Revenue Share (%), by Country 2024 & 2032
- Figure 30: North America Military Jet Fuel Industry Volume Share (%), by Country 2024 & 2032
- Figure 31: Europe Military Jet Fuel Industry Revenue (Million), by Fuel Type 2024 & 2032
- Figure 32: Europe Military Jet Fuel Industry Volume (Litre), by Fuel Type 2024 & 2032
- Figure 33: Europe Military Jet Fuel Industry Revenue Share (%), by Fuel Type 2024 & 2032
- Figure 34: Europe Military Jet Fuel Industry Volume Share (%), by Fuel Type 2024 & 2032
- Figure 35: Europe Military Jet Fuel Industry Revenue (Million), by Country 2024 & 2032
- Figure 36: Europe Military Jet Fuel Industry Volume (Litre), by Country 2024 & 2032
- Figure 37: Europe Military Jet Fuel Industry Revenue Share (%), by Country 2024 & 2032
- Figure 38: Europe Military Jet Fuel Industry Volume Share (%), by Country 2024 & 2032
- Figure 39: Asia Pacific Military Jet Fuel Industry Revenue (Million), by Fuel Type 2024 & 2032
- Figure 40: Asia Pacific Military Jet Fuel Industry Volume (Litre), by Fuel Type 2024 & 2032
- Figure 41: Asia Pacific Military Jet Fuel Industry Revenue Share (%), by Fuel Type 2024 & 2032
- Figure 42: Asia Pacific Military Jet Fuel Industry Volume Share (%), by Fuel Type 2024 & 2032
- Figure 43: Asia Pacific Military Jet Fuel Industry Revenue (Million), by Country 2024 & 2032
- Figure 44: Asia Pacific Military Jet Fuel Industry Volume (Litre), by Country 2024 & 2032
- Figure 45: Asia Pacific Military Jet Fuel Industry Revenue Share (%), by Country 2024 & 2032
- Figure 46: Asia Pacific Military Jet Fuel Industry Volume Share (%), by Country 2024 & 2032
- Figure 47: Rest of the World Military Jet Fuel Industry Revenue (Million), by Fuel Type 2024 & 2032
- Figure 48: Rest of the World Military Jet Fuel Industry Volume (Litre), by Fuel Type 2024 & 2032
- Figure 49: Rest of the World Military Jet Fuel Industry Revenue Share (%), by Fuel Type 2024 & 2032
- Figure 50: Rest of the World Military Jet Fuel Industry Volume Share (%), by Fuel Type 2024 & 2032
- Figure 51: Rest of the World Military Jet Fuel Industry Revenue (Million), by Country 2024 & 2032
- Figure 52: Rest of the World Military Jet Fuel Industry Volume (Litre), by Country 2024 & 2032
- Figure 53: Rest of the World Military Jet Fuel Industry Revenue Share (%), by Country 2024 & 2032
- Figure 54: Rest of the World Military Jet Fuel Industry Volume Share (%), by Country 2024 & 2032
List of Tables
- Table 1: Global Military Jet Fuel Industry Revenue Million Forecast, by Region 2019 & 2032
- Table 2: Global Military Jet Fuel Industry Volume Litre Forecast, by Region 2019 & 2032
- Table 3: Global Military Jet Fuel Industry Revenue Million Forecast, by Fuel Type 2019 & 2032
- Table 4: Global Military Jet Fuel Industry Volume Litre Forecast, by Fuel Type 2019 & 2032
- Table 5: Global Military Jet Fuel Industry Revenue Million Forecast, by Region 2019 & 2032
- Table 6: Global Military Jet Fuel Industry Volume Litre Forecast, by Region 2019 & 2032
- Table 7: Global Military Jet Fuel Industry Revenue Million Forecast, by Country 2019 & 2032
- Table 8: Global Military Jet Fuel Industry Volume Litre Forecast, by Country 2019 & 2032
- Table 9: United States Military Jet Fuel Industry Revenue (Million) Forecast, by Application 2019 & 2032
- Table 10: United States Military Jet Fuel Industry Volume (Litre) Forecast, by Application 2019 & 2032
- Table 11: Canada Military Jet Fuel Industry Revenue (Million) Forecast, by Application 2019 & 2032
- Table 12: Canada Military Jet Fuel Industry Volume (Litre) Forecast, by Application 2019 & 2032
- Table 13: Mexico Military Jet Fuel Industry Revenue (Million) Forecast, by Application 2019 & 2032
- Table 14: Mexico Military Jet Fuel Industry Volume (Litre) Forecast, by Application 2019 & 2032
- Table 15: Global Military Jet Fuel Industry Revenue Million Forecast, by Country 2019 & 2032
- Table 16: Global Military Jet Fuel Industry Volume Litre Forecast, by Country 2019 & 2032
- Table 17: Germany Military Jet Fuel Industry Revenue (Million) Forecast, by Application 2019 & 2032
- Table 18: Germany Military Jet Fuel Industry Volume (Litre) Forecast, by Application 2019 & 2032
- Table 19: United Kingdom Military Jet Fuel Industry Revenue (Million) Forecast, by Application 2019 & 2032
- Table 20: United Kingdom Military Jet Fuel Industry Volume (Litre) Forecast, by Application 2019 & 2032
- Table 21: France Military Jet Fuel Industry Revenue (Million) Forecast, by Application 2019 & 2032
- Table 22: France Military Jet Fuel Industry Volume (Litre) Forecast, by Application 2019 & 2032
- Table 23: Spain Military Jet Fuel Industry Revenue (Million) Forecast, by Application 2019 & 2032
- Table 24: Spain Military Jet Fuel Industry Volume (Litre) Forecast, by Application 2019 & 2032
- Table 25: Italy Military Jet Fuel Industry Revenue (Million) Forecast, by Application 2019 & 2032
- Table 26: Italy Military Jet Fuel Industry Volume (Litre) Forecast, by Application 2019 & 2032
- Table 27: Spain Military Jet Fuel Industry Revenue (Million) Forecast, by Application 2019 & 2032
- Table 28: Spain Military Jet Fuel Industry Volume (Litre) Forecast, by Application 2019 & 2032
- Table 29: Belgium Military Jet Fuel Industry Revenue (Million) Forecast, by Application 2019 & 2032
- Table 30: Belgium Military Jet Fuel Industry Volume (Litre) Forecast, by Application 2019 & 2032
- Table 31: Netherland Military Jet Fuel Industry Revenue (Million) Forecast, by Application 2019 & 2032
- Table 32: Netherland Military Jet Fuel Industry Volume (Litre) Forecast, by Application 2019 & 2032
- Table 33: Nordics Military Jet Fuel Industry Revenue (Million) Forecast, by Application 2019 & 2032
- Table 34: Nordics Military Jet Fuel Industry Volume (Litre) Forecast, by Application 2019 & 2032
- Table 35: Rest of Europe Military Jet Fuel Industry Revenue (Million) Forecast, by Application 2019 & 2032
- Table 36: Rest of Europe Military Jet Fuel Industry Volume (Litre) Forecast, by Application 2019 & 2032
- Table 37: Global Military Jet Fuel Industry Revenue Million Forecast, by Country 2019 & 2032
- Table 38: Global Military Jet Fuel Industry Volume Litre Forecast, by Country 2019 & 2032
- Table 39: China Military Jet Fuel Industry Revenue (Million) Forecast, by Application 2019 & 2032
- Table 40: China Military Jet Fuel Industry Volume (Litre) Forecast, by Application 2019 & 2032
- Table 41: Japan Military Jet Fuel Industry Revenue (Million) Forecast, by Application 2019 & 2032
- Table 42: Japan Military Jet Fuel Industry Volume (Litre) Forecast, by Application 2019 & 2032
- Table 43: India Military Jet Fuel Industry Revenue (Million) Forecast, by Application 2019 & 2032
- Table 44: India Military Jet Fuel Industry Volume (Litre) Forecast, by Application 2019 & 2032
- Table 45: South Korea Military Jet Fuel Industry Revenue (Million) Forecast, by Application 2019 & 2032
- Table 46: South Korea Military Jet Fuel Industry Volume (Litre) Forecast, by Application 2019 & 2032
- Table 47: Southeast Asia Military Jet Fuel Industry Revenue (Million) Forecast, by Application 2019 & 2032
- Table 48: Southeast Asia Military Jet Fuel Industry Volume (Litre) Forecast, by Application 2019 & 2032
- Table 49: Australia Military Jet Fuel Industry Revenue (Million) Forecast, by Application 2019 & 2032
- Table 50: Australia Military Jet Fuel Industry Volume (Litre) Forecast, by Application 2019 & 2032
- Table 51: Indonesia Military Jet Fuel Industry Revenue (Million) Forecast, by Application 2019 & 2032
- Table 52: Indonesia Military Jet Fuel Industry Volume (Litre) Forecast, by Application 2019 & 2032
- Table 53: Phillipes Military Jet Fuel Industry Revenue (Million) Forecast, by Application 2019 & 2032
- Table 54: Phillipes Military Jet Fuel Industry Volume (Litre) Forecast, by Application 2019 & 2032
- Table 55: Singapore Military Jet Fuel Industry Revenue (Million) Forecast, by Application 2019 & 2032
- Table 56: Singapore Military Jet Fuel Industry Volume (Litre) Forecast, by Application 2019 & 2032
- Table 57: Thailandc Military Jet Fuel Industry Revenue (Million) Forecast, by Application 2019 & 2032
- Table 58: Thailandc Military Jet Fuel Industry Volume (Litre) Forecast, by Application 2019 & 2032
- Table 59: Rest of Asia Pacific Military Jet Fuel Industry Revenue (Million) Forecast, by Application 2019 & 2032
- Table 60: Rest of Asia Pacific Military Jet Fuel Industry Volume (Litre) Forecast, by Application 2019 & 2032
- Table 61: Global Military Jet Fuel Industry Revenue Million Forecast, by Country 2019 & 2032
- Table 62: Global Military Jet Fuel Industry Volume Litre Forecast, by Country 2019 & 2032
- Table 63: Brazil Military Jet Fuel Industry Revenue (Million) Forecast, by Application 2019 & 2032
- Table 64: Brazil Military Jet Fuel Industry Volume (Litre) Forecast, by Application 2019 & 2032
- Table 65: Argentina Military Jet Fuel Industry Revenue (Million) Forecast, by Application 2019 & 2032
- Table 66: Argentina Military Jet Fuel Industry Volume (Litre) Forecast, by Application 2019 & 2032
- Table 67: Peru Military Jet Fuel Industry Revenue (Million) Forecast, by Application 2019 & 2032
- Table 68: Peru Military Jet Fuel Industry Volume (Litre) Forecast, by Application 2019 & 2032
- Table 69: Chile Military Jet Fuel Industry Revenue (Million) Forecast, by Application 2019 & 2032
- Table 70: Chile Military Jet Fuel Industry Volume (Litre) Forecast, by Application 2019 & 2032
- Table 71: Colombia Military Jet Fuel Industry Revenue (Million) Forecast, by Application 2019 & 2032
- Table 72: Colombia Military Jet Fuel Industry Volume (Litre) Forecast, by Application 2019 & 2032
- Table 73: Ecuador Military Jet Fuel Industry Revenue (Million) Forecast, by Application 2019 & 2032
- Table 74: Ecuador Military Jet Fuel Industry Volume (Litre) Forecast, by Application 2019 & 2032
- Table 75: Venezuela Military Jet Fuel Industry Revenue (Million) Forecast, by Application 2019 & 2032
- Table 76: Venezuela Military Jet Fuel Industry Volume (Litre) Forecast, by Application 2019 & 2032
- Table 77: Rest of South America Military Jet Fuel Industry Revenue (Million) Forecast, by Application 2019 & 2032
- Table 78: Rest of South America Military Jet Fuel Industry Volume (Litre) Forecast, by Application 2019 & 2032
- Table 79: Global Military Jet Fuel Industry Revenue Million Forecast, by Country 2019 & 2032
- Table 80: Global Military Jet Fuel Industry Volume Litre Forecast, by Country 2019 & 2032
- Table 81: United Arab Emirates Military Jet Fuel Industry Revenue (Million) Forecast, by Application 2019 & 2032
- Table 82: United Arab Emirates Military Jet Fuel Industry Volume (Litre) Forecast, by Application 2019 & 2032
- Table 83: Saudi Arabia Military Jet Fuel Industry Revenue (Million) Forecast, by Application 2019 & 2032
- Table 84: Saudi Arabia Military Jet Fuel Industry Volume (Litre) Forecast, by Application 2019 & 2032
- Table 85: South Africa Military Jet Fuel Industry Revenue (Million) Forecast, by Application 2019 & 2032
- Table 86: South Africa Military Jet Fuel Industry Volume (Litre) Forecast, by Application 2019 & 2032
- Table 87: Rest of Middle East and Africa Military Jet Fuel Industry Revenue (Million) Forecast, by Application 2019 & 2032
- Table 88: Rest of Middle East and Africa Military Jet Fuel Industry Volume (Litre) Forecast, by Application 2019 & 2032
- Table 89: Global Military Jet Fuel Industry Revenue Million Forecast, by Fuel Type 2019 & 2032
- Table 90: Global Military Jet Fuel Industry Volume Litre Forecast, by Fuel Type 2019 & 2032
- Table 91: Global Military Jet Fuel Industry Revenue Million Forecast, by Country 2019 & 2032
- Table 92: Global Military Jet Fuel Industry Volume Litre Forecast, by Country 2019 & 2032
- Table 93: United States Military Jet Fuel Industry Revenue (Million) Forecast, by Application 2019 & 2032
- Table 94: United States Military Jet Fuel Industry Volume (Litre) Forecast, by Application 2019 & 2032
- Table 95: Canada Military Jet Fuel Industry Revenue (Million) Forecast, by Application 2019 & 2032
- Table 96: Canada Military Jet Fuel Industry Volume (Litre) Forecast, by Application 2019 & 2032
- Table 97: Rest of North America Military Jet Fuel Industry Revenue (Million) Forecast, by Application 2019 & 2032
- Table 98: Rest of North America Military Jet Fuel Industry Volume (Litre) Forecast, by Application 2019 & 2032
- Table 99: Global Military Jet Fuel Industry Revenue Million Forecast, by Fuel Type 2019 & 2032
- Table 100: Global Military Jet Fuel Industry Volume Litre Forecast, by Fuel Type 2019 & 2032
- Table 101: Global Military Jet Fuel Industry Revenue Million Forecast, by Country 2019 & 2032
- Table 102: Global Military Jet Fuel Industry Volume Litre Forecast, by Country 2019 & 2032
- Table 103: Germany Military Jet Fuel Industry Revenue (Million) Forecast, by Application 2019 & 2032
- Table 104: Germany Military Jet Fuel Industry Volume (Litre) Forecast, by Application 2019 & 2032
- Table 105: United Kingdom Military Jet Fuel Industry Revenue (Million) Forecast, by Application 2019 & 2032
- Table 106: United Kingdom Military Jet Fuel Industry Volume (Litre) Forecast, by Application 2019 & 2032
- Table 107: Italy Military Jet Fuel Industry Revenue (Million) Forecast, by Application 2019 & 2032
- Table 108: Italy Military Jet Fuel Industry Volume (Litre) Forecast, by Application 2019 & 2032
- Table 109: France Military Jet Fuel Industry Revenue (Million) Forecast, by Application 2019 & 2032
- Table 110: France Military Jet Fuel Industry Volume (Litre) Forecast, by Application 2019 & 2032
- Table 111: Russia Military Jet Fuel Industry Revenue (Million) Forecast, by Application 2019 & 2032
- Table 112: Russia Military Jet Fuel Industry Volume (Litre) Forecast, by Application 2019 & 2032
- Table 113: Rest of North America Military Jet Fuel Industry Revenue (Million) Forecast, by Application 2019 & 2032
- Table 114: Rest of North America Military Jet Fuel Industry Volume (Litre) Forecast, by Application 2019 & 2032
- Table 115: Global Military Jet Fuel Industry Revenue Million Forecast, by Fuel Type 2019 & 2032
- Table 116: Global Military Jet Fuel Industry Volume Litre Forecast, by Fuel Type 2019 & 2032
- Table 117: Global Military Jet Fuel Industry Revenue Million Forecast, by Country 2019 & 2032
- Table 118: Global Military Jet Fuel Industry Volume Litre Forecast, by Country 2019 & 2032
- Table 119: China Military Jet Fuel Industry Revenue (Million) Forecast, by Application 2019 & 2032
- Table 120: China Military Jet Fuel Industry Volume (Litre) Forecast, by Application 2019 & 2032
- Table 121: India Military Jet Fuel Industry Revenue (Million) Forecast, by Application 2019 & 2032
- Table 122: India Military Jet Fuel Industry Volume (Litre) Forecast, by Application 2019 & 2032
- Table 123: Japan Military Jet Fuel Industry Revenue (Million) Forecast, by Application 2019 & 2032
- Table 124: Japan Military Jet Fuel Industry Volume (Litre) Forecast, by Application 2019 & 2032
- Table 125: South Korea Military Jet Fuel Industry Revenue (Million) Forecast, by Application 2019 & 2032
- Table 126: South Korea Military Jet Fuel Industry Volume (Litre) Forecast, by Application 2019 & 2032
- Table 127: Rest of Asia Pacific Military Jet Fuel Industry Revenue (Million) Forecast, by Application 2019 & 2032
- Table 128: Rest of Asia Pacific Military Jet Fuel Industry Volume (Litre) Forecast, by Application 2019 & 2032
- Table 129: Global Military Jet Fuel Industry Revenue Million Forecast, by Fuel Type 2019 & 2032
- Table 130: Global Military Jet Fuel Industry Volume Litre Forecast, by Fuel Type 2019 & 2032
- Table 131: Global Military Jet Fuel Industry Revenue Million Forecast, by Country 2019 & 2032
- Table 132: Global Military Jet Fuel Industry Volume Litre Forecast, by Country 2019 & 2032
- Table 133: Saudi Arabia Military Jet Fuel Industry Revenue (Million) Forecast, by Application 2019 & 2032
- Table 134: Saudi Arabia Military Jet Fuel Industry Volume (Litre) Forecast, by Application 2019 & 2032
- Table 135: United Arab Emirates Military Jet Fuel Industry Revenue (Million) Forecast, by Application 2019 & 2032
- Table 136: United Arab Emirates Military Jet Fuel Industry Volume (Litre) Forecast, by Application 2019 & 2032
- Table 137: South Africa Military Jet Fuel Industry Revenue (Million) Forecast, by Application 2019 & 2032
- Table 138: South Africa Military Jet Fuel Industry Volume (Litre) Forecast, by Application 2019 & 2032
- Table 139: Algeria Military Jet Fuel Industry Revenue (Million) Forecast, by Application 2019 & 2032
- Table 140: Algeria Military Jet Fuel Industry Volume (Litre) Forecast, by Application 2019 & 2032
Frequently Asked Questions
1. What is the projected Compound Annual Growth Rate (CAGR) of the Military Jet Fuel Industry?
The projected CAGR is approximately 3.84%.
2. Which companies are prominent players in the Military Jet Fuel Industry?
Key companies in the market include Honeywell International Inc, Shell PLC, Exxonmobil Corporation, Totalenergies SE, Chevron Corporation, GS Caltex Corporation, BP PLC, Repsol SA.
3. What are the main segments of the Military Jet Fuel Industry?
The market segments include Fuel Type.
4. Can you provide details about the market size?
The market size is estimated to be USD XX Million as of 2022.
5. What are some drivers contributing to market growth?
4.; Modernization and Upgrades of Existing Military Aircraft Fleets4.; Increasing Defense Budgets.
6. What are the notable trends driving market growth?
Renewable Aviation Fuel to be the Fastest Growing Market.
7. Are there any restraints impacting market growth?
4.; Shift Toward Unmanned Aircraft.
8. Can you provide examples of recent developments in the market?
July 2023: Viva Energy Refining Pty Ltd (Viva Energy) secured a contract with the Department of Defense to supply aviation, marine, and ground fuel to the Australian Defense Force (ADF). The Fuel Supply Contract is for an initial six-year term which may be extended to 12 years. As part of the deal and an essential Australian Industry Capability activity, Viva Energy is expected to resume production at Geelong Refinery of F-44 (Avcat) or JP-5, a military specification aviation turbine fuel used on aircraft carriers.
9. What pricing options are available for accessing the report?
Pricing options include single-user, multi-user, and enterprise licenses priced at USD 4750, USD 5250, and USD 8750 respectively.
10. Is the market size provided in terms of value or volume?
The market size is provided in terms of value, measured in Million and volume, measured in Litre.
11. Are there any specific market keywords associated with the report?
Yes, the market keyword associated with the report is "Military Jet Fuel Industry," which aids in identifying and referencing the specific market segment covered.
12. How do I determine which pricing option suits my needs best?
The pricing options vary based on user requirements and access needs. Individual users may opt for single-user licenses, while businesses requiring broader access may choose multi-user or enterprise licenses for cost-effective access to the report.
13. Are there any additional resources or data provided in the Military Jet Fuel Industry report?
While the report offers comprehensive insights, it's advisable to review the specific contents or supplementary materials provided to ascertain if additional resources or data are available.
14. How can I stay updated on further developments or reports in the Military Jet Fuel Industry?
To stay informed about further developments, trends, and reports in the Military Jet Fuel Industry, consider subscribing to industry newsletters, following relevant companies and organizations, or regularly checking reputable industry news sources and publications.
Methodology
Step 1 - Identification of Relevant Samples Size from Population Database


Step 2 - Approaches for Defining Global Market Size (Value, Volume* & Price*)

Note*: In applicable scenarios
Step 3 - Data Sources
Primary Research
- Web Analytics
- Survey Reports
- Research Institute
- Latest Research Reports
- Opinion Leaders
Secondary Research
- Annual Reports
- White Paper
- Latest Press Release
- Industry Association
- Paid Database
- Investor Presentations

Step 4 - Data Triangulation
Involves using different sources of information in order to increase the validity of a study
These sources are likely to be stakeholders in a program - participants, other researchers, program staff, other community members, and so on.
Then we put all data in single framework & apply various statistical tools to find out the dynamic on the market.
During the analysis stage, feedback from the stakeholder groups would be compared to determine areas of agreement as well as areas of divergence
