

Key Insights
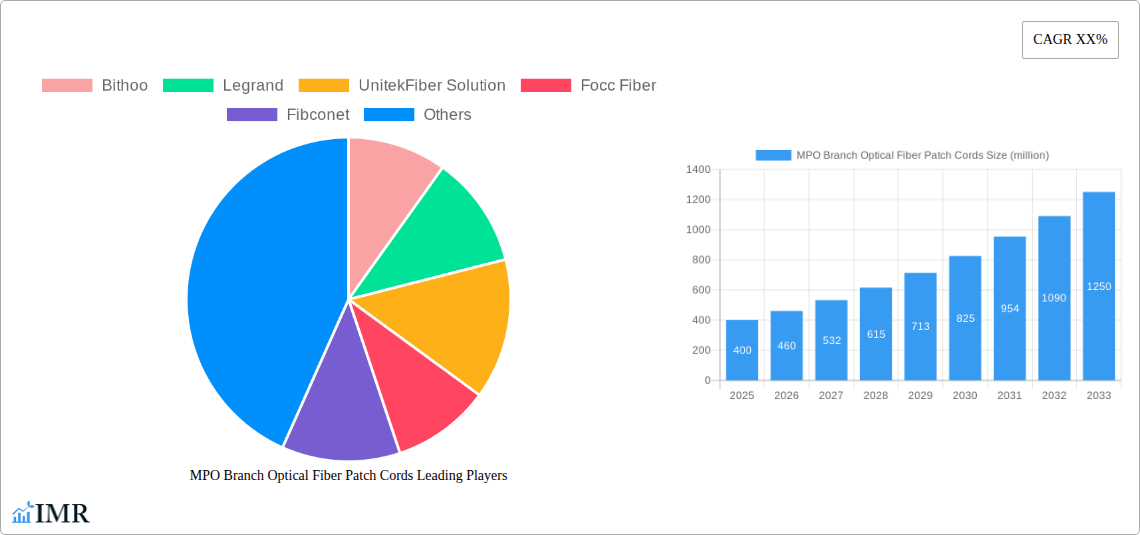
The MPO Branch Optical Fiber Patch Cord market is experiencing robust growth, driven by the increasing demand for high-bandwidth data transmission in data centers and telecommunications infrastructure. The market's expansion is fueled by the rising adoption of 400G and 800G Ethernet technologies, which necessitate higher density and efficient cabling solutions. MPO connectors, with their ability to handle multiple fibers simultaneously, offer a significant advantage over traditional single-fiber connectors, resulting in reduced cabling complexity and improved space utilization. Furthermore, the ongoing deployment of 5G networks and cloud computing infrastructure is further stimulating market growth. While the precise market size in 2025 is unavailable, considering a conservative estimate based on general industry growth trends in fiber optic connectivity and assuming a CAGR in the range of 15-20% for the past few years, a reasonable estimation for the 2025 market size would be in the range of $350-$450 million.
The market is segmented by various factors such as fiber type, connector type, application, and region. Major players like Bithoo, Legrand, Unitek Fiber Solutions, and others are actively involved in developing advanced MPO branch fiber patch cords to meet the evolving demands of the industry. However, the market faces some restraints, including the high initial investment cost associated with the adoption of MPO technology and potential compatibility issues. Despite these challenges, the long-term growth outlook remains positive due to the continuous advancements in fiber optic technologies, the expanding data center market, and the ongoing digital transformation across various industries. The competitive landscape is dynamic, characterized by both established players and emerging companies striving for innovation and market share. Future growth will likely be shaped by developments in higher-density cabling solutions and advancements in manufacturing processes that aim to reduce the overall cost of MPO technology.
MPO Branch Optical Fiber Patch Cords Market Report: 2019-2033
This comprehensive report provides an in-depth analysis of the MPO Branch Optical Fiber Patch Cord market, encompassing market dynamics, growth trends, regional dominance, product landscape, key players, and future outlook. The study period covers 2019-2033, with 2025 as the base and estimated year. The forecast period is 2025-2033, and the historical period is 2019-2024. The report is crucial for businesses operating within the broader fiber optic cabling market and the telecommunications infrastructure sectors.
MPO Branch Optical Fiber Patch Cords Market Dynamics & Structure
The MPO Branch Optical Fiber Patch Cord market is characterized by moderate concentration, with key players holding significant market share, but also witnessing emergence of smaller niche players. The market size in 2025 is estimated at xx million units. Technological innovation, particularly in higher density and improved performance fibers, is a primary growth driver. Regulatory frameworks concerning data center infrastructure and high-speed connectivity significantly influence market adoption. Competitive substitutes, such as traditional multi-fiber connectors, are being gradually replaced due to MPO’s efficiency gains. End-users primarily comprise data centers, telecom providers, and enterprise networks. M&A activity remains moderate, with an estimated xx deals in the past five years.
- Market Concentration: Moderately concentrated, with top 5 players holding approximately 60% market share in 2025.
- Technological Innovation: Focus on higher density, improved loss characteristics and smaller form factors.
- Regulatory Frameworks: Government initiatives promoting high-speed internet access and data center development influence market growth.
- Competitive Substitutes: Traditional multi-fiber connectors, facing displacement due to MPO advantages.
- End-User Demographics: Data centers, telecom providers, and enterprise networks are primary drivers.
- M&A Trends: Moderate activity, with an average of xx deals per year during 2019-2024.
MPO Branch Optical Fiber Patch Cords Growth Trends & Insights
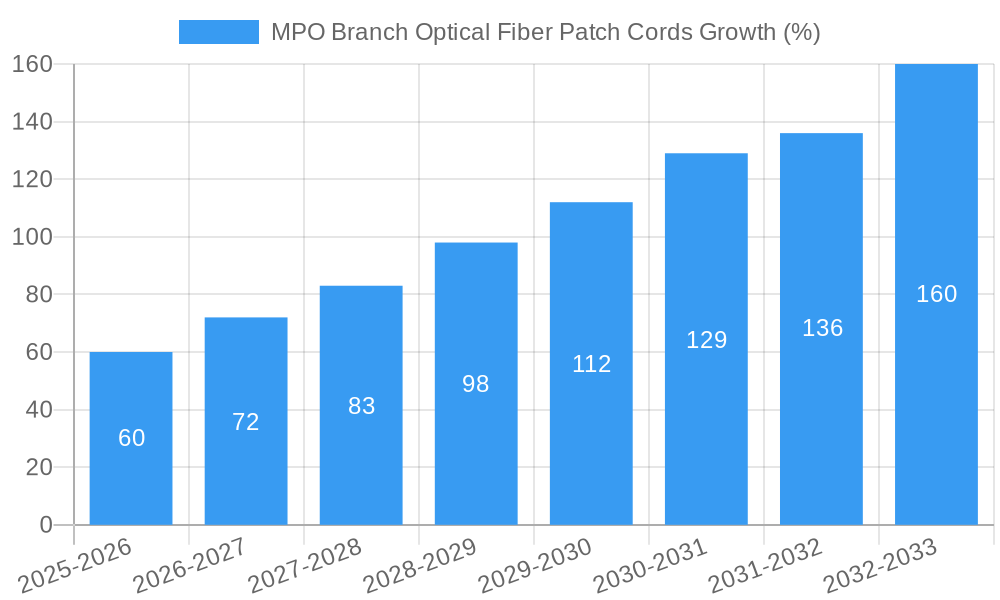
The MPO Branch Optical Fiber Patch Cord market exhibits robust growth driven by the escalating demand for high-bandwidth connectivity. The market size grew from xx million units in 2019 to an estimated xx million units in 2025, exhibiting a CAGR of xx% during the historical period. This growth is fueled by the increasing adoption of 400G and 800G Ethernet technologies in data centers and telecom networks. Technological disruptions, such as advancements in fiber optic technology and connector designs, continue to improve performance and reduce costs. Consumer behavior shifts towards cloud computing and big data analytics further amplify demand. Market penetration within existing and emerging markets is anticipated to increase steadily. The forecast period (2025-2033) projects a CAGR of xx%, reaching xx million units by 2033.
Dominant Regions, Countries, or Segments in MPO Branch Optical Fiber Patch Cords
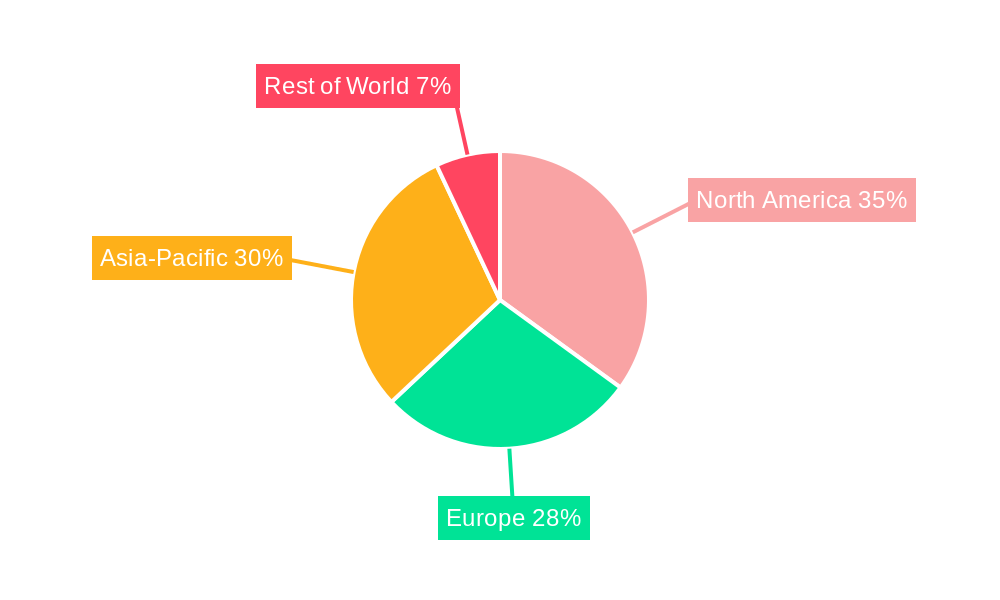
North America currently holds the leading position in the MPO Branch Optical Fiber Patch Cord market, driven primarily by the extensive deployment of advanced data centers and the presence of major telecom operators. Asia-Pacific is projected to experience significant growth in the forecast period due to rapid infrastructure development and increasing adoption in emerging economies. Specific countries like China, USA and Japan are key contributors.
- Key Drivers in North America: High density data center deployments, significant investments in 5G infrastructure, and strong presence of major telecom operators.
- Key Drivers in Asia-Pacific: Rapid infrastructure development, increasing adoption in emerging economies (India, China), and governmental support for digitalization.
- Market Share: North America holds approximately xx% market share in 2025, with Asia-Pacific projected to surpass it by 2033.
MPO Branch Optical Fiber Patch Cords Product Landscape
MPO branch optical fiber patch cords are available in various configurations, including different fiber counts (e.g., 8, 12, 24 fibers), cable types (e.g., OM3, OM4, OM5), and connector types (e.g., LC, SC). Recent innovations focus on improving performance metrics such as insertion loss and return loss. Key selling propositions include improved density, reduced cabling space, and enhanced reliability. Advancements in manufacturing processes are leading to cost reductions and increased availability.
Key Drivers, Barriers & Challenges in MPO Branch Optical Fiber Patch Cords
Key Drivers: The rising demand for high-bandwidth data transmission, driven by cloud computing, 5G networks, and the proliferation of data centers are pivotal drivers. Government initiatives promoting digital infrastructure and the ongoing development of high-speed networking technologies further stimulate market growth.
Key Challenges: Supply chain disruptions, particularly in the procurement of raw materials and components, can lead to production delays and price fluctuations. Stringent regulatory compliance requirements and intense competition among existing and emerging players also present significant challenges. The potential for counterfeit products impacting the reliability and quality of MPO branch fiber patch cords pose an additional restraint.
Emerging Opportunities in MPO Branch Optical Fiber Patch Cords
Emerging opportunities exist in the expansion into untapped markets in developing regions, focusing on customized solutions for specific applications. The development of innovative applications in areas such as 5G networks, high-performance computing, and advanced data storage solutions present further growth potential. The evolving consumer preference for higher bandwidth and greater reliability drives the demand for improved and cost-effective MPO branch fiber patch cords.
Growth Accelerators in the MPO Branch Optical Fiber Patch Cords Industry
Technological breakthroughs, specifically in high-density fiber optic cabling and advanced connector designs, significantly accelerate market growth. Strategic partnerships between manufacturers and network operators ensure efficient supply chains and broader market penetration. Market expansion strategies focusing on emerging regions and the development of specialized products further accelerate market growth.
Key Players Shaping the MPO Branch Optical Fiber Patch Cords Market
- Bithoo
- Legrand
- Unitek Fiber Solution
- Focc Fiber
- Fibconet
- Zesum Technology
- Shenzhen TRTFiber Tech
- Jiangsu Etern
- Shenzhen Optico Communication
- Shenzhen HTFuture
- Shenzhen Kuantong Optical Cable Technology
- Zhejiang Fuchunjiang Photoelectric Technology
- Zhongshan Meisu Technology
- Shenzhen ADTEK Technology
Notable Milestones in MPO Branch Optical Fiber Patch Cords Sector
- 2020: Introduction of OM5 fiber compatible MPO branch cords by several key players.
- 2021: Significant increase in M&A activity among smaller manufacturers.
- 2022: Launch of several new higher-density MPO branch cord solutions to accommodate growing bandwidth demands.
- 2023: Increased focus on sustainable and environmentally friendly manufacturing practices.
In-Depth MPO Branch Optical Fiber Patch Cords Market Outlook
The future of the MPO Branch Optical Fiber Patch Cord market is bright, with continued growth driven by increasing bandwidth demands and ongoing technological advancements. Strategic partnerships, investments in research and development, and expansion into emerging markets will play a critical role in shaping the market's trajectory. The forecast indicates substantial growth potential, presenting considerable opportunities for existing and new market entrants.
MPO Branch Optical Fiber Patch Cords Segmentation
- 1. Application
- 2. Types
MPO Branch Optical Fiber Patch Cords Segmentation By Geography
-
1. North America
- 1.1. United States
- 1.2. Canada
- 1.3. Mexico
-
2. South America
- 2.1. Brazil
- 2.2. Argentina
- 2.3. Rest of South America
-
3. Europe
- 3.1. United Kingdom
- 3.2. Germany
- 3.3. France
- 3.4. Italy
- 3.5. Spain
- 3.6. Russia
- 3.7. Benelux
- 3.8. Nordics
- 3.9. Rest of Europe
-
4. Middle East & Africa
- 4.1. Turkey
- 4.2. Israel
- 4.3. GCC
- 4.4. North Africa
- 4.5. South Africa
- 4.6. Rest of Middle East & Africa
-
5. Asia Pacific
- 5.1. China
- 5.2. India
- 5.3. Japan
- 5.4. South Korea
- 5.5. ASEAN
- 5.6. Oceania
- 5.7. Rest of Asia Pacific
MPO Branch Optical Fiber Patch Cords REPORT HIGHLIGHTS
| Aspects | Details |
|---|---|
| Study Period | 2019-2033 |
| Base Year | 2024 |
| Estimated Year | 2025 |
| Forecast Period | 2025-2033 |
| Historical Period | 2019-2024 |
| Growth Rate | CAGR of XX% from 2019-2033 |
| Segmentation |
|
Table of Contents
- 1. Introduction
- 1.1. Research Scope
- 1.2. Market Segmentation
- 1.3. Research Methodology
- 1.4. Definitions and Assumptions
- 2. Executive Summary
- 2.1. Introduction
- 3. Market Dynamics
- 3.1. Introduction
- 3.2. Market Drivers
- 3.3. Market Restrains
- 3.4. Market Trends
- 4. Market Factor Analysis
- 4.1. Porters Five Forces
- 4.2. Supply/Value Chain
- 4.3. PESTEL analysis
- 4.4. Market Entropy
- 4.5. Patent/Trademark Analysis
- 5. Global MPO Branch Optical Fiber Patch Cords Analysis, Insights and Forecast, 2019-2031
- 5.1. Market Analysis, Insights and Forecast - by Application
- 5.2. Market Analysis, Insights and Forecast - by Types
- 5.3. Market Analysis, Insights and Forecast - by Region
- 5.3.1. North America
- 5.3.2. South America
- 5.3.3. Europe
- 5.3.4. Middle East & Africa
- 5.3.5. Asia Pacific
- 5.1. Market Analysis, Insights and Forecast - by Application
- 6. North America MPO Branch Optical Fiber Patch Cords Analysis, Insights and Forecast, 2019-2031
- 6.1. Market Analysis, Insights and Forecast - by Application
- 6.2. Market Analysis, Insights and Forecast - by Types
- 6.1. Market Analysis, Insights and Forecast - by Application
- 7. South America MPO Branch Optical Fiber Patch Cords Analysis, Insights and Forecast, 2019-2031
- 7.1. Market Analysis, Insights and Forecast - by Application
- 7.2. Market Analysis, Insights and Forecast - by Types
- 7.1. Market Analysis, Insights and Forecast - by Application
- 8. Europe MPO Branch Optical Fiber Patch Cords Analysis, Insights and Forecast, 2019-2031
- 8.1. Market Analysis, Insights and Forecast - by Application
- 8.2. Market Analysis, Insights and Forecast - by Types
- 8.1. Market Analysis, Insights and Forecast - by Application
- 9. Middle East & Africa MPO Branch Optical Fiber Patch Cords Analysis, Insights and Forecast, 2019-2031
- 9.1. Market Analysis, Insights and Forecast - by Application
- 9.2. Market Analysis, Insights and Forecast - by Types
- 9.1. Market Analysis, Insights and Forecast - by Application
- 10. Asia Pacific MPO Branch Optical Fiber Patch Cords Analysis, Insights and Forecast, 2019-2031
- 10.1. Market Analysis, Insights and Forecast - by Application
- 10.2. Market Analysis, Insights and Forecast - by Types
- 10.1. Market Analysis, Insights and Forecast - by Application
- 11. Competitive Analysis
- 11.1. Global Market Share Analysis 2024
- 11.2. Company Profiles
- 11.2.1 Bithoo
- 11.2.1.1. Overview
- 11.2.1.2. Products
- 11.2.1.3. SWOT Analysis
- 11.2.1.4. Recent Developments
- 11.2.1.5. Financials (Based on Availability)
- 11.2.2 Legrand
- 11.2.2.1. Overview
- 11.2.2.2. Products
- 11.2.2.3. SWOT Analysis
- 11.2.2.4. Recent Developments
- 11.2.2.5. Financials (Based on Availability)
- 11.2.3 UnitekFiber Solution
- 11.2.3.1. Overview
- 11.2.3.2. Products
- 11.2.3.3. SWOT Analysis
- 11.2.3.4. Recent Developments
- 11.2.3.5. Financials (Based on Availability)
- 11.2.4 Focc Fiber
- 11.2.4.1. Overview
- 11.2.4.2. Products
- 11.2.4.3. SWOT Analysis
- 11.2.4.4. Recent Developments
- 11.2.4.5. Financials (Based on Availability)
- 11.2.5 Fibconet
- 11.2.5.1. Overview
- 11.2.5.2. Products
- 11.2.5.3. SWOT Analysis
- 11.2.5.4. Recent Developments
- 11.2.5.5. Financials (Based on Availability)
- 11.2.6 Zesum Technology
- 11.2.6.1. Overview
- 11.2.6.2. Products
- 11.2.6.3. SWOT Analysis
- 11.2.6.4. Recent Developments
- 11.2.6.5. Financials (Based on Availability)
- 11.2.7 Shenzhen TRTFiber Tech
- 11.2.7.1. Overview
- 11.2.7.2. Products
- 11.2.7.3. SWOT Analysis
- 11.2.7.4. Recent Developments
- 11.2.7.5. Financials (Based on Availability)
- 11.2.8 Jiangsu Etern
- 11.2.8.1. Overview
- 11.2.8.2. Products
- 11.2.8.3. SWOT Analysis
- 11.2.8.4. Recent Developments
- 11.2.8.5. Financials (Based on Availability)
- 11.2.9 Shenzhen Optico Communication
- 11.2.9.1. Overview
- 11.2.9.2. Products
- 11.2.9.3. SWOT Analysis
- 11.2.9.4. Recent Developments
- 11.2.9.5. Financials (Based on Availability)
- 11.2.10 Shenzhen HTFuture
- 11.2.10.1. Overview
- 11.2.10.2. Products
- 11.2.10.3. SWOT Analysis
- 11.2.10.4. Recent Developments
- 11.2.10.5. Financials (Based on Availability)
- 11.2.11 Shenzhen Kuantong Optical Cable Technology
- 11.2.11.1. Overview
- 11.2.11.2. Products
- 11.2.11.3. SWOT Analysis
- 11.2.11.4. Recent Developments
- 11.2.11.5. Financials (Based on Availability)
- 11.2.12 Zhejiang Fuchunjiang Photoelectric Technology
- 11.2.12.1. Overview
- 11.2.12.2. Products
- 11.2.12.3. SWOT Analysis
- 11.2.12.4. Recent Developments
- 11.2.12.5. Financials (Based on Availability)
- 11.2.13 Zhongshan Meisu Technology
- 11.2.13.1. Overview
- 11.2.13.2. Products
- 11.2.13.3. SWOT Analysis
- 11.2.13.4. Recent Developments
- 11.2.13.5. Financials (Based on Availability)
- 11.2.14 Shenzhen ADTEK Technology
- 11.2.14.1. Overview
- 11.2.14.2. Products
- 11.2.14.3. SWOT Analysis
- 11.2.14.4. Recent Developments
- 11.2.14.5. Financials (Based on Availability)
- 11.2.1 Bithoo
List of Figures
- Figure 1: Global MPO Branch Optical Fiber Patch Cords Revenue Breakdown (million, %) by Region 2024 & 2032
- Figure 2: Global MPO Branch Optical Fiber Patch Cords Volume Breakdown (K, %) by Region 2024 & 2032
- Figure 3: North America MPO Branch Optical Fiber Patch Cords Revenue (million), by Application 2024 & 2032
- Figure 4: North America MPO Branch Optical Fiber Patch Cords Volume (K), by Application 2024 & 2032
- Figure 5: North America MPO Branch Optical Fiber Patch Cords Revenue Share (%), by Application 2024 & 2032
- Figure 6: North America MPO Branch Optical Fiber Patch Cords Volume Share (%), by Application 2024 & 2032
- Figure 7: North America MPO Branch Optical Fiber Patch Cords Revenue (million), by Types 2024 & 2032
- Figure 8: North America MPO Branch Optical Fiber Patch Cords Volume (K), by Types 2024 & 2032
- Figure 9: North America MPO Branch Optical Fiber Patch Cords Revenue Share (%), by Types 2024 & 2032
- Figure 10: North America MPO Branch Optical Fiber Patch Cords Volume Share (%), by Types 2024 & 2032
- Figure 11: North America MPO Branch Optical Fiber Patch Cords Revenue (million), by Country 2024 & 2032
- Figure 12: North America MPO Branch Optical Fiber Patch Cords Volume (K), by Country 2024 & 2032
- Figure 13: North America MPO Branch Optical Fiber Patch Cords Revenue Share (%), by Country 2024 & 2032
- Figure 14: North America MPO Branch Optical Fiber Patch Cords Volume Share (%), by Country 2024 & 2032
- Figure 15: South America MPO Branch Optical Fiber Patch Cords Revenue (million), by Application 2024 & 2032
- Figure 16: South America MPO Branch Optical Fiber Patch Cords Volume (K), by Application 2024 & 2032
- Figure 17: South America MPO Branch Optical Fiber Patch Cords Revenue Share (%), by Application 2024 & 2032
- Figure 18: South America MPO Branch Optical Fiber Patch Cords Volume Share (%), by Application 2024 & 2032
- Figure 19: South America MPO Branch Optical Fiber Patch Cords Revenue (million), by Types 2024 & 2032
- Figure 20: South America MPO Branch Optical Fiber Patch Cords Volume (K), by Types 2024 & 2032
- Figure 21: South America MPO Branch Optical Fiber Patch Cords Revenue Share (%), by Types 2024 & 2032
- Figure 22: South America MPO Branch Optical Fiber Patch Cords Volume Share (%), by Types 2024 & 2032
- Figure 23: South America MPO Branch Optical Fiber Patch Cords Revenue (million), by Country 2024 & 2032
- Figure 24: South America MPO Branch Optical Fiber Patch Cords Volume (K), by Country 2024 & 2032
- Figure 25: South America MPO Branch Optical Fiber Patch Cords Revenue Share (%), by Country 2024 & 2032
- Figure 26: South America MPO Branch Optical Fiber Patch Cords Volume Share (%), by Country 2024 & 2032
- Figure 27: Europe MPO Branch Optical Fiber Patch Cords Revenue (million), by Application 2024 & 2032
- Figure 28: Europe MPO Branch Optical Fiber Patch Cords Volume (K), by Application 2024 & 2032
- Figure 29: Europe MPO Branch Optical Fiber Patch Cords Revenue Share (%), by Application 2024 & 2032
- Figure 30: Europe MPO Branch Optical Fiber Patch Cords Volume Share (%), by Application 2024 & 2032
- Figure 31: Europe MPO Branch Optical Fiber Patch Cords Revenue (million), by Types 2024 & 2032
- Figure 32: Europe MPO Branch Optical Fiber Patch Cords Volume (K), by Types 2024 & 2032
- Figure 33: Europe MPO Branch Optical Fiber Patch Cords Revenue Share (%), by Types 2024 & 2032
- Figure 34: Europe MPO Branch Optical Fiber Patch Cords Volume Share (%), by Types 2024 & 2032
- Figure 35: Europe MPO Branch Optical Fiber Patch Cords Revenue (million), by Country 2024 & 2032
- Figure 36: Europe MPO Branch Optical Fiber Patch Cords Volume (K), by Country 2024 & 2032
- Figure 37: Europe MPO Branch Optical Fiber Patch Cords Revenue Share (%), by Country 2024 & 2032
- Figure 38: Europe MPO Branch Optical Fiber Patch Cords Volume Share (%), by Country 2024 & 2032
- Figure 39: Middle East & Africa MPO Branch Optical Fiber Patch Cords Revenue (million), by Application 2024 & 2032
- Figure 40: Middle East & Africa MPO Branch Optical Fiber Patch Cords Volume (K), by Application 2024 & 2032
- Figure 41: Middle East & Africa MPO Branch Optical Fiber Patch Cords Revenue Share (%), by Application 2024 & 2032
- Figure 42: Middle East & Africa MPO Branch Optical Fiber Patch Cords Volume Share (%), by Application 2024 & 2032
- Figure 43: Middle East & Africa MPO Branch Optical Fiber Patch Cords Revenue (million), by Types 2024 & 2032
- Figure 44: Middle East & Africa MPO Branch Optical Fiber Patch Cords Volume (K), by Types 2024 & 2032
- Figure 45: Middle East & Africa MPO Branch Optical Fiber Patch Cords Revenue Share (%), by Types 2024 & 2032
- Figure 46: Middle East & Africa MPO Branch Optical Fiber Patch Cords Volume Share (%), by Types 2024 & 2032
- Figure 47: Middle East & Africa MPO Branch Optical Fiber Patch Cords Revenue (million), by Country 2024 & 2032
- Figure 48: Middle East & Africa MPO Branch Optical Fiber Patch Cords Volume (K), by Country 2024 & 2032
- Figure 49: Middle East & Africa MPO Branch Optical Fiber Patch Cords Revenue Share (%), by Country 2024 & 2032
- Figure 50: Middle East & Africa MPO Branch Optical Fiber Patch Cords Volume Share (%), by Country 2024 & 2032
- Figure 51: Asia Pacific MPO Branch Optical Fiber Patch Cords Revenue (million), by Application 2024 & 2032
- Figure 52: Asia Pacific MPO Branch Optical Fiber Patch Cords Volume (K), by Application 2024 & 2032
- Figure 53: Asia Pacific MPO Branch Optical Fiber Patch Cords Revenue Share (%), by Application 2024 & 2032
- Figure 54: Asia Pacific MPO Branch Optical Fiber Patch Cords Volume Share (%), by Application 2024 & 2032
- Figure 55: Asia Pacific MPO Branch Optical Fiber Patch Cords Revenue (million), by Types 2024 & 2032
- Figure 56: Asia Pacific MPO Branch Optical Fiber Patch Cords Volume (K), by Types 2024 & 2032
- Figure 57: Asia Pacific MPO Branch Optical Fiber Patch Cords Revenue Share (%), by Types 2024 & 2032
- Figure 58: Asia Pacific MPO Branch Optical Fiber Patch Cords Volume Share (%), by Types 2024 & 2032
- Figure 59: Asia Pacific MPO Branch Optical Fiber Patch Cords Revenue (million), by Country 2024 & 2032
- Figure 60: Asia Pacific MPO Branch Optical Fiber Patch Cords Volume (K), by Country 2024 & 2032
- Figure 61: Asia Pacific MPO Branch Optical Fiber Patch Cords Revenue Share (%), by Country 2024 & 2032
- Figure 62: Asia Pacific MPO Branch Optical Fiber Patch Cords Volume Share (%), by Country 2024 & 2032
List of Tables
- Table 1: Global MPO Branch Optical Fiber Patch Cords Revenue million Forecast, by Region 2019 & 2032
- Table 2: Global MPO Branch Optical Fiber Patch Cords Volume K Forecast, by Region 2019 & 2032
- Table 3: Global MPO Branch Optical Fiber Patch Cords Revenue million Forecast, by Application 2019 & 2032
- Table 4: Global MPO Branch Optical Fiber Patch Cords Volume K Forecast, by Application 2019 & 2032
- Table 5: Global MPO Branch Optical Fiber Patch Cords Revenue million Forecast, by Types 2019 & 2032
- Table 6: Global MPO Branch Optical Fiber Patch Cords Volume K Forecast, by Types 2019 & 2032
- Table 7: Global MPO Branch Optical Fiber Patch Cords Revenue million Forecast, by Region 2019 & 2032
- Table 8: Global MPO Branch Optical Fiber Patch Cords Volume K Forecast, by Region 2019 & 2032
- Table 9: Global MPO Branch Optical Fiber Patch Cords Revenue million Forecast, by Application 2019 & 2032
- Table 10: Global MPO Branch Optical Fiber Patch Cords Volume K Forecast, by Application 2019 & 2032
- Table 11: Global MPO Branch Optical Fiber Patch Cords Revenue million Forecast, by Types 2019 & 2032
- Table 12: Global MPO Branch Optical Fiber Patch Cords Volume K Forecast, by Types 2019 & 2032
- Table 13: Global MPO Branch Optical Fiber Patch Cords Revenue million Forecast, by Country 2019 & 2032
- Table 14: Global MPO Branch Optical Fiber Patch Cords Volume K Forecast, by Country 2019 & 2032
- Table 15: United States MPO Branch Optical Fiber Patch Cords Revenue (million) Forecast, by Application 2019 & 2032
- Table 16: United States MPO Branch Optical Fiber Patch Cords Volume (K) Forecast, by Application 2019 & 2032
- Table 17: Canada MPO Branch Optical Fiber Patch Cords Revenue (million) Forecast, by Application 2019 & 2032
- Table 18: Canada MPO Branch Optical Fiber Patch Cords Volume (K) Forecast, by Application 2019 & 2032
- Table 19: Mexico MPO Branch Optical Fiber Patch Cords Revenue (million) Forecast, by Application 2019 & 2032
- Table 20: Mexico MPO Branch Optical Fiber Patch Cords Volume (K) Forecast, by Application 2019 & 2032
- Table 21: Global MPO Branch Optical Fiber Patch Cords Revenue million Forecast, by Application 2019 & 2032
- Table 22: Global MPO Branch Optical Fiber Patch Cords Volume K Forecast, by Application 2019 & 2032
- Table 23: Global MPO Branch Optical Fiber Patch Cords Revenue million Forecast, by Types 2019 & 2032
- Table 24: Global MPO Branch Optical Fiber Patch Cords Volume K Forecast, by Types 2019 & 2032
- Table 25: Global MPO Branch Optical Fiber Patch Cords Revenue million Forecast, by Country 2019 & 2032
- Table 26: Global MPO Branch Optical Fiber Patch Cords Volume K Forecast, by Country 2019 & 2032
- Table 27: Brazil MPO Branch Optical Fiber Patch Cords Revenue (million) Forecast, by Application 2019 & 2032
- Table 28: Brazil MPO Branch Optical Fiber Patch Cords Volume (K) Forecast, by Application 2019 & 2032
- Table 29: Argentina MPO Branch Optical Fiber Patch Cords Revenue (million) Forecast, by Application 2019 & 2032
- Table 30: Argentina MPO Branch Optical Fiber Patch Cords Volume (K) Forecast, by Application 2019 & 2032
- Table 31: Rest of South America MPO Branch Optical Fiber Patch Cords Revenue (million) Forecast, by Application 2019 & 2032
- Table 32: Rest of South America MPO Branch Optical Fiber Patch Cords Volume (K) Forecast, by Application 2019 & 2032
- Table 33: Global MPO Branch Optical Fiber Patch Cords Revenue million Forecast, by Application 2019 & 2032
- Table 34: Global MPO Branch Optical Fiber Patch Cords Volume K Forecast, by Application 2019 & 2032
- Table 35: Global MPO Branch Optical Fiber Patch Cords Revenue million Forecast, by Types 2019 & 2032
- Table 36: Global MPO Branch Optical Fiber Patch Cords Volume K Forecast, by Types 2019 & 2032
- Table 37: Global MPO Branch Optical Fiber Patch Cords Revenue million Forecast, by Country 2019 & 2032
- Table 38: Global MPO Branch Optical Fiber Patch Cords Volume K Forecast, by Country 2019 & 2032
- Table 39: United Kingdom MPO Branch Optical Fiber Patch Cords Revenue (million) Forecast, by Application 2019 & 2032
- Table 40: United Kingdom MPO Branch Optical Fiber Patch Cords Volume (K) Forecast, by Application 2019 & 2032
- Table 41: Germany MPO Branch Optical Fiber Patch Cords Revenue (million) Forecast, by Application 2019 & 2032
- Table 42: Germany MPO Branch Optical Fiber Patch Cords Volume (K) Forecast, by Application 2019 & 2032
- Table 43: France MPO Branch Optical Fiber Patch Cords Revenue (million) Forecast, by Application 2019 & 2032
- Table 44: France MPO Branch Optical Fiber Patch Cords Volume (K) Forecast, by Application 2019 & 2032
- Table 45: Italy MPO Branch Optical Fiber Patch Cords Revenue (million) Forecast, by Application 2019 & 2032
- Table 46: Italy MPO Branch Optical Fiber Patch Cords Volume (K) Forecast, by Application 2019 & 2032
- Table 47: Spain MPO Branch Optical Fiber Patch Cords Revenue (million) Forecast, by Application 2019 & 2032
- Table 48: Spain MPO Branch Optical Fiber Patch Cords Volume (K) Forecast, by Application 2019 & 2032
- Table 49: Russia MPO Branch Optical Fiber Patch Cords Revenue (million) Forecast, by Application 2019 & 2032
- Table 50: Russia MPO Branch Optical Fiber Patch Cords Volume (K) Forecast, by Application 2019 & 2032
- Table 51: Benelux MPO Branch Optical Fiber Patch Cords Revenue (million) Forecast, by Application 2019 & 2032
- Table 52: Benelux MPO Branch Optical Fiber Patch Cords Volume (K) Forecast, by Application 2019 & 2032
- Table 53: Nordics MPO Branch Optical Fiber Patch Cords Revenue (million) Forecast, by Application 2019 & 2032
- Table 54: Nordics MPO Branch Optical Fiber Patch Cords Volume (K) Forecast, by Application 2019 & 2032
- Table 55: Rest of Europe MPO Branch Optical Fiber Patch Cords Revenue (million) Forecast, by Application 2019 & 2032
- Table 56: Rest of Europe MPO Branch Optical Fiber Patch Cords Volume (K) Forecast, by Application 2019 & 2032
- Table 57: Global MPO Branch Optical Fiber Patch Cords Revenue million Forecast, by Application 2019 & 2032
- Table 58: Global MPO Branch Optical Fiber Patch Cords Volume K Forecast, by Application 2019 & 2032
- Table 59: Global MPO Branch Optical Fiber Patch Cords Revenue million Forecast, by Types 2019 & 2032
- Table 60: Global MPO Branch Optical Fiber Patch Cords Volume K Forecast, by Types 2019 & 2032
- Table 61: Global MPO Branch Optical Fiber Patch Cords Revenue million Forecast, by Country 2019 & 2032
- Table 62: Global MPO Branch Optical Fiber Patch Cords Volume K Forecast, by Country 2019 & 2032
- Table 63: Turkey MPO Branch Optical Fiber Patch Cords Revenue (million) Forecast, by Application 2019 & 2032
- Table 64: Turkey MPO Branch Optical Fiber Patch Cords Volume (K) Forecast, by Application 2019 & 2032
- Table 65: Israel MPO Branch Optical Fiber Patch Cords Revenue (million) Forecast, by Application 2019 & 2032
- Table 66: Israel MPO Branch Optical Fiber Patch Cords Volume (K) Forecast, by Application 2019 & 2032
- Table 67: GCC MPO Branch Optical Fiber Patch Cords Revenue (million) Forecast, by Application 2019 & 2032
- Table 68: GCC MPO Branch Optical Fiber Patch Cords Volume (K) Forecast, by Application 2019 & 2032
- Table 69: North Africa MPO Branch Optical Fiber Patch Cords Revenue (million) Forecast, by Application 2019 & 2032
- Table 70: North Africa MPO Branch Optical Fiber Patch Cords Volume (K) Forecast, by Application 2019 & 2032
- Table 71: South Africa MPO Branch Optical Fiber Patch Cords Revenue (million) Forecast, by Application 2019 & 2032
- Table 72: South Africa MPO Branch Optical Fiber Patch Cords Volume (K) Forecast, by Application 2019 & 2032
- Table 73: Rest of Middle East & Africa MPO Branch Optical Fiber Patch Cords Revenue (million) Forecast, by Application 2019 & 2032
- Table 74: Rest of Middle East & Africa MPO Branch Optical Fiber Patch Cords Volume (K) Forecast, by Application 2019 & 2032
- Table 75: Global MPO Branch Optical Fiber Patch Cords Revenue million Forecast, by Application 2019 & 2032
- Table 76: Global MPO Branch Optical Fiber Patch Cords Volume K Forecast, by Application 2019 & 2032
- Table 77: Global MPO Branch Optical Fiber Patch Cords Revenue million Forecast, by Types 2019 & 2032
- Table 78: Global MPO Branch Optical Fiber Patch Cords Volume K Forecast, by Types 2019 & 2032
- Table 79: Global MPO Branch Optical Fiber Patch Cords Revenue million Forecast, by Country 2019 & 2032
- Table 80: Global MPO Branch Optical Fiber Patch Cords Volume K Forecast, by Country 2019 & 2032
- Table 81: China MPO Branch Optical Fiber Patch Cords Revenue (million) Forecast, by Application 2019 & 2032
- Table 82: China MPO Branch Optical Fiber Patch Cords Volume (K) Forecast, by Application 2019 & 2032
- Table 83: India MPO Branch Optical Fiber Patch Cords Revenue (million) Forecast, by Application 2019 & 2032
- Table 84: India MPO Branch Optical Fiber Patch Cords Volume (K) Forecast, by Application 2019 & 2032
- Table 85: Japan MPO Branch Optical Fiber Patch Cords Revenue (million) Forecast, by Application 2019 & 2032
- Table 86: Japan MPO Branch Optical Fiber Patch Cords Volume (K) Forecast, by Application 2019 & 2032
- Table 87: South Korea MPO Branch Optical Fiber Patch Cords Revenue (million) Forecast, by Application 2019 & 2032
- Table 88: South Korea MPO Branch Optical Fiber Patch Cords Volume (K) Forecast, by Application 2019 & 2032
- Table 89: ASEAN MPO Branch Optical Fiber Patch Cords Revenue (million) Forecast, by Application 2019 & 2032
- Table 90: ASEAN MPO Branch Optical Fiber Patch Cords Volume (K) Forecast, by Application 2019 & 2032
- Table 91: Oceania MPO Branch Optical Fiber Patch Cords Revenue (million) Forecast, by Application 2019 & 2032
- Table 92: Oceania MPO Branch Optical Fiber Patch Cords Volume (K) Forecast, by Application 2019 & 2032
- Table 93: Rest of Asia Pacific MPO Branch Optical Fiber Patch Cords Revenue (million) Forecast, by Application 2019 & 2032
- Table 94: Rest of Asia Pacific MPO Branch Optical Fiber Patch Cords Volume (K) Forecast, by Application 2019 & 2032
Frequently Asked Questions
1. What is the projected Compound Annual Growth Rate (CAGR) of the MPO Branch Optical Fiber Patch Cords?
The projected CAGR is approximately XX%.
2. Which companies are prominent players in the MPO Branch Optical Fiber Patch Cords?
Key companies in the market include Bithoo, Legrand, UnitekFiber Solution, Focc Fiber, Fibconet, Zesum Technology, Shenzhen TRTFiber Tech, Jiangsu Etern, Shenzhen Optico Communication, Shenzhen HTFuture, Shenzhen Kuantong Optical Cable Technology, Zhejiang Fuchunjiang Photoelectric Technology, Zhongshan Meisu Technology, Shenzhen ADTEK Technology.
3. What are the main segments of the MPO Branch Optical Fiber Patch Cords?
The market segments include Application, Types.
4. Can you provide details about the market size?
The market size is estimated to be USD XXX million as of 2022.
5. What are some drivers contributing to market growth?
N/A
6. What are the notable trends driving market growth?
N/A
7. Are there any restraints impacting market growth?
N/A
8. Can you provide examples of recent developments in the market?
N/A
9. What pricing options are available for accessing the report?
Pricing options include single-user, multi-user, and enterprise licenses priced at USD 3350.00, USD 5025.00, and USD 6700.00 respectively.
10. Is the market size provided in terms of value or volume?
The market size is provided in terms of value, measured in million and volume, measured in K.
11. Are there any specific market keywords associated with the report?
Yes, the market keyword associated with the report is "MPO Branch Optical Fiber Patch Cords," which aids in identifying and referencing the specific market segment covered.
12. How do I determine which pricing option suits my needs best?
The pricing options vary based on user requirements and access needs. Individual users may opt for single-user licenses, while businesses requiring broader access may choose multi-user or enterprise licenses for cost-effective access to the report.
13. Are there any additional resources or data provided in the MPO Branch Optical Fiber Patch Cords report?
While the report offers comprehensive insights, it's advisable to review the specific contents or supplementary materials provided to ascertain if additional resources or data are available.
14. How can I stay updated on further developments or reports in the MPO Branch Optical Fiber Patch Cords?
To stay informed about further developments, trends, and reports in the MPO Branch Optical Fiber Patch Cords, consider subscribing to industry newsletters, following relevant companies and organizations, or regularly checking reputable industry news sources and publications.
Methodology
Step 1 - Identification of Relevant Samples Size from Population Database


Step 2 - Approaches for Defining Global Market Size (Value, Volume* & Price*)

Note*: In applicable scenarios
Step 3 - Data Sources
Primary Research
- Web Analytics
- Survey Reports
- Research Institute
- Latest Research Reports
- Opinion Leaders
Secondary Research
- Annual Reports
- White Paper
- Latest Press Release
- Industry Association
- Paid Database
- Investor Presentations

Step 4 - Data Triangulation
Involves using different sources of information in order to increase the validity of a study
These sources are likely to be stakeholders in a program - participants, other researchers, program staff, other community members, and so on.
Then we put all data in single framework & apply various statistical tools to find out the dynamic on the market.
During the analysis stage, feedback from the stakeholder groups would be compared to determine areas of agreement as well as areas of divergence
