

Key Insights
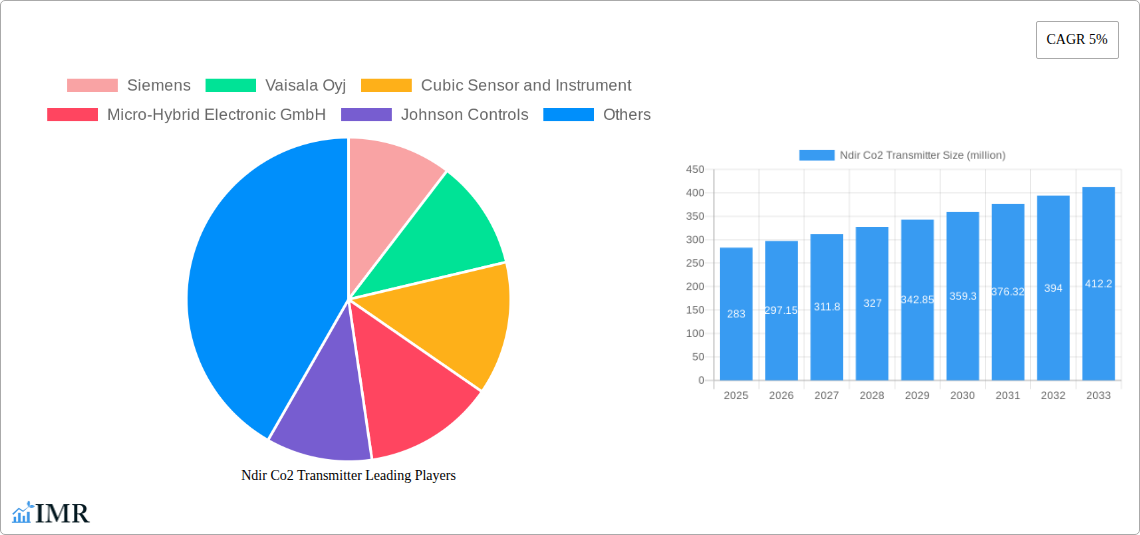
The NDIR CO2 transmitter market, valued at $283 million in 2025, is projected to experience steady growth, driven by increasing environmental awareness and stringent regulatory measures promoting carbon emission reduction. The 5% CAGR indicates a consistent demand for precise CO2 monitoring across various sectors, including building automation, industrial process control, and greenhouse gas management. Key drivers include the growing adoption of smart buildings, the expansion of industrial automation, and a rising focus on energy efficiency. Technological advancements, such as the development of more compact and cost-effective sensors, are further fueling market expansion. While potential restraints might include high initial investment costs for certain applications and the emergence of competing technologies, the overall market outlook remains positive, particularly considering the global emphasis on climate change mitigation and sustainable practices. The competitive landscape is populated by established players like Siemens and Johnson Controls, alongside specialized sensor manufacturers, indicating a mature yet dynamic market with opportunities for both innovation and consolidation.
The forecast period (2025-2033) suggests a significant market expansion, driven by the aforementioned factors. Market segmentation likely includes various sensor types based on accuracy, range, and communication protocols. Regional growth will probably vary, with developed nations showing a more mature market and developing economies demonstrating higher growth potential as infrastructure and industrialization advance. The presence of companies like Vaisala Oyj, known for their precision measurement instruments, highlights the need for high-accuracy CO2 sensing in various applications. This suggests strong future demand for advanced NDIR CO2 transmitters capable of precise and reliable measurements, contributing to the market's continued growth.
NDIR CO2 Transmitter Market Report: 2019-2033
This comprehensive report provides an in-depth analysis of the global NDIR CO2 transmitter market, encompassing market dynamics, growth trends, regional analysis, competitive landscape, and future outlook. The study period covers 2019-2033, with 2025 as the base and estimated year. This report is crucial for industry professionals, investors, and strategists seeking to understand and capitalize on opportunities within this rapidly evolving sector. The parent market is the gas detection market (valued at xx million units in 2025), and the child market is the industrial automation and building management systems.
NDIR CO2 Transmitter Market Dynamics & Structure
The NDIR CO2 transmitter market exhibits moderate concentration, with key players like Siemens, Vaisala Oyj, and Johnson Controls holding significant market share (estimated at xx% combined in 2025). Technological innovation, driven by advancements in sensor technology and miniaturization, is a primary growth driver. Stringent environmental regulations regarding indoor air quality are also propelling demand. Competitive substitutes, such as electrochemical sensors, exist but NDIR technology maintains dominance due to its accuracy and cost-effectiveness. The end-user demographics span diverse sectors, including HVAC, industrial automation, and healthcare. M&A activity has been moderate (xx deals in the past 5 years), primarily focused on enhancing product portfolios and geographical reach.
- Market Concentration: Moderately concentrated, with top 3 players holding xx% market share in 2025.
- Technological Innovation: Advancements in sensor technology and miniaturization are key drivers.
- Regulatory Landscape: Stringent environmental regulations are boosting demand.
- Competitive Substitutes: Electrochemical sensors present competition, but NDIR maintains its lead.
- End-User Demographics: Diverse sectors including HVAC, industrial, healthcare, and agriculture.
- M&A Activity: Moderate activity (xx deals in the last 5 years) focused on expansion.
NDIR CO2 Transmitter Growth Trends & Insights
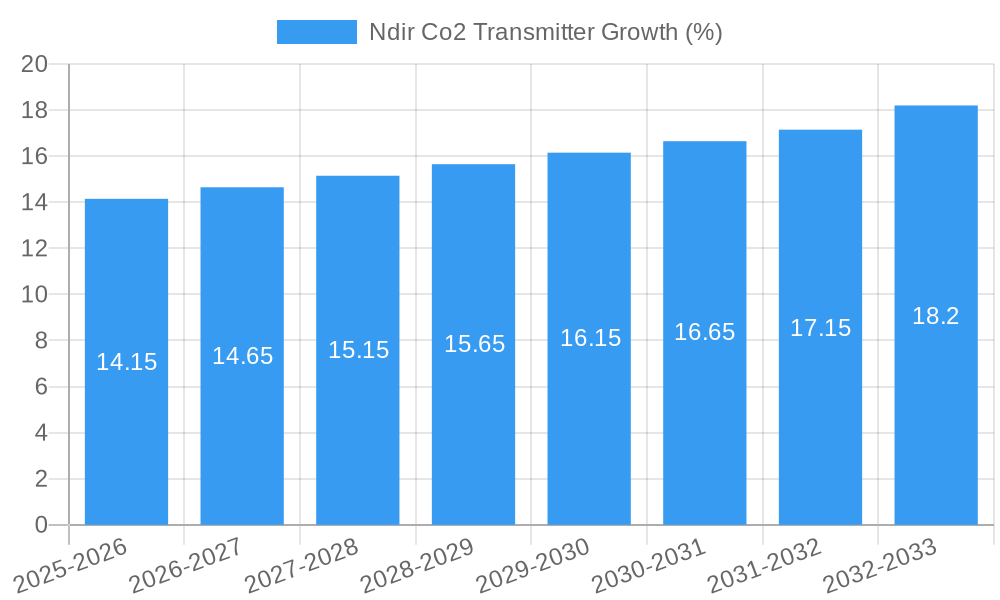
The global NDIR CO2 transmitter market experienced significant growth during the historical period (2019-2024), with a CAGR of xx%. This growth is projected to continue during the forecast period (2025-2033), reaching xx million units by 2033, driven by increasing adoption across various sectors. Technological disruptions, such as the emergence of IoT-enabled devices and improved data analytics capabilities, are further accelerating market expansion. Consumer behavior is shifting towards greater awareness of indoor air quality, pushing demand for sophisticated CO2 monitoring solutions. Market penetration remains relatively low in several developing regions, presenting substantial untapped potential.
- Market Size Evolution: CAGR of xx% during 2019-2024; projected to reach xx million units by 2033.
- Adoption Rates: Increasing adoption across diverse sectors, particularly in building automation and industrial settings.
- Technological Disruptions: IoT integration, improved data analytics, and miniaturization are key drivers.
- Consumer Behavior Shifts: Growing awareness of indoor air quality is a major market influencer.
Dominant Regions, Countries, or Segments in NDIR CO2 Transmitter
North America currently dominates the NDIR CO2 transmitter market, holding the largest market share (xx% in 2025) due to strong regulatory frameworks and high adoption rates in advanced economies. Europe follows closely, driven by similar factors. Asia-Pacific exhibits significant growth potential, fueled by rapid industrialization and urbanization.
- North America: Dominant market share (xx% in 2025) due to strong regulations and high adoption.
- Europe: High adoption rates and stringent environmental regulations fuel market growth.
- Asia-Pacific: Significant growth potential due to industrialization and urbanization.
- Key Drivers: Stringent environmental regulations, growing awareness of indoor air quality, and industrial automation.
NDIR CO2 Transmitter Product Landscape
NDIR CO2 transmitters are available in various configurations, ranging from standalone devices to integrated systems. Key features include high accuracy, long-term stability, and low maintenance. Recent innovations focus on improving energy efficiency, reducing size, and enhancing connectivity options. Unique selling propositions include superior accuracy compared to other sensing technologies, real-time data monitoring capabilities, and seamless integration with existing building management systems.
Key Drivers, Barriers & Challenges in NDIR CO2 Transmitter
Key Drivers: Increasing environmental awareness, stringent regulations concerning indoor air quality, and the growing adoption of smart building technologies are major drivers. Advances in sensor miniaturization and cost reduction are also contributing factors.
Key Challenges: High initial investment costs can hinder adoption, particularly in developing regions. Competition from alternative technologies and supply chain disruptions pose additional challenges. The need for regular calibration and potential sensor drift also present limitations.
Emerging Opportunities in NDIR CO2 Transmitter
Untapped markets in developing countries present significant growth opportunities. The integration of NDIR CO2 transmitters into IoT-based systems opens avenues for remote monitoring and data analytics, creating new revenue streams. Moreover, advancements in sensor technology, such as the development of more energy-efficient and smaller devices, will unlock further market expansion.
Growth Accelerators in the NDIR CO2 Transmitter Industry
Technological advancements, strategic partnerships between sensor manufacturers and system integrators, and expansion into new markets are key growth accelerators. Government incentives and policies promoting energy efficiency and green building technologies are also supportive factors.
Key Players Shaping the NDIR CO2 Transmitter Market
- Siemens
- Vaisala Oyj
- Cubic Sensor and Instrument
- Micro-Hybrid Electronic GmbH
- Johnson Controls
- Schneider Electric
- Dwyer Instruments
- InHand Networks
Notable Milestones in NDIR CO2 Transmitter Sector
- 2020: Launch of a new generation of energy-efficient NDIR CO2 sensors by Vaisala.
- 2022: Siemens acquires a smaller sensor technology company, expanding its product portfolio.
- 2023: Introduction of IoT-enabled NDIR CO2 transmitters by Johnson Controls.
In-Depth NDIR CO2 Transmitter Market Outlook
The NDIR CO2 transmitter market is poised for sustained growth, driven by technological innovation, increasing environmental awareness, and the expansion into new applications. Strategic partnerships and the development of integrated solutions will be crucial for market leadership. The focus on energy efficiency and data analytics will shape the future of the market.
Ndir Co2 Transmitter Segmentation
-
1. Application
- 1.1. Residential
- 1.2. Commercial
- 1.3. Industry
- 1.4. other
-
2. Type
- 2.1. Embedded Type
- 2.2. Non-embedded Type
Ndir Co2 Transmitter Segmentation By Geography
-
1. North America
- 1.1. United States
- 1.2. Canada
- 1.3. Mexico
-
2. South America
- 2.1. Brazil
- 2.2. Argentina
- 2.3. Rest of South America
-
3. Europe
- 3.1. United Kingdom
- 3.2. Germany
- 3.3. France
- 3.4. Italy
- 3.5. Spain
- 3.6. Russia
- 3.7. Benelux
- 3.8. Nordics
- 3.9. Rest of Europe
-
4. Middle East & Africa
- 4.1. Turkey
- 4.2. Israel
- 4.3. GCC
- 4.4. North Africa
- 4.5. South Africa
- 4.6. Rest of Middle East & Africa
-
5. Asia Pacific
- 5.1. China
- 5.2. India
- 5.3. Japan
- 5.4. South Korea
- 5.5. ASEAN
- 5.6. Oceania
- 5.7. Rest of Asia Pacific

Ndir Co2 Transmitter REPORT HIGHLIGHTS
| Aspects | Details |
|---|---|
| Study Period | 2019-2033 |
| Base Year | 2024 |
| Estimated Year | 2025 |
| Forecast Period | 2025-2033 |
| Historical Period | 2019-2024 |
| Growth Rate | CAGR of 5% from 2019-2033 |
| Segmentation |
|
Table of Contents
- 1. Introduction
- 1.1. Research Scope
- 1.2. Market Segmentation
- 1.3. Research Methodology
- 1.4. Definitions and Assumptions
- 2. Executive Summary
- 2.1. Introduction
- 3. Market Dynamics
- 3.1. Introduction
- 3.2. Market Drivers
- 3.3. Market Restrains
- 3.4. Market Trends
- 4. Market Factor Analysis
- 4.1. Porters Five Forces
- 4.2. Supply/Value Chain
- 4.3. PESTEL analysis
- 4.4. Market Entropy
- 4.5. Patent/Trademark Analysis
- 5. Global Ndir Co2 Transmitter Analysis, Insights and Forecast, 2019-2031
- 5.1. Market Analysis, Insights and Forecast - by Application
- 5.1.1. Residential
- 5.1.2. Commercial
- 5.1.3. Industry
- 5.1.4. other
- 5.2. Market Analysis, Insights and Forecast - by Type
- 5.2.1. Embedded Type
- 5.2.2. Non-embedded Type
- 5.3. Market Analysis, Insights and Forecast - by Region
- 5.3.1. North America
- 5.3.2. South America
- 5.3.3. Europe
- 5.3.4. Middle East & Africa
- 5.3.5. Asia Pacific
- 5.1. Market Analysis, Insights and Forecast - by Application
- 6. North America Ndir Co2 Transmitter Analysis, Insights and Forecast, 2019-2031
- 6.1. Market Analysis, Insights and Forecast - by Application
- 6.1.1. Residential
- 6.1.2. Commercial
- 6.1.3. Industry
- 6.1.4. other
- 6.2. Market Analysis, Insights and Forecast - by Type
- 6.2.1. Embedded Type
- 6.2.2. Non-embedded Type
- 6.1. Market Analysis, Insights and Forecast - by Application
- 7. South America Ndir Co2 Transmitter Analysis, Insights and Forecast, 2019-2031
- 7.1. Market Analysis, Insights and Forecast - by Application
- 7.1.1. Residential
- 7.1.2. Commercial
- 7.1.3. Industry
- 7.1.4. other
- 7.2. Market Analysis, Insights and Forecast - by Type
- 7.2.1. Embedded Type
- 7.2.2. Non-embedded Type
- 7.1. Market Analysis, Insights and Forecast - by Application
- 8. Europe Ndir Co2 Transmitter Analysis, Insights and Forecast, 2019-2031
- 8.1. Market Analysis, Insights and Forecast - by Application
- 8.1.1. Residential
- 8.1.2. Commercial
- 8.1.3. Industry
- 8.1.4. other
- 8.2. Market Analysis, Insights and Forecast - by Type
- 8.2.1. Embedded Type
- 8.2.2. Non-embedded Type
- 8.1. Market Analysis, Insights and Forecast - by Application
- 9. Middle East & Africa Ndir Co2 Transmitter Analysis, Insights and Forecast, 2019-2031
- 9.1. Market Analysis, Insights and Forecast - by Application
- 9.1.1. Residential
- 9.1.2. Commercial
- 9.1.3. Industry
- 9.1.4. other
- 9.2. Market Analysis, Insights and Forecast - by Type
- 9.2.1. Embedded Type
- 9.2.2. Non-embedded Type
- 9.1. Market Analysis, Insights and Forecast - by Application
- 10. Asia Pacific Ndir Co2 Transmitter Analysis, Insights and Forecast, 2019-2031
- 10.1. Market Analysis, Insights and Forecast - by Application
- 10.1.1. Residential
- 10.1.2. Commercial
- 10.1.3. Industry
- 10.1.4. other
- 10.2. Market Analysis, Insights and Forecast - by Type
- 10.2.1. Embedded Type
- 10.2.2. Non-embedded Type
- 10.1. Market Analysis, Insights and Forecast - by Application
- 11. Competitive Analysis
- 11.1. Global Market Share Analysis 2024
- 11.2. Company Profiles
- 11.2.1 Siemens
- 11.2.1.1. Overview
- 11.2.1.2. Products
- 11.2.1.3. SWOT Analysis
- 11.2.1.4. Recent Developments
- 11.2.1.5. Financials (Based on Availability)
- 11.2.2 Vaisala Oyj
- 11.2.2.1. Overview
- 11.2.2.2. Products
- 11.2.2.3. SWOT Analysis
- 11.2.2.4. Recent Developments
- 11.2.2.5. Financials (Based on Availability)
- 11.2.3 Cubic Sensor and Instrument
- 11.2.3.1. Overview
- 11.2.3.2. Products
- 11.2.3.3. SWOT Analysis
- 11.2.3.4. Recent Developments
- 11.2.3.5. Financials (Based on Availability)
- 11.2.4 Micro-Hybrid Electronic GmbH
- 11.2.4.1. Overview
- 11.2.4.2. Products
- 11.2.4.3. SWOT Analysis
- 11.2.4.4. Recent Developments
- 11.2.4.5. Financials (Based on Availability)
- 11.2.5 Johnson Controls
- 11.2.5.1. Overview
- 11.2.5.2. Products
- 11.2.5.3. SWOT Analysis
- 11.2.5.4. Recent Developments
- 11.2.5.5. Financials (Based on Availability)
- 11.2.6 Schneider Electric
- 11.2.6.1. Overview
- 11.2.6.2. Products
- 11.2.6.3. SWOT Analysis
- 11.2.6.4. Recent Developments
- 11.2.6.5. Financials (Based on Availability)
- 11.2.7 Dwyer Instruments
- 11.2.7.1. Overview
- 11.2.7.2. Products
- 11.2.7.3. SWOT Analysis
- 11.2.7.4. Recent Developments
- 11.2.7.5. Financials (Based on Availability)
- 11.2.8 InHand Networks
- 11.2.8.1. Overview
- 11.2.8.2. Products
- 11.2.8.3. SWOT Analysis
- 11.2.8.4. Recent Developments
- 11.2.8.5. Financials (Based on Availability)
- 11.2.1 Siemens
List of Figures
- Figure 1: Global Ndir Co2 Transmitter Revenue Breakdown (million, %) by Region 2024 & 2032
- Figure 2: Global Ndir Co2 Transmitter Volume Breakdown (K, %) by Region 2024 & 2032
- Figure 3: North America Ndir Co2 Transmitter Revenue (million), by Application 2024 & 2032
- Figure 4: North America Ndir Co2 Transmitter Volume (K), by Application 2024 & 2032
- Figure 5: North America Ndir Co2 Transmitter Revenue Share (%), by Application 2024 & 2032
- Figure 6: North America Ndir Co2 Transmitter Volume Share (%), by Application 2024 & 2032
- Figure 7: North America Ndir Co2 Transmitter Revenue (million), by Type 2024 & 2032
- Figure 8: North America Ndir Co2 Transmitter Volume (K), by Type 2024 & 2032
- Figure 9: North America Ndir Co2 Transmitter Revenue Share (%), by Type 2024 & 2032
- Figure 10: North America Ndir Co2 Transmitter Volume Share (%), by Type 2024 & 2032
- Figure 11: North America Ndir Co2 Transmitter Revenue (million), by Country 2024 & 2032
- Figure 12: North America Ndir Co2 Transmitter Volume (K), by Country 2024 & 2032
- Figure 13: North America Ndir Co2 Transmitter Revenue Share (%), by Country 2024 & 2032
- Figure 14: North America Ndir Co2 Transmitter Volume Share (%), by Country 2024 & 2032
- Figure 15: South America Ndir Co2 Transmitter Revenue (million), by Application 2024 & 2032
- Figure 16: South America Ndir Co2 Transmitter Volume (K), by Application 2024 & 2032
- Figure 17: South America Ndir Co2 Transmitter Revenue Share (%), by Application 2024 & 2032
- Figure 18: South America Ndir Co2 Transmitter Volume Share (%), by Application 2024 & 2032
- Figure 19: South America Ndir Co2 Transmitter Revenue (million), by Type 2024 & 2032
- Figure 20: South America Ndir Co2 Transmitter Volume (K), by Type 2024 & 2032
- Figure 21: South America Ndir Co2 Transmitter Revenue Share (%), by Type 2024 & 2032
- Figure 22: South America Ndir Co2 Transmitter Volume Share (%), by Type 2024 & 2032
- Figure 23: South America Ndir Co2 Transmitter Revenue (million), by Country 2024 & 2032
- Figure 24: South America Ndir Co2 Transmitter Volume (K), by Country 2024 & 2032
- Figure 25: South America Ndir Co2 Transmitter Revenue Share (%), by Country 2024 & 2032
- Figure 26: South America Ndir Co2 Transmitter Volume Share (%), by Country 2024 & 2032
- Figure 27: Europe Ndir Co2 Transmitter Revenue (million), by Application 2024 & 2032
- Figure 28: Europe Ndir Co2 Transmitter Volume (K), by Application 2024 & 2032
- Figure 29: Europe Ndir Co2 Transmitter Revenue Share (%), by Application 2024 & 2032
- Figure 30: Europe Ndir Co2 Transmitter Volume Share (%), by Application 2024 & 2032
- Figure 31: Europe Ndir Co2 Transmitter Revenue (million), by Type 2024 & 2032
- Figure 32: Europe Ndir Co2 Transmitter Volume (K), by Type 2024 & 2032
- Figure 33: Europe Ndir Co2 Transmitter Revenue Share (%), by Type 2024 & 2032
- Figure 34: Europe Ndir Co2 Transmitter Volume Share (%), by Type 2024 & 2032
- Figure 35: Europe Ndir Co2 Transmitter Revenue (million), by Country 2024 & 2032
- Figure 36: Europe Ndir Co2 Transmitter Volume (K), by Country 2024 & 2032
- Figure 37: Europe Ndir Co2 Transmitter Revenue Share (%), by Country 2024 & 2032
- Figure 38: Europe Ndir Co2 Transmitter Volume Share (%), by Country 2024 & 2032
- Figure 39: Middle East & Africa Ndir Co2 Transmitter Revenue (million), by Application 2024 & 2032
- Figure 40: Middle East & Africa Ndir Co2 Transmitter Volume (K), by Application 2024 & 2032
- Figure 41: Middle East & Africa Ndir Co2 Transmitter Revenue Share (%), by Application 2024 & 2032
- Figure 42: Middle East & Africa Ndir Co2 Transmitter Volume Share (%), by Application 2024 & 2032
- Figure 43: Middle East & Africa Ndir Co2 Transmitter Revenue (million), by Type 2024 & 2032
- Figure 44: Middle East & Africa Ndir Co2 Transmitter Volume (K), by Type 2024 & 2032
- Figure 45: Middle East & Africa Ndir Co2 Transmitter Revenue Share (%), by Type 2024 & 2032
- Figure 46: Middle East & Africa Ndir Co2 Transmitter Volume Share (%), by Type 2024 & 2032
- Figure 47: Middle East & Africa Ndir Co2 Transmitter Revenue (million), by Country 2024 & 2032
- Figure 48: Middle East & Africa Ndir Co2 Transmitter Volume (K), by Country 2024 & 2032
- Figure 49: Middle East & Africa Ndir Co2 Transmitter Revenue Share (%), by Country 2024 & 2032
- Figure 50: Middle East & Africa Ndir Co2 Transmitter Volume Share (%), by Country 2024 & 2032
- Figure 51: Asia Pacific Ndir Co2 Transmitter Revenue (million), by Application 2024 & 2032
- Figure 52: Asia Pacific Ndir Co2 Transmitter Volume (K), by Application 2024 & 2032
- Figure 53: Asia Pacific Ndir Co2 Transmitter Revenue Share (%), by Application 2024 & 2032
- Figure 54: Asia Pacific Ndir Co2 Transmitter Volume Share (%), by Application 2024 & 2032
- Figure 55: Asia Pacific Ndir Co2 Transmitter Revenue (million), by Type 2024 & 2032
- Figure 56: Asia Pacific Ndir Co2 Transmitter Volume (K), by Type 2024 & 2032
- Figure 57: Asia Pacific Ndir Co2 Transmitter Revenue Share (%), by Type 2024 & 2032
- Figure 58: Asia Pacific Ndir Co2 Transmitter Volume Share (%), by Type 2024 & 2032
- Figure 59: Asia Pacific Ndir Co2 Transmitter Revenue (million), by Country 2024 & 2032
- Figure 60: Asia Pacific Ndir Co2 Transmitter Volume (K), by Country 2024 & 2032
- Figure 61: Asia Pacific Ndir Co2 Transmitter Revenue Share (%), by Country 2024 & 2032
- Figure 62: Asia Pacific Ndir Co2 Transmitter Volume Share (%), by Country 2024 & 2032
List of Tables
- Table 1: Global Ndir Co2 Transmitter Revenue million Forecast, by Region 2019 & 2032
- Table 2: Global Ndir Co2 Transmitter Volume K Forecast, by Region 2019 & 2032
- Table 3: Global Ndir Co2 Transmitter Revenue million Forecast, by Application 2019 & 2032
- Table 4: Global Ndir Co2 Transmitter Volume K Forecast, by Application 2019 & 2032
- Table 5: Global Ndir Co2 Transmitter Revenue million Forecast, by Type 2019 & 2032
- Table 6: Global Ndir Co2 Transmitter Volume K Forecast, by Type 2019 & 2032
- Table 7: Global Ndir Co2 Transmitter Revenue million Forecast, by Region 2019 & 2032
- Table 8: Global Ndir Co2 Transmitter Volume K Forecast, by Region 2019 & 2032
- Table 9: Global Ndir Co2 Transmitter Revenue million Forecast, by Application 2019 & 2032
- Table 10: Global Ndir Co2 Transmitter Volume K Forecast, by Application 2019 & 2032
- Table 11: Global Ndir Co2 Transmitter Revenue million Forecast, by Type 2019 & 2032
- Table 12: Global Ndir Co2 Transmitter Volume K Forecast, by Type 2019 & 2032
- Table 13: Global Ndir Co2 Transmitter Revenue million Forecast, by Country 2019 & 2032
- Table 14: Global Ndir Co2 Transmitter Volume K Forecast, by Country 2019 & 2032
- Table 15: United States Ndir Co2 Transmitter Revenue (million) Forecast, by Application 2019 & 2032
- Table 16: United States Ndir Co2 Transmitter Volume (K) Forecast, by Application 2019 & 2032
- Table 17: Canada Ndir Co2 Transmitter Revenue (million) Forecast, by Application 2019 & 2032
- Table 18: Canada Ndir Co2 Transmitter Volume (K) Forecast, by Application 2019 & 2032
- Table 19: Mexico Ndir Co2 Transmitter Revenue (million) Forecast, by Application 2019 & 2032
- Table 20: Mexico Ndir Co2 Transmitter Volume (K) Forecast, by Application 2019 & 2032
- Table 21: Global Ndir Co2 Transmitter Revenue million Forecast, by Application 2019 & 2032
- Table 22: Global Ndir Co2 Transmitter Volume K Forecast, by Application 2019 & 2032
- Table 23: Global Ndir Co2 Transmitter Revenue million Forecast, by Type 2019 & 2032
- Table 24: Global Ndir Co2 Transmitter Volume K Forecast, by Type 2019 & 2032
- Table 25: Global Ndir Co2 Transmitter Revenue million Forecast, by Country 2019 & 2032
- Table 26: Global Ndir Co2 Transmitter Volume K Forecast, by Country 2019 & 2032
- Table 27: Brazil Ndir Co2 Transmitter Revenue (million) Forecast, by Application 2019 & 2032
- Table 28: Brazil Ndir Co2 Transmitter Volume (K) Forecast, by Application 2019 & 2032
- Table 29: Argentina Ndir Co2 Transmitter Revenue (million) Forecast, by Application 2019 & 2032
- Table 30: Argentina Ndir Co2 Transmitter Volume (K) Forecast, by Application 2019 & 2032
- Table 31: Rest of South America Ndir Co2 Transmitter Revenue (million) Forecast, by Application 2019 & 2032
- Table 32: Rest of South America Ndir Co2 Transmitter Volume (K) Forecast, by Application 2019 & 2032
- Table 33: Global Ndir Co2 Transmitter Revenue million Forecast, by Application 2019 & 2032
- Table 34: Global Ndir Co2 Transmitter Volume K Forecast, by Application 2019 & 2032
- Table 35: Global Ndir Co2 Transmitter Revenue million Forecast, by Type 2019 & 2032
- Table 36: Global Ndir Co2 Transmitter Volume K Forecast, by Type 2019 & 2032
- Table 37: Global Ndir Co2 Transmitter Revenue million Forecast, by Country 2019 & 2032
- Table 38: Global Ndir Co2 Transmitter Volume K Forecast, by Country 2019 & 2032
- Table 39: United Kingdom Ndir Co2 Transmitter Revenue (million) Forecast, by Application 2019 & 2032
- Table 40: United Kingdom Ndir Co2 Transmitter Volume (K) Forecast, by Application 2019 & 2032
- Table 41: Germany Ndir Co2 Transmitter Revenue (million) Forecast, by Application 2019 & 2032
- Table 42: Germany Ndir Co2 Transmitter Volume (K) Forecast, by Application 2019 & 2032
- Table 43: France Ndir Co2 Transmitter Revenue (million) Forecast, by Application 2019 & 2032
- Table 44: France Ndir Co2 Transmitter Volume (K) Forecast, by Application 2019 & 2032
- Table 45: Italy Ndir Co2 Transmitter Revenue (million) Forecast, by Application 2019 & 2032
- Table 46: Italy Ndir Co2 Transmitter Volume (K) Forecast, by Application 2019 & 2032
- Table 47: Spain Ndir Co2 Transmitter Revenue (million) Forecast, by Application 2019 & 2032
- Table 48: Spain Ndir Co2 Transmitter Volume (K) Forecast, by Application 2019 & 2032
- Table 49: Russia Ndir Co2 Transmitter Revenue (million) Forecast, by Application 2019 & 2032
- Table 50: Russia Ndir Co2 Transmitter Volume (K) Forecast, by Application 2019 & 2032
- Table 51: Benelux Ndir Co2 Transmitter Revenue (million) Forecast, by Application 2019 & 2032
- Table 52: Benelux Ndir Co2 Transmitter Volume (K) Forecast, by Application 2019 & 2032
- Table 53: Nordics Ndir Co2 Transmitter Revenue (million) Forecast, by Application 2019 & 2032
- Table 54: Nordics Ndir Co2 Transmitter Volume (K) Forecast, by Application 2019 & 2032
- Table 55: Rest of Europe Ndir Co2 Transmitter Revenue (million) Forecast, by Application 2019 & 2032
- Table 56: Rest of Europe Ndir Co2 Transmitter Volume (K) Forecast, by Application 2019 & 2032
- Table 57: Global Ndir Co2 Transmitter Revenue million Forecast, by Application 2019 & 2032
- Table 58: Global Ndir Co2 Transmitter Volume K Forecast, by Application 2019 & 2032
- Table 59: Global Ndir Co2 Transmitter Revenue million Forecast, by Type 2019 & 2032
- Table 60: Global Ndir Co2 Transmitter Volume K Forecast, by Type 2019 & 2032
- Table 61: Global Ndir Co2 Transmitter Revenue million Forecast, by Country 2019 & 2032
- Table 62: Global Ndir Co2 Transmitter Volume K Forecast, by Country 2019 & 2032
- Table 63: Turkey Ndir Co2 Transmitter Revenue (million) Forecast, by Application 2019 & 2032
- Table 64: Turkey Ndir Co2 Transmitter Volume (K) Forecast, by Application 2019 & 2032
- Table 65: Israel Ndir Co2 Transmitter Revenue (million) Forecast, by Application 2019 & 2032
- Table 66: Israel Ndir Co2 Transmitter Volume (K) Forecast, by Application 2019 & 2032
- Table 67: GCC Ndir Co2 Transmitter Revenue (million) Forecast, by Application 2019 & 2032
- Table 68: GCC Ndir Co2 Transmitter Volume (K) Forecast, by Application 2019 & 2032
- Table 69: North Africa Ndir Co2 Transmitter Revenue (million) Forecast, by Application 2019 & 2032
- Table 70: North Africa Ndir Co2 Transmitter Volume (K) Forecast, by Application 2019 & 2032
- Table 71: South Africa Ndir Co2 Transmitter Revenue (million) Forecast, by Application 2019 & 2032
- Table 72: South Africa Ndir Co2 Transmitter Volume (K) Forecast, by Application 2019 & 2032
- Table 73: Rest of Middle East & Africa Ndir Co2 Transmitter Revenue (million) Forecast, by Application 2019 & 2032
- Table 74: Rest of Middle East & Africa Ndir Co2 Transmitter Volume (K) Forecast, by Application 2019 & 2032
- Table 75: Global Ndir Co2 Transmitter Revenue million Forecast, by Application 2019 & 2032
- Table 76: Global Ndir Co2 Transmitter Volume K Forecast, by Application 2019 & 2032
- Table 77: Global Ndir Co2 Transmitter Revenue million Forecast, by Type 2019 & 2032
- Table 78: Global Ndir Co2 Transmitter Volume K Forecast, by Type 2019 & 2032
- Table 79: Global Ndir Co2 Transmitter Revenue million Forecast, by Country 2019 & 2032
- Table 80: Global Ndir Co2 Transmitter Volume K Forecast, by Country 2019 & 2032
- Table 81: China Ndir Co2 Transmitter Revenue (million) Forecast, by Application 2019 & 2032
- Table 82: China Ndir Co2 Transmitter Volume (K) Forecast, by Application 2019 & 2032
- Table 83: India Ndir Co2 Transmitter Revenue (million) Forecast, by Application 2019 & 2032
- Table 84: India Ndir Co2 Transmitter Volume (K) Forecast, by Application 2019 & 2032
- Table 85: Japan Ndir Co2 Transmitter Revenue (million) Forecast, by Application 2019 & 2032
- Table 86: Japan Ndir Co2 Transmitter Volume (K) Forecast, by Application 2019 & 2032
- Table 87: South Korea Ndir Co2 Transmitter Revenue (million) Forecast, by Application 2019 & 2032
- Table 88: South Korea Ndir Co2 Transmitter Volume (K) Forecast, by Application 2019 & 2032
- Table 89: ASEAN Ndir Co2 Transmitter Revenue (million) Forecast, by Application 2019 & 2032
- Table 90: ASEAN Ndir Co2 Transmitter Volume (K) Forecast, by Application 2019 & 2032
- Table 91: Oceania Ndir Co2 Transmitter Revenue (million) Forecast, by Application 2019 & 2032
- Table 92: Oceania Ndir Co2 Transmitter Volume (K) Forecast, by Application 2019 & 2032
- Table 93: Rest of Asia Pacific Ndir Co2 Transmitter Revenue (million) Forecast, by Application 2019 & 2032
- Table 94: Rest of Asia Pacific Ndir Co2 Transmitter Volume (K) Forecast, by Application 2019 & 2032
Frequently Asked Questions
1. What is the projected Compound Annual Growth Rate (CAGR) of the Ndir Co2 Transmitter?
The projected CAGR is approximately 5%.
2. Which companies are prominent players in the Ndir Co2 Transmitter?
Key companies in the market include Siemens, Vaisala Oyj, Cubic Sensor and Instrument, Micro-Hybrid Electronic GmbH, Johnson Controls, Schneider Electric, Dwyer Instruments, InHand Networks.
3. What are the main segments of the Ndir Co2 Transmitter?
The market segments include Application, Type.
4. Can you provide details about the market size?
The market size is estimated to be USD 283 million as of 2022.
5. What are some drivers contributing to market growth?
N/A
6. What are the notable trends driving market growth?
N/A
7. Are there any restraints impacting market growth?
N/A
8. Can you provide examples of recent developments in the market?
N/A
9. What pricing options are available for accessing the report?
Pricing options include single-user, multi-user, and enterprise licenses priced at USD 3950.00, USD 5925.00, and USD 7900.00 respectively.
10. Is the market size provided in terms of value or volume?
The market size is provided in terms of value, measured in million and volume, measured in K.
11. Are there any specific market keywords associated with the report?
Yes, the market keyword associated with the report is "Ndir Co2 Transmitter," which aids in identifying and referencing the specific market segment covered.
12. How do I determine which pricing option suits my needs best?
The pricing options vary based on user requirements and access needs. Individual users may opt for single-user licenses, while businesses requiring broader access may choose multi-user or enterprise licenses for cost-effective access to the report.
13. Are there any additional resources or data provided in the Ndir Co2 Transmitter report?
While the report offers comprehensive insights, it's advisable to review the specific contents or supplementary materials provided to ascertain if additional resources or data are available.
14. How can I stay updated on further developments or reports in the Ndir Co2 Transmitter?
To stay informed about further developments, trends, and reports in the Ndir Co2 Transmitter, consider subscribing to industry newsletters, following relevant companies and organizations, or regularly checking reputable industry news sources and publications.
Methodology
Step 1 - Identification of Relevant Samples Size from Population Database


Step 2 - Approaches for Defining Global Market Size (Value, Volume* & Price*)

Note*: In applicable scenarios
Step 3 - Data Sources
Primary Research
- Web Analytics
- Survey Reports
- Research Institute
- Latest Research Reports
- Opinion Leaders
Secondary Research
- Annual Reports
- White Paper
- Latest Press Release
- Industry Association
- Paid Database
- Investor Presentations

Step 4 - Data Triangulation
Involves using different sources of information in order to increase the validity of a study
These sources are likely to be stakeholders in a program - participants, other researchers, program staff, other community members, and so on.
Then we put all data in single framework & apply various statistical tools to find out the dynamic on the market.
During the analysis stage, feedback from the stakeholder groups would be compared to determine areas of agreement as well as areas of divergence
