

Key Insights
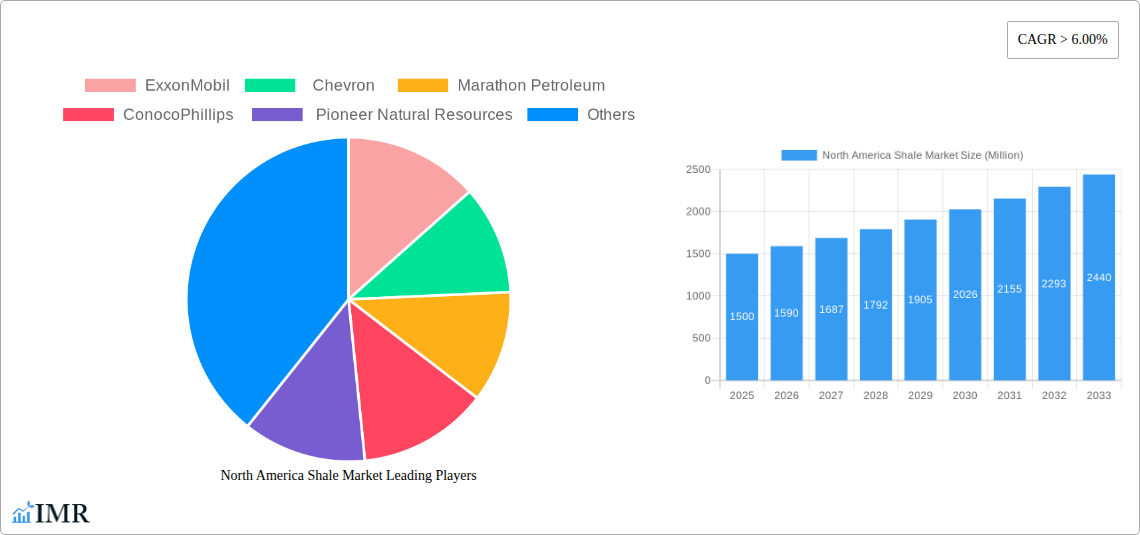
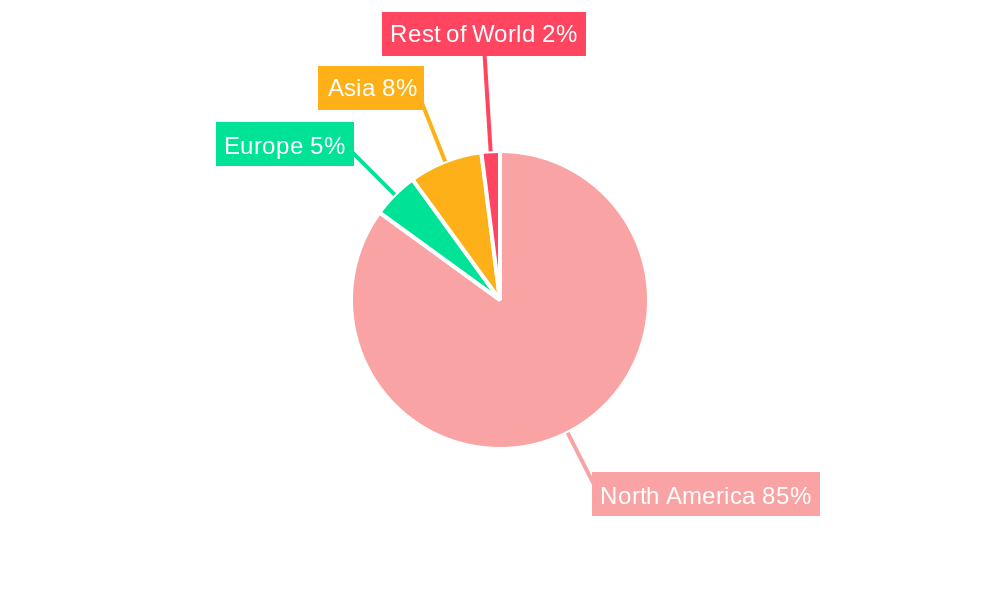
The North American shale market, encompassing oil and gas extraction from shale formations, is experiencing robust growth, projected to maintain a Compound Annual Growth Rate (CAGR) exceeding 6% from 2025 to 2033. This expansion is driven primarily by increasing energy demand, particularly in the United States and Canada, coupled with technological advancements in horizontal drilling and hydraulic fracturing, making shale extraction increasingly efficient and cost-effective. The dominance of major players like ExxonMobil, Chevron, Marathon Petroleum, ConocoPhillips, and Pioneer Natural Resources underscores the industry's consolidation and the significant capital investment required for successful shale operations. Furthermore, government policies promoting energy independence and diversification are contributing to market growth. However, environmental concerns surrounding methane emissions and water usage remain significant restraints, leading to increased regulatory scrutiny and potentially impacting future growth. The market is segmented by energy source, including solar, wind, hydro, and other renewables, with shale oil and gas currently holding the largest market share due to established infrastructure and relatively high profitability compared to other renewable sources. The United States constitutes the largest regional market within North America, followed by Canada and Mexico, reflecting the abundance of shale resources and established energy infrastructure in these regions. The forecast period (2025-2033) anticipates continued expansion, driven by sustained energy demand and technological improvements, although regulatory and environmental considerations are expected to shape the trajectory of this growth.
The historical period (2019-2024) reveals considerable volatility influenced by global energy price fluctuations and pandemic-related disruptions. However, the market demonstrated resilience, recovering from initial setbacks and exhibiting a strong upward trend. The base year of 2025 offers a solid foundation for future projections, considering prevailing market conditions and the established trajectory of technological advancements. The “Other Types” segment within the market, representing a variety of smaller shale operations and emerging technologies, is anticipated to show slower growth compared to dominant shale oil and gas, but still contributes to the overall market expansion. Ongoing technological innovation in exploration, extraction, and processing holds the potential to further improve efficiency and reduce environmental impact, mitigating some of the existing restraints and bolstering future growth projections. The long-term outlook for the North American shale market remains positive, though subject to ongoing economic and regulatory influences.
North America Shale Market: A Comprehensive Report (2019-2033)
This comprehensive report provides an in-depth analysis of the North America Shale Market, covering the period from 2019 to 2033. It delves into market dynamics, growth trends, dominant segments, and key players, offering valuable insights for industry professionals, investors, and strategic decision-makers. The report leverages extensive data analysis and expert insights to forecast market evolution and identify lucrative opportunities within this dynamic sector. This detailed study covers the parent market of Energy and the child market of Shale Gas/Oil. Market values are presented in million units.
North America Shale Market Market Dynamics & Structure
This section analyzes the intricate structure of the North America Shale Market, dissecting its concentration, technological advancements, regulatory influences, competitive landscape, and end-user demographics. We examine mergers and acquisitions (M&A) trends, providing quantitative data alongside qualitative assessments. The market exhibited a moderately concentrated structure in 2024, with the top five players holding an estimated 45% market share.
- Market Concentration: High, with the top five players (ExxonMobil, Chevron, Marathon Petroleum, ConocoPhillips, Pioneer Natural Resources) holding approximately 45% market share in 2024.
- Technological Innovation: Continuous advancements in hydraulic fracturing and horizontal drilling techniques are driving efficiency gains and unlocking previously inaccessible reserves. However, innovation is hampered by high upfront capital expenditures.
- Regulatory Framework: Varying regulations across different states and provinces impact exploration and production activities, creating both opportunities and challenges for operators. Permitting processes and environmental regulations significantly influence operational costs and timelines.
- Competitive Product Substitutes: Renewables like solar, wind, and hydro pose growing competition, driven by government incentives and decreasing costs. However, shale gas and oil retain a significant advantage in terms of energy density and reliability. xx Million units were consumed by renewable energy substitutes in 2024.
- End-User Demographics: The primary end-users are power generation companies, industrial facilities, and residential consumers, with fluctuating demands based on economic conditions and energy prices.
- M&A Trends: The number of M&A deals in the shale sector fluctuated between 2019 and 2024, averaging xx deals per year. Consolidation is a prominent trend, driven by the pursuit of economies of scale and access to larger reserves.
North America Shale Market Growth Trends & Insights
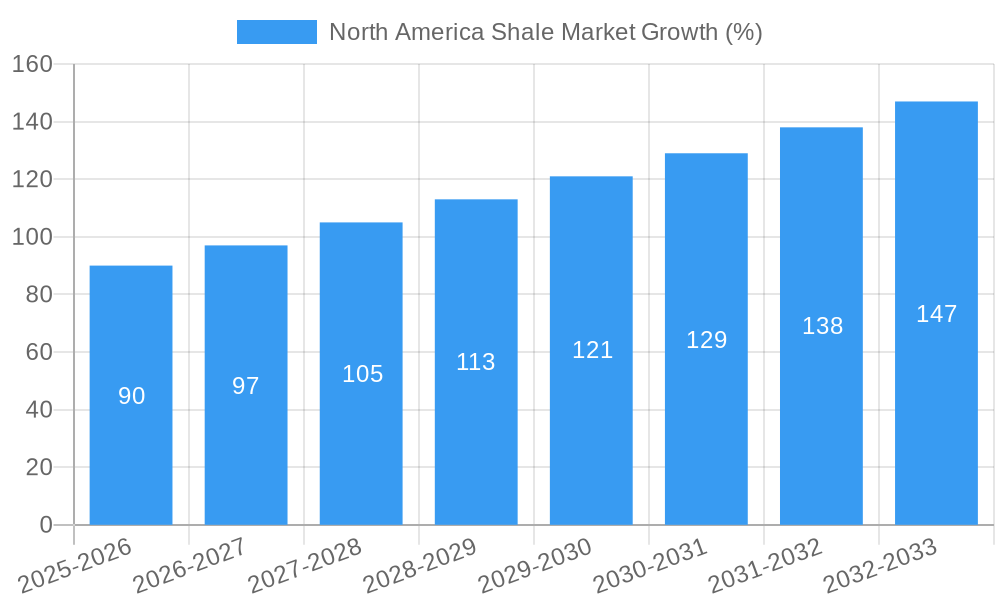
This section provides a comprehensive analysis of the North America Shale Market's growth trajectory, utilizing extensive data and industry expertise. We detail market size evolution, adoption rates, technological disruptions, and shifts in consumer behavior. The market experienced a CAGR of xx% during the historical period (2019-2024), driven by increased demand and technological advancements. The forecast period (2025-2033) projects a more moderate CAGR of xx%, reflecting the increasing influence of renewable energy sources and potential regulatory changes. Market penetration is expected to reach xx% by 2033. The analysis incorporates factors influencing production levels, price volatility, and the integration of renewables into the energy mix. Specific trends in consumer preferences regarding sustainable energy sources are carefully considered.
Dominant Regions, Countries, or Segments in North America Shale Market
The Permian Basin in Texas and New Mexico remains the dominant region, accounting for approximately xx% of total shale production in 2024. This dominance is fueled by prolific reserves, established infrastructure, and favorable regulatory environments.
- Key Drivers:
- Abundant shale reserves
- Well-developed infrastructure
- Favorable regulatory environment
- Supportive government policies
- Access to skilled workforce.
- Other Significant Regions: The Bakken Shale (North Dakota and Montana), Eagle Ford Shale (Texas), Marcellus Shale (Pennsylvania, West Virginia, and New York), and Utica Shale (Ohio, Pennsylvania, and West Virginia) also contribute significantly to the overall market.
The "Other Types" segment within the "By Type" classification, encompassing various unconventional sources, is expected to experience significant growth due to technological advancements and exploration of new resources.
North America Shale Market Product Landscape
The North America Shale market is characterized by continuous innovation in drilling technologies, including horizontal drilling and hydraulic fracturing, enhancing extraction efficiency and lowering costs. Furthermore, advancements in data analytics and reservoir modeling are improving exploration and production optimization. These technologies, along with the development of new materials for drilling equipment, are leading to improved performance metrics, such as increased well productivity and reduced environmental impact. Unique selling propositions revolve around the enhanced efficiency and lower overall lifecycle costs achievable through these advancements.
Key Drivers, Barriers & Challenges in North America Shale Market
Key Drivers: Technological advancements in drilling and extraction, favorable government policies (initially), and increasing global demand for energy are major drivers. The ongoing exploration of new shale reserves and the development of more efficient extraction techniques continually propel market expansion.
Key Challenges: Fluctuating oil and gas prices, stringent environmental regulations, and opposition from environmental groups create significant uncertainty and barriers to entry. Water usage concerns and the potential for induced seismicity pose operational challenges and regulatory risks. Supply chain disruptions, particularly related to equipment and specialized services, occasionally impact project timelines and costs. These challenges can result in a xx% reduction in production during peak disruption periods.
Emerging Opportunities in North America Shale Market
Emerging opportunities lie in the development of innovative extraction technologies, the exploration of unconventional shale resources, and the integration of renewable energy technologies to mitigate environmental concerns. The development of carbon capture, utilization, and storage (CCUS) technologies represents a significant opportunity to enhance the sustainability of shale gas production and address climate change concerns. Furthermore, the focus on reducing water usage in extraction processes through enhanced recycling and reuse offers new avenues for growth and reduced environmental impact.
Growth Accelerators in the North America Shale Market Industry
Long-term growth is accelerated by ongoing technological breakthroughs, strategic partnerships between energy companies and technology providers, and the expansion of shale gas infrastructure to facilitate efficient transportation and distribution. Government policies supporting domestic energy production and investments in research and development play a crucial role in sustaining the sector's growth. Furthermore, the increasing demand for natural gas for power generation, particularly as a transition fuel towards renewable sources, provides strong support for the shale gas market.
Key Players Shaping the North America Shale Market Market
Notable Milestones in North America Shale Market Sector
- 2020: Significant decline in oil prices due to the COVID-19 pandemic, impacting investment and production levels.
- 2022: Increased focus on environmental, social, and governance (ESG) factors by investors, influencing operational practices and investment decisions.
- 2023: Several major mergers and acquisitions reshaped the market landscape, creating larger, more integrated energy companies.
- 2024: Introduction of new technologies enhancing drilling efficiency and reducing water usage.
In-Depth North America Shale Market Market Outlook
The North America Shale Market is poised for continued growth, albeit at a more moderate pace than in previous years. Technological innovation, strategic partnerships, and expanding infrastructure will support sustained production. However, the market's future trajectory will be significantly influenced by the interplay between global energy demand, environmental regulations, and the ongoing transition to renewable energy sources. Strategic opportunities lie in optimizing operations for efficiency, investing in carbon reduction technologies, and exploring new reserves while minimizing environmental impact. The successful navigation of regulatory challenges and market volatility will be critical to realizing the market's full potential.
North America Shale Market Segmentation
- 1. Production Analysis
- 2. Consumption Analysis
- 3. Import Market Analysis (Value & Volume)
- 4. Export Market Analysis (Value & Volume)
- 5. Price Trend Analysis
North America Shale Market Segmentation By Geography
- 1. United States
- 2. Canada
- 3. Rest of North America
North America Shale Market REPORT HIGHLIGHTS
| Aspects | Details |
|---|---|
| Study Period | 2019-2033 |
| Base Year | 2024 |
| Estimated Year | 2025 |
| Forecast Period | 2025-2033 |
| Historical Period | 2019-2024 |
| Growth Rate | CAGR of > 6.00% from 2019-2033 |
| Segmentation |
|
Table of Contents
- 1. Introduction
- 1.1. Research Scope
- 1.2. Market Segmentation
- 1.3. Research Methodology
- 1.4. Definitions and Assumptions
- 2. Executive Summary
- 2.1. Introduction
- 3. Market Dynamics
- 3.1. Introduction
- 3.2. Market Drivers
- 3.2.1. 4.; Increasing Number of Offshore Operations 4.; Demand Coming for Unconventional Energy Sources
- 3.3. Market Restrains
- 3.3.1. 4.; Demand for Renewable Energy
- 3.4. Market Trends
- 3.4.1. Shale Gas to Dominate the Market
- 4. Market Factor Analysis
- 4.1. Porters Five Forces
- 4.2. Supply/Value Chain
- 4.3. PESTEL analysis
- 4.4. Market Entropy
- 4.5. Patent/Trademark Analysis
- 5. North America Shale Market Analysis, Insights and Forecast, 2019-2031
- 5.1. Market Analysis, Insights and Forecast - by Production Analysis
- 5.2. Market Analysis, Insights and Forecast - by Consumption Analysis
- 5.3. Market Analysis, Insights and Forecast - by Import Market Analysis (Value & Volume)
- 5.4. Market Analysis, Insights and Forecast - by Export Market Analysis (Value & Volume)
- 5.5. Market Analysis, Insights and Forecast - by Price Trend Analysis
- 5.6. Market Analysis, Insights and Forecast - by Region
- 5.6.1. United States
- 5.6.2. Canada
- 5.6.3. Rest of North America
- 5.1. Market Analysis, Insights and Forecast - by Production Analysis
- 6. United States North America Shale Market Analysis, Insights and Forecast, 2019-2031
- 6.1. Market Analysis, Insights and Forecast - by Production Analysis
- 6.2. Market Analysis, Insights and Forecast - by Consumption Analysis
- 6.3. Market Analysis, Insights and Forecast - by Import Market Analysis (Value & Volume)
- 6.4. Market Analysis, Insights and Forecast - by Export Market Analysis (Value & Volume)
- 6.5. Market Analysis, Insights and Forecast - by Price Trend Analysis
- 6.1. Market Analysis, Insights and Forecast - by Production Analysis
- 7. Canada North America Shale Market Analysis, Insights and Forecast, 2019-2031
- 7.1. Market Analysis, Insights and Forecast - by Production Analysis
- 7.2. Market Analysis, Insights and Forecast - by Consumption Analysis
- 7.3. Market Analysis, Insights and Forecast - by Import Market Analysis (Value & Volume)
- 7.4. Market Analysis, Insights and Forecast - by Export Market Analysis (Value & Volume)
- 7.5. Market Analysis, Insights and Forecast - by Price Trend Analysis
- 7.1. Market Analysis, Insights and Forecast - by Production Analysis
- 8. Rest of North America North America Shale Market Analysis, Insights and Forecast, 2019-2031
- 8.1. Market Analysis, Insights and Forecast - by Production Analysis
- 8.2. Market Analysis, Insights and Forecast - by Consumption Analysis
- 8.3. Market Analysis, Insights and Forecast - by Import Market Analysis (Value & Volume)
- 8.4. Market Analysis, Insights and Forecast - by Export Market Analysis (Value & Volume)
- 8.5. Market Analysis, Insights and Forecast - by Price Trend Analysis
- 8.1. Market Analysis, Insights and Forecast - by Production Analysis
- 9. United States North America Shale Market Analysis, Insights and Forecast, 2019-2031
- 10. Canada North America Shale Market Analysis, Insights and Forecast, 2019-2031
- 11. Mexico North America Shale Market Analysis, Insights and Forecast, 2019-2031
- 12. Rest of North America North America Shale Market Analysis, Insights and Forecast, 2019-2031
- 13. Competitive Analysis
- 13.1. Market Share Analysis 2024
- 13.2. Company Profiles
- 13.2.1 ExxonMobil
- 13.2.1.1. Overview
- 13.2.1.2. Products
- 13.2.1.3. SWOT Analysis
- 13.2.1.4. Recent Developments
- 13.2.1.5. Financials (Based on Availability)
- 13.2.2 Chevron
- 13.2.2.1. Overview
- 13.2.2.2. Products
- 13.2.2.3. SWOT Analysis
- 13.2.2.4. Recent Developments
- 13.2.2.5. Financials (Based on Availability)
- 13.2.3 Marathon Petroleum
- 13.2.3.1. Overview
- 13.2.3.2. Products
- 13.2.3.3. SWOT Analysis
- 13.2.3.4. Recent Developments
- 13.2.3.5. Financials (Based on Availability)
- 13.2.4 ConocoPhillips
- 13.2.4.1. Overview
- 13.2.4.2. Products
- 13.2.4.3. SWOT Analysis
- 13.2.4.4. Recent Developments
- 13.2.4.5. Financials (Based on Availability)
- 13.2.5 Pioneer Natural Resources
- 13.2.5.1. Overview
- 13.2.5.2. Products
- 13.2.5.3. SWOT Analysis
- 13.2.5.4. Recent Developments
- 13.2.5.5. Financials (Based on Availability)
- 13.2.1 ExxonMobil
List of Figures
- Figure 1: North America Shale Market Revenue Breakdown (Million, %) by Product 2024 & 2032
- Figure 2: North America Shale Market Share (%) by Company 2024
List of Tables
- Table 1: North America Shale Market Revenue Million Forecast, by Region 2019 & 2032
- Table 2: North America Shale Market Revenue Million Forecast, by Production Analysis 2019 & 2032
- Table 3: North America Shale Market Revenue Million Forecast, by Consumption Analysis 2019 & 2032
- Table 4: North America Shale Market Revenue Million Forecast, by Import Market Analysis (Value & Volume) 2019 & 2032
- Table 5: North America Shale Market Revenue Million Forecast, by Export Market Analysis (Value & Volume) 2019 & 2032
- Table 6: North America Shale Market Revenue Million Forecast, by Price Trend Analysis 2019 & 2032
- Table 7: North America Shale Market Revenue Million Forecast, by Region 2019 & 2032
- Table 8: North America Shale Market Revenue Million Forecast, by Country 2019 & 2032
- Table 9: United States North America Shale Market Revenue (Million) Forecast, by Application 2019 & 2032
- Table 10: Canada North America Shale Market Revenue (Million) Forecast, by Application 2019 & 2032
- Table 11: Mexico North America Shale Market Revenue (Million) Forecast, by Application 2019 & 2032
- Table 12: Rest of North America North America Shale Market Revenue (Million) Forecast, by Application 2019 & 2032
- Table 13: North America Shale Market Revenue Million Forecast, by Production Analysis 2019 & 2032
- Table 14: North America Shale Market Revenue Million Forecast, by Consumption Analysis 2019 & 2032
- Table 15: North America Shale Market Revenue Million Forecast, by Import Market Analysis (Value & Volume) 2019 & 2032
- Table 16: North America Shale Market Revenue Million Forecast, by Export Market Analysis (Value & Volume) 2019 & 2032
- Table 17: North America Shale Market Revenue Million Forecast, by Price Trend Analysis 2019 & 2032
- Table 18: North America Shale Market Revenue Million Forecast, by Country 2019 & 2032
- Table 19: North America Shale Market Revenue Million Forecast, by Production Analysis 2019 & 2032
- Table 20: North America Shale Market Revenue Million Forecast, by Consumption Analysis 2019 & 2032
- Table 21: North America Shale Market Revenue Million Forecast, by Import Market Analysis (Value & Volume) 2019 & 2032
- Table 22: North America Shale Market Revenue Million Forecast, by Export Market Analysis (Value & Volume) 2019 & 2032
- Table 23: North America Shale Market Revenue Million Forecast, by Price Trend Analysis 2019 & 2032
- Table 24: North America Shale Market Revenue Million Forecast, by Country 2019 & 2032
- Table 25: North America Shale Market Revenue Million Forecast, by Production Analysis 2019 & 2032
- Table 26: North America Shale Market Revenue Million Forecast, by Consumption Analysis 2019 & 2032
- Table 27: North America Shale Market Revenue Million Forecast, by Import Market Analysis (Value & Volume) 2019 & 2032
- Table 28: North America Shale Market Revenue Million Forecast, by Export Market Analysis (Value & Volume) 2019 & 2032
- Table 29: North America Shale Market Revenue Million Forecast, by Price Trend Analysis 2019 & 2032
- Table 30: North America Shale Market Revenue Million Forecast, by Country 2019 & 2032
Frequently Asked Questions
1. What is the projected Compound Annual Growth Rate (CAGR) of the North America Shale Market?
The projected CAGR is approximately > 6.00%.
2. Which companies are prominent players in the North America Shale Market?
Key companies in the market include ExxonMobil, Chevron , Marathon Petroleum , ConocoPhillips , Pioneer Natural Resources.
3. What are the main segments of the North America Shale Market?
The market segments include Production Analysis, Consumption Analysis, Import Market Analysis (Value & Volume), Export Market Analysis (Value & Volume), Price Trend Analysis.
4. Can you provide details about the market size?
The market size is estimated to be USD XX Million as of 2022.
5. What are some drivers contributing to market growth?
4.; Increasing Number of Offshore Operations 4.; Demand Coming for Unconventional Energy Sources.
6. What are the notable trends driving market growth?
Shale Gas to Dominate the Market.
7. Are there any restraints impacting market growth?
4.; Demand for Renewable Energy.
8. Can you provide examples of recent developments in the market?
N/A
9. What pricing options are available for accessing the report?
Pricing options include single-user, multi-user, and enterprise licenses priced at USD 4750, USD 5250, and USD 8750 respectively.
10. Is the market size provided in terms of value or volume?
The market size is provided in terms of value, measured in Million.
11. Are there any specific market keywords associated with the report?
Yes, the market keyword associated with the report is "North America Shale Market," which aids in identifying and referencing the specific market segment covered.
12. How do I determine which pricing option suits my needs best?
The pricing options vary based on user requirements and access needs. Individual users may opt for single-user licenses, while businesses requiring broader access may choose multi-user or enterprise licenses for cost-effective access to the report.
13. Are there any additional resources or data provided in the North America Shale Market report?
While the report offers comprehensive insights, it's advisable to review the specific contents or supplementary materials provided to ascertain if additional resources or data are available.
14. How can I stay updated on further developments or reports in the North America Shale Market?
To stay informed about further developments, trends, and reports in the North America Shale Market, consider subscribing to industry newsletters, following relevant companies and organizations, or regularly checking reputable industry news sources and publications.
Methodology
Step 1 - Identification of Relevant Samples Size from Population Database


Step 2 - Approaches for Defining Global Market Size (Value, Volume* & Price*)

Note*: In applicable scenarios
Step 3 - Data Sources
Primary Research
- Web Analytics
- Survey Reports
- Research Institute
- Latest Research Reports
- Opinion Leaders
Secondary Research
- Annual Reports
- White Paper
- Latest Press Release
- Industry Association
- Paid Database
- Investor Presentations

Step 4 - Data Triangulation
Involves using different sources of information in order to increase the validity of a study
These sources are likely to be stakeholders in a program - participants, other researchers, program staff, other community members, and so on.
Then we put all data in single framework & apply various statistical tools to find out the dynamic on the market.
During the analysis stage, feedback from the stakeholder groups would be compared to determine areas of agreement as well as areas of divergence
