

Key Insights
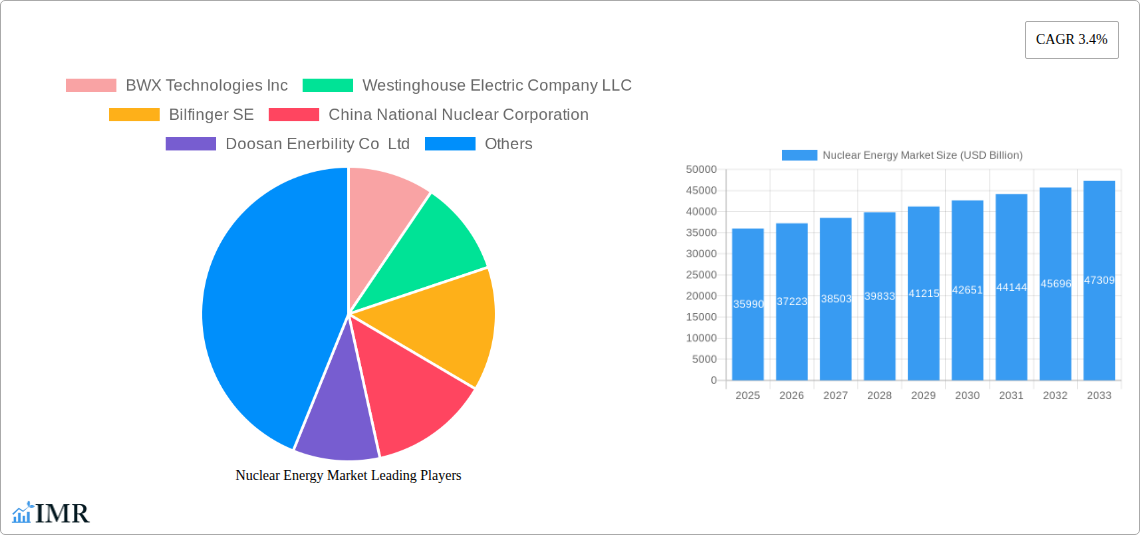
The global nuclear energy market, valued at $35.99 billion in 2025, is projected to experience steady growth, with a compound annual growth rate (CAGR) of 3.4% from 2025 to 2033. This growth is driven by several factors. Increasing concerns about climate change and the need for reliable, low-carbon energy sources are fueling significant investments in nuclear power plants. Furthermore, advancements in reactor technology, such as the development of smaller, modular reactors (SMRs), are making nuclear energy more economically viable and safer, thereby attracting both public and private investment. Government policies promoting nuclear energy, particularly in countries aiming for carbon neutrality, are also contributing to market expansion. However, challenges remain, including the high initial capital costs associated with building nuclear power plants and stringent safety regulations that can prolong the project timelines. Public perception and concerns about nuclear waste disposal continue to be significant restraints, although ongoing technological improvements and rigorous safety protocols are addressing these issues. The market is segmented by reactor type (Pressurized Water Reactor, Pressurized Heavy Water Reactor, Boiling Water Reactor, High-temperature Gas-cooled Reactor, Liquid-metal Fast-breeder Reactor, and Others) and application (Energy, Defense, and Other Applications). Key players, including BWX Technologies Inc, Westinghouse Electric Company LLC, and Rosatom, are actively involved in developing innovative technologies and expanding their global presence. Regional growth will vary, with regions like Asia-Pacific experiencing potentially higher growth rates due to increasing energy demands and government initiatives.
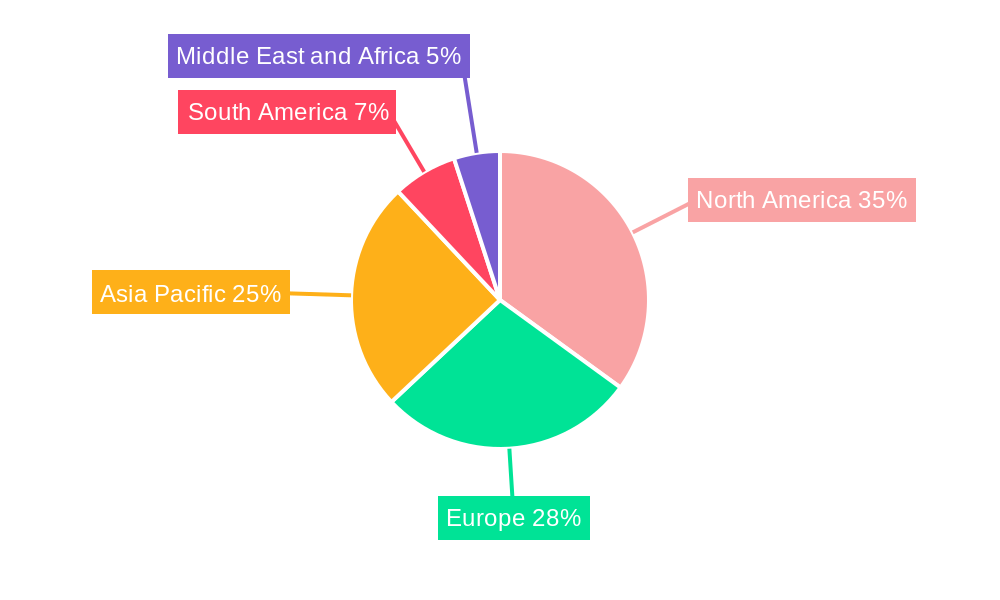
The North American market, particularly the United States, will remain a significant contributor due to existing infrastructure and ongoing investments in nuclear energy. European markets, while facing challenges from regulatory hurdles and public opinion, will see moderate growth driven by countries prioritizing energy independence and decarbonization efforts. The Asia-Pacific region is poised for substantial growth, fueled by countries like China and India's expanding energy needs and ambitious nuclear power expansion plans. While the Middle East and Africa regions will witness slower growth compared to other regions, individual countries with substantial energy demands and strategic nuclear power programs will likely drive localized market development. The overall market trajectory suggests a stable growth trajectory, although the rate of expansion will be influenced by factors such as technological advancements, regulatory changes, and public perception.
Nuclear Energy Market: Comprehensive Report 2019-2033
This in-depth report provides a comprehensive analysis of the global nuclear energy market, encompassing market dynamics, growth trends, regional analysis, product landscape, key players, and future outlook. The study period covers 2019-2033, with 2025 as the base year and a forecast period spanning 2025-2033. The report is invaluable for industry professionals, investors, and policymakers seeking a clear understanding of this evolving sector. The market is segmented by reactor type (Pressurized Water Reactor and Pressurized Heavy Water Reactor, Boiling Water Reactor, High-temperature Gas-cooled Reactor, Liquid-metal Fast-breeder Reactor, Other Reactor Types) and application (Energy, Defense, Other Applications). The total market value in 2025 is estimated at USD xx Billion.
Nuclear Energy Market Dynamics & Structure
The nuclear energy market exhibits a moderately concentrated structure, with a few major players holding significant market share. Technological innovation, driven by advancements in reactor design and fuel efficiency, plays a crucial role. Stringent regulatory frameworks and safety protocols significantly influence market dynamics. While renewable energy sources pose some competitive pressure, nuclear energy remains a vital source of baseload power, especially in countries with limited renewable resources. Mergers and acquisitions (M&A) activity is expected to remain moderate, with strategic alliances focused on technology sharing and market expansion.
- Market Concentration: High (top 10 players account for xx% of market share in 2025).
- Technological Innovation: Focus on advanced reactor designs (e.g., Small Modular Reactors (SMRs)), enhanced safety features, and improved waste management solutions.
- Regulatory Landscape: Stringent safety regulations and licensing processes vary across countries, impacting market entry and expansion.
- Competitive Substitutes: Renewable energy sources (solar, wind, hydro) and fossil fuels are key competitors.
- M&A Activity: Moderate level of M&A activity driven by strategic partnerships and technological collaborations. (Estimated xx billion USD in M&A deals between 2019-2024).
- End-User Demographics: Primarily government-owned utilities and private energy companies.
Nuclear Energy Market Growth Trends & Insights
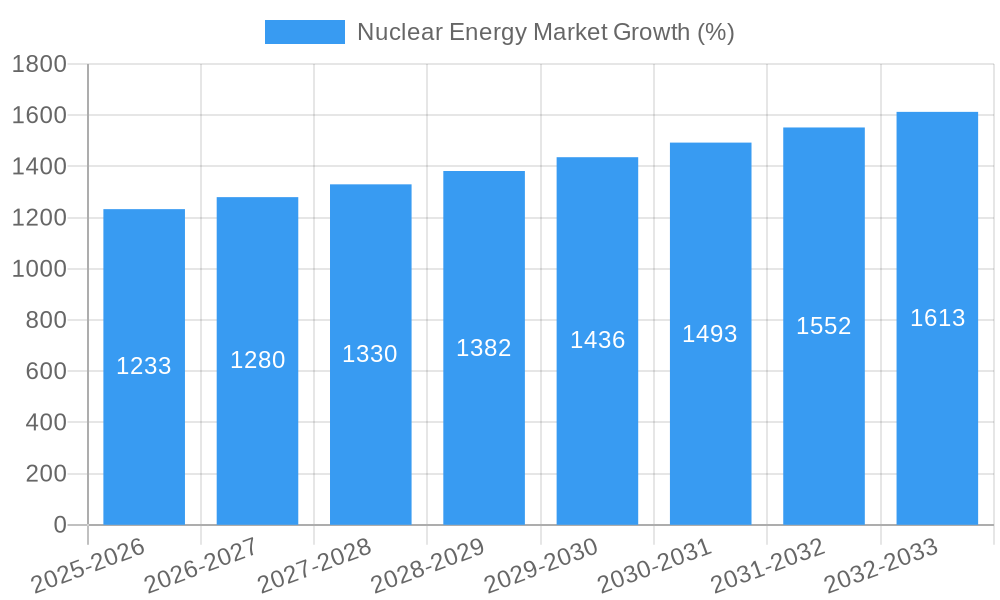
The nuclear energy market witnessed a relatively stable growth during the historical period (2019-2024). However, recent policy shifts and technological advancements are projected to drive accelerated growth in the forecast period (2025-2033). The market is expected to experience a Compound Annual Growth Rate (CAGR) of xx% during this period. Increased demand for baseload power, coupled with concerns about climate change and energy security, are significant drivers. Technological disruptions, such as the development of SMRs, promise greater efficiency and safety, further boosting market growth. The penetration rate of nuclear power in the global energy mix is expected to increase from xx% in 2025 to xx% by 2033. Consumer behavior is increasingly influenced by environmental consciousness, favoring carbon-neutral energy sources like nuclear power.
Dominant Regions, Countries, or Segments in Nuclear Energy Market
The North American and Asian markets are projected to be the dominant regions in the nuclear energy market throughout the forecast period. Within Asia, countries like China, India, and Japan are showing significant growth potential due to their expanding energy demand and ambitious nuclear power expansion programs. In North America, the US and Canada are key players with significant investments in new reactor projects. The Pressurized Water Reactor (PWR) segment currently holds the largest market share due to its established technology and reliability. However, the growth of other reactor types, particularly SMRs, is anticipated to increase considerably in the forecast period.
- Key Growth Drivers:
- Energy Security Concerns: Nations are diversifying their energy sources to reduce dependence on fossil fuels.
- Climate Change Mitigation: Nuclear energy offers a low-carbon alternative to fossil fuel-based power generation.
- Government Policies and Incentives: Supportive policies and subsidies drive investments in nuclear power projects.
- Infrastructure Development: Investments in grid infrastructure enhance the integration of nuclear power into national grids.
- Region/Country Dominance: North America (especially the US), followed by Asia (China, India, Japan).
- Segment Dominance: Pressurized Water Reactor (PWR) segment currently holds the largest market share.
Nuclear Energy Market Product Landscape
The nuclear energy market encompasses a range of reactor types and associated technologies. Advancements are focusing on improved safety features, enhanced efficiency, and reduced waste generation. The unique selling propositions of different reactors include higher power output, improved fuel utilization, and reduced environmental impact. Technological advancements include the development of SMRs, advanced fuel cycles, and improved waste management solutions.
Key Drivers, Barriers & Challenges in Nuclear Energy Market
Key Drivers:
- Rising global energy demand.
- Growing concerns about climate change and greenhouse gas emissions.
- Government policies supporting nuclear energy development.
- Technological advancements in reactor design and safety.
Key Challenges & Restraints:
- High capital costs associated with building nuclear power plants.
- Concerns about nuclear waste disposal and safety.
- Stringent regulations and licensing processes.
- Public perception and acceptance of nuclear energy. (estimated to decrease investment by xx% in some regions).
Emerging Opportunities in Nuclear Energy Market
- Growing demand for SMRs due to their smaller scale, modular design, and improved safety features.
- Potential for developing advanced fuel cycles to improve fuel utilization and reduce waste.
- Opportunities in developing countries with expanding energy needs and limited access to other power sources.
- Innovations in nuclear waste management technologies to reduce environmental impact.
Growth Accelerators in the Nuclear Energy Market Industry
Technological breakthroughs in reactor design, particularly SMRs, are key catalysts. Strategic partnerships between governments and private companies are accelerating the deployment of new nuclear facilities. Market expansion strategies in emerging economies with significant energy demands are driving long-term growth.
Key Players Shaping the Nuclear Energy Market Market
- BWX Technologies Inc
- Westinghouse Electric Company LLC
- Bilfinger SE
- China National Nuclear Corporation
- Doosan Enerbility Co Ltd
- SKODA JS AS
- Electricite de France SA (EDF)
- Rosatom State Atomic Energy Corporation
- Bechtel Group Inc
- KEPCO Engineering & Construction
- Japan Atomic Power Company
- Duke Energy Corporation
- Mitsubishi Heavy Industries Ltd
- GE-Hitachi Nuclear Energy Inc
Notable Milestones in Nuclear Energy Market Sector
- January 2024: The UK government announced plans for significant nuclear power expansion, including USD 382 million investment in advanced uranium fuel.
- February 2024: India announced plans to add 18 new nuclear reactors (13,800 MWe capacity) by 2031-2032.
- February 2024: Iran commenced construction of four new nuclear power plants (5,000 MW combined capacity) at a cost exceeding USD 20 billion.
In-Depth Nuclear Energy Market Market Outlook
The nuclear energy market is poised for significant growth in the coming years, driven by technological advancements, supportive government policies, and increasing concerns about energy security and climate change. Strategic opportunities exist in developing countries, and the emergence of SMRs promises to reduce capital costs and improve safety, driving wider adoption. The market's long-term potential is considerable, presenting attractive investment opportunities for stakeholders.
Nuclear Energy Market Segmentation
-
1. Application (Qualitative Analysis)
- 1.1. Energy
- 1.2. Defense
- 1.3. Other Applications
-
2. Reactor Type
- 2.1. Pressuri
- 2.2. Boiling Water Reactor
- 2.3. High-temperature Gas-cooled Reactor
- 2.4. Liquid-metal Fast-breeder Reactor
- 2.5. Other Reactor Types
Nuclear Energy Market Segmentation By Geography
-
1. North America
- 1.1. United States
- 1.2. Canada
- 1.3. Rest of North America
-
2. Europe
- 2.1. Germany
- 2.2. United Kingdom
- 2.3. Russia
- 2.4. France
- 2.5. Rest of Europe
-
3. Asia Pacific
- 3.1. China
- 3.2. India
- 3.3. Japan
- 3.4. South Korea
- 3.5. Rest of Asia Pacific
-
4. South America
- 4.1. Brazil
- 4.2. Argentina
- 4.3. Rest of South America
-
5. Middle East and Africa
- 5.1. United Arab Emirates
- 5.2. Saudi Arabia
- 5.3. South Africa
- 5.4. Iran
- 5.5. Rest of Middle East and Africa
Nuclear Energy Market REPORT HIGHLIGHTS
| Aspects | Details |
|---|---|
| Study Period | 2019-2033 |
| Base Year | 2024 |
| Estimated Year | 2025 |
| Forecast Period | 2025-2033 |
| Historical Period | 2019-2024 |
| Growth Rate | CAGR of 3.4% from 2019-2033 |
| Segmentation |
|
Table of Contents
- 1. Introduction
- 1.1. Research Scope
- 1.2. Market Segmentation
- 1.3. Research Methodology
- 1.4. Definitions and Assumptions
- 2. Executive Summary
- 2.1. Introduction
- 3. Market Dynamics
- 3.1. Introduction
- 3.2. Market Drivers
- 3.2.1. 4.; Increase in Demand for Clean Energy4.; Plant Lifetime Extensions With Favorable Policies
- 3.3. Market Restrains
- 3.3.1. 4.; Intense Competition From Renewable Energy Sources4.; Accidents and Uncertainty over the Cost Effectiveness
- 3.4. Market Trends
- 3.4.1. Energy Segment Expected to Dominate the Market
- 4. Market Factor Analysis
- 4.1. Porters Five Forces
- 4.2. Supply/Value Chain
- 4.3. PESTEL analysis
- 4.4. Market Entropy
- 4.5. Patent/Trademark Analysis
- 5. Global Nuclear Energy Market Analysis, Insights and Forecast, 2019-2031
- 5.1. Market Analysis, Insights and Forecast - by Application (Qualitative Analysis)
- 5.1.1. Energy
- 5.1.2. Defense
- 5.1.3. Other Applications
- 5.2. Market Analysis, Insights and Forecast - by Reactor Type
- 5.2.1. Pressuri
- 5.2.2. Boiling Water Reactor
- 5.2.3. High-temperature Gas-cooled Reactor
- 5.2.4. Liquid-metal Fast-breeder Reactor
- 5.2.5. Other Reactor Types
- 5.3. Market Analysis, Insights and Forecast - by Region
- 5.3.1. North America
- 5.3.2. Europe
- 5.3.3. Asia Pacific
- 5.3.4. South America
- 5.3.5. Middle East and Africa
- 5.1. Market Analysis, Insights and Forecast - by Application (Qualitative Analysis)
- 6. North America Nuclear Energy Market Analysis, Insights and Forecast, 2019-2031
- 6.1. Market Analysis, Insights and Forecast - by Application (Qualitative Analysis)
- 6.1.1. Energy
- 6.1.2. Defense
- 6.1.3. Other Applications
- 6.2. Market Analysis, Insights and Forecast - by Reactor Type
- 6.2.1. Pressuri
- 6.2.2. Boiling Water Reactor
- 6.2.3. High-temperature Gas-cooled Reactor
- 6.2.4. Liquid-metal Fast-breeder Reactor
- 6.2.5. Other Reactor Types
- 6.1. Market Analysis, Insights and Forecast - by Application (Qualitative Analysis)
- 7. Europe Nuclear Energy Market Analysis, Insights and Forecast, 2019-2031
- 7.1. Market Analysis, Insights and Forecast - by Application (Qualitative Analysis)
- 7.1.1. Energy
- 7.1.2. Defense
- 7.1.3. Other Applications
- 7.2. Market Analysis, Insights and Forecast - by Reactor Type
- 7.2.1. Pressuri
- 7.2.2. Boiling Water Reactor
- 7.2.3. High-temperature Gas-cooled Reactor
- 7.2.4. Liquid-metal Fast-breeder Reactor
- 7.2.5. Other Reactor Types
- 7.1. Market Analysis, Insights and Forecast - by Application (Qualitative Analysis)
- 8. Asia Pacific Nuclear Energy Market Analysis, Insights and Forecast, 2019-2031
- 8.1. Market Analysis, Insights and Forecast - by Application (Qualitative Analysis)
- 8.1.1. Energy
- 8.1.2. Defense
- 8.1.3. Other Applications
- 8.2. Market Analysis, Insights and Forecast - by Reactor Type
- 8.2.1. Pressuri
- 8.2.2. Boiling Water Reactor
- 8.2.3. High-temperature Gas-cooled Reactor
- 8.2.4. Liquid-metal Fast-breeder Reactor
- 8.2.5. Other Reactor Types
- 8.1. Market Analysis, Insights and Forecast - by Application (Qualitative Analysis)
- 9. South America Nuclear Energy Market Analysis, Insights and Forecast, 2019-2031
- 9.1. Market Analysis, Insights and Forecast - by Application (Qualitative Analysis)
- 9.1.1. Energy
- 9.1.2. Defense
- 9.1.3. Other Applications
- 9.2. Market Analysis, Insights and Forecast - by Reactor Type
- 9.2.1. Pressuri
- 9.2.2. Boiling Water Reactor
- 9.2.3. High-temperature Gas-cooled Reactor
- 9.2.4. Liquid-metal Fast-breeder Reactor
- 9.2.5. Other Reactor Types
- 9.1. Market Analysis, Insights and Forecast - by Application (Qualitative Analysis)
- 10. Middle East and Africa Nuclear Energy Market Analysis, Insights and Forecast, 2019-2031
- 10.1. Market Analysis, Insights and Forecast - by Application (Qualitative Analysis)
- 10.1.1. Energy
- 10.1.2. Defense
- 10.1.3. Other Applications
- 10.2. Market Analysis, Insights and Forecast - by Reactor Type
- 10.2.1. Pressuri
- 10.2.2. Boiling Water Reactor
- 10.2.3. High-temperature Gas-cooled Reactor
- 10.2.4. Liquid-metal Fast-breeder Reactor
- 10.2.5. Other Reactor Types
- 10.1. Market Analysis, Insights and Forecast - by Application (Qualitative Analysis)
- 11. North America Nuclear Energy Market Analysis, Insights and Forecast, 2019-2031
- 11.1. Market Analysis, Insights and Forecast - By Country/Sub-region
- 11.1.1 United States
- 11.1.2 Canada
- 11.1.3 Rest of North America
- 12. Europe Nuclear Energy Market Analysis, Insights and Forecast, 2019-2031
- 12.1. Market Analysis, Insights and Forecast - By Country/Sub-region
- 12.1.1 Germany
- 12.1.2 United Kingdom
- 12.1.3 Russia
- 12.1.4 France
- 12.1.5 Rest of Europe
- 13. Asia Pacific Nuclear Energy Market Analysis, Insights and Forecast, 2019-2031
- 13.1. Market Analysis, Insights and Forecast - By Country/Sub-region
- 13.1.1 China
- 13.1.2 India
- 13.1.3 Japan
- 13.1.4 South Korea
- 13.1.5 Rest of Asia Pacific
- 14. South America Nuclear Energy Market Analysis, Insights and Forecast, 2019-2031
- 14.1. Market Analysis, Insights and Forecast - By Country/Sub-region
- 14.1.1 Brazil
- 14.1.2 Argentina
- 14.1.3 Rest of South America
- 15. Middle East and Africa Nuclear Energy Market Analysis, Insights and Forecast, 2019-2031
- 15.1. Market Analysis, Insights and Forecast - By Country/Sub-region
- 15.1.1 United Arab Emirates
- 15.1.2 Saudi Arabia
- 15.1.3 South Africa
- 15.1.4 Iran
- 15.1.5 Rest of Middle East and Africa
- 16. Competitive Analysis
- 16.1. Global Market Share Analysis 2024
- 16.2. Company Profiles
- 16.2.1 BWX Technologies Inc
- 16.2.1.1. Overview
- 16.2.1.2. Products
- 16.2.1.3. SWOT Analysis
- 16.2.1.4. Recent Developments
- 16.2.1.5. Financials (Based on Availability)
- 16.2.2 Westinghouse Electric Company LLC
- 16.2.2.1. Overview
- 16.2.2.2. Products
- 16.2.2.3. SWOT Analysis
- 16.2.2.4. Recent Developments
- 16.2.2.5. Financials (Based on Availability)
- 16.2.3 Bilfinger SE
- 16.2.3.1. Overview
- 16.2.3.2. Products
- 16.2.3.3. SWOT Analysis
- 16.2.3.4. Recent Developments
- 16.2.3.5. Financials (Based on Availability)
- 16.2.4 China National Nuclear Corporation
- 16.2.4.1. Overview
- 16.2.4.2. Products
- 16.2.4.3. SWOT Analysis
- 16.2.4.4. Recent Developments
- 16.2.4.5. Financials (Based on Availability)
- 16.2.5 Doosan Enerbility Co Ltd
- 16.2.5.1. Overview
- 16.2.5.2. Products
- 16.2.5.3. SWOT Analysis
- 16.2.5.4. Recent Developments
- 16.2.5.5. Financials (Based on Availability)
- 16.2.6 SKODA JS AS
- 16.2.6.1. Overview
- 16.2.6.2. Products
- 16.2.6.3. SWOT Analysis
- 16.2.6.4. Recent Developments
- 16.2.6.5. Financials (Based on Availability)
- 16.2.7 Electricite de France SA (EDF)
- 16.2.7.1. Overview
- 16.2.7.2. Products
- 16.2.7.3. SWOT Analysis
- 16.2.7.4. Recent Developments
- 16.2.7.5. Financials (Based on Availability)
- 16.2.8 Rosatom State Atomic Energy Corporation
- 16.2.8.1. Overview
- 16.2.8.2. Products
- 16.2.8.3. SWOT Analysis
- 16.2.8.4. Recent Developments
- 16.2.8.5. Financials (Based on Availability)
- 16.2.9 Bechtel Group Inc
- 16.2.9.1. Overview
- 16.2.9.2. Products
- 16.2.9.3. SWOT Analysis
- 16.2.9.4. Recent Developments
- 16.2.9.5. Financials (Based on Availability)
- 16.2.10 KEPCO Engineering & Construction*List Not Exhaustive 6 4 Market Ranking/Share (%) Analysi
- 16.2.10.1. Overview
- 16.2.10.2. Products
- 16.2.10.3. SWOT Analysis
- 16.2.10.4. Recent Developments
- 16.2.10.5. Financials (Based on Availability)
- 16.2.11 Japan Atomic Power Company
- 16.2.11.1. Overview
- 16.2.11.2. Products
- 16.2.11.3. SWOT Analysis
- 16.2.11.4. Recent Developments
- 16.2.11.5. Financials (Based on Availability)
- 16.2.12 Duke Energy Corporation
- 16.2.12.1. Overview
- 16.2.12.2. Products
- 16.2.12.3. SWOT Analysis
- 16.2.12.4. Recent Developments
- 16.2.12.5. Financials (Based on Availability)
- 16.2.13 Mitsubishi Heavy Industries Ltd
- 16.2.13.1. Overview
- 16.2.13.2. Products
- 16.2.13.3. SWOT Analysis
- 16.2.13.4. Recent Developments
- 16.2.13.5. Financials (Based on Availability)
- 16.2.14 GE-Hitachi Nuclear Energy Inc
- 16.2.14.1. Overview
- 16.2.14.2. Products
- 16.2.14.3. SWOT Analysis
- 16.2.14.4. Recent Developments
- 16.2.14.5. Financials (Based on Availability)
- 16.2.1 BWX Technologies Inc
List of Figures
- Figure 1: Global Nuclear Energy Market Revenue Breakdown (USD Billion, %) by Region 2024 & 2032
- Figure 2: Global Nuclear Energy Market Volume Breakdown (gigawatt, %) by Region 2024 & 2032
- Figure 3: North America Nuclear Energy Market Revenue (USD Billion), by Country 2024 & 2032
- Figure 4: North America Nuclear Energy Market Volume (gigawatt), by Country 2024 & 2032
- Figure 5: North America Nuclear Energy Market Revenue Share (%), by Country 2024 & 2032
- Figure 6: North America Nuclear Energy Market Volume Share (%), by Country 2024 & 2032
- Figure 7: Europe Nuclear Energy Market Revenue (USD Billion), by Country 2024 & 2032
- Figure 8: Europe Nuclear Energy Market Volume (gigawatt), by Country 2024 & 2032
- Figure 9: Europe Nuclear Energy Market Revenue Share (%), by Country 2024 & 2032
- Figure 10: Europe Nuclear Energy Market Volume Share (%), by Country 2024 & 2032
- Figure 11: Asia Pacific Nuclear Energy Market Revenue (USD Billion), by Country 2024 & 2032
- Figure 12: Asia Pacific Nuclear Energy Market Volume (gigawatt), by Country 2024 & 2032
- Figure 13: Asia Pacific Nuclear Energy Market Revenue Share (%), by Country 2024 & 2032
- Figure 14: Asia Pacific Nuclear Energy Market Volume Share (%), by Country 2024 & 2032
- Figure 15: South America Nuclear Energy Market Revenue (USD Billion), by Country 2024 & 2032
- Figure 16: South America Nuclear Energy Market Volume (gigawatt), by Country 2024 & 2032
- Figure 17: South America Nuclear Energy Market Revenue Share (%), by Country 2024 & 2032
- Figure 18: South America Nuclear Energy Market Volume Share (%), by Country 2024 & 2032
- Figure 19: Middle East and Africa Nuclear Energy Market Revenue (USD Billion), by Country 2024 & 2032
- Figure 20: Middle East and Africa Nuclear Energy Market Volume (gigawatt), by Country 2024 & 2032
- Figure 21: Middle East and Africa Nuclear Energy Market Revenue Share (%), by Country 2024 & 2032
- Figure 22: Middle East and Africa Nuclear Energy Market Volume Share (%), by Country 2024 & 2032
- Figure 23: North America Nuclear Energy Market Revenue (USD Billion), by Application (Qualitative Analysis) 2024 & 2032
- Figure 24: North America Nuclear Energy Market Volume (gigawatt), by Application (Qualitative Analysis) 2024 & 2032
- Figure 25: North America Nuclear Energy Market Revenue Share (%), by Application (Qualitative Analysis) 2024 & 2032
- Figure 26: North America Nuclear Energy Market Volume Share (%), by Application (Qualitative Analysis) 2024 & 2032
- Figure 27: North America Nuclear Energy Market Revenue (USD Billion), by Reactor Type 2024 & 2032
- Figure 28: North America Nuclear Energy Market Volume (gigawatt), by Reactor Type 2024 & 2032
- Figure 29: North America Nuclear Energy Market Revenue Share (%), by Reactor Type 2024 & 2032
- Figure 30: North America Nuclear Energy Market Volume Share (%), by Reactor Type 2024 & 2032
- Figure 31: North America Nuclear Energy Market Revenue (USD Billion), by Country 2024 & 2032
- Figure 32: North America Nuclear Energy Market Volume (gigawatt), by Country 2024 & 2032
- Figure 33: North America Nuclear Energy Market Revenue Share (%), by Country 2024 & 2032
- Figure 34: North America Nuclear Energy Market Volume Share (%), by Country 2024 & 2032
- Figure 35: Europe Nuclear Energy Market Revenue (USD Billion), by Application (Qualitative Analysis) 2024 & 2032
- Figure 36: Europe Nuclear Energy Market Volume (gigawatt), by Application (Qualitative Analysis) 2024 & 2032
- Figure 37: Europe Nuclear Energy Market Revenue Share (%), by Application (Qualitative Analysis) 2024 & 2032
- Figure 38: Europe Nuclear Energy Market Volume Share (%), by Application (Qualitative Analysis) 2024 & 2032
- Figure 39: Europe Nuclear Energy Market Revenue (USD Billion), by Reactor Type 2024 & 2032
- Figure 40: Europe Nuclear Energy Market Volume (gigawatt), by Reactor Type 2024 & 2032
- Figure 41: Europe Nuclear Energy Market Revenue Share (%), by Reactor Type 2024 & 2032
- Figure 42: Europe Nuclear Energy Market Volume Share (%), by Reactor Type 2024 & 2032
- Figure 43: Europe Nuclear Energy Market Revenue (USD Billion), by Country 2024 & 2032
- Figure 44: Europe Nuclear Energy Market Volume (gigawatt), by Country 2024 & 2032
- Figure 45: Europe Nuclear Energy Market Revenue Share (%), by Country 2024 & 2032
- Figure 46: Europe Nuclear Energy Market Volume Share (%), by Country 2024 & 2032
- Figure 47: Asia Pacific Nuclear Energy Market Revenue (USD Billion), by Application (Qualitative Analysis) 2024 & 2032
- Figure 48: Asia Pacific Nuclear Energy Market Volume (gigawatt), by Application (Qualitative Analysis) 2024 & 2032
- Figure 49: Asia Pacific Nuclear Energy Market Revenue Share (%), by Application (Qualitative Analysis) 2024 & 2032
- Figure 50: Asia Pacific Nuclear Energy Market Volume Share (%), by Application (Qualitative Analysis) 2024 & 2032
- Figure 51: Asia Pacific Nuclear Energy Market Revenue (USD Billion), by Reactor Type 2024 & 2032
- Figure 52: Asia Pacific Nuclear Energy Market Volume (gigawatt), by Reactor Type 2024 & 2032
- Figure 53: Asia Pacific Nuclear Energy Market Revenue Share (%), by Reactor Type 2024 & 2032
- Figure 54: Asia Pacific Nuclear Energy Market Volume Share (%), by Reactor Type 2024 & 2032
- Figure 55: Asia Pacific Nuclear Energy Market Revenue (USD Billion), by Country 2024 & 2032
- Figure 56: Asia Pacific Nuclear Energy Market Volume (gigawatt), by Country 2024 & 2032
- Figure 57: Asia Pacific Nuclear Energy Market Revenue Share (%), by Country 2024 & 2032
- Figure 58: Asia Pacific Nuclear Energy Market Volume Share (%), by Country 2024 & 2032
- Figure 59: South America Nuclear Energy Market Revenue (USD Billion), by Application (Qualitative Analysis) 2024 & 2032
- Figure 60: South America Nuclear Energy Market Volume (gigawatt), by Application (Qualitative Analysis) 2024 & 2032
- Figure 61: South America Nuclear Energy Market Revenue Share (%), by Application (Qualitative Analysis) 2024 & 2032
- Figure 62: South America Nuclear Energy Market Volume Share (%), by Application (Qualitative Analysis) 2024 & 2032
- Figure 63: South America Nuclear Energy Market Revenue (USD Billion), by Reactor Type 2024 & 2032
- Figure 64: South America Nuclear Energy Market Volume (gigawatt), by Reactor Type 2024 & 2032
- Figure 65: South America Nuclear Energy Market Revenue Share (%), by Reactor Type 2024 & 2032
- Figure 66: South America Nuclear Energy Market Volume Share (%), by Reactor Type 2024 & 2032
- Figure 67: South America Nuclear Energy Market Revenue (USD Billion), by Country 2024 & 2032
- Figure 68: South America Nuclear Energy Market Volume (gigawatt), by Country 2024 & 2032
- Figure 69: South America Nuclear Energy Market Revenue Share (%), by Country 2024 & 2032
- Figure 70: South America Nuclear Energy Market Volume Share (%), by Country 2024 & 2032
- Figure 71: Middle East and Africa Nuclear Energy Market Revenue (USD Billion), by Application (Qualitative Analysis) 2024 & 2032
- Figure 72: Middle East and Africa Nuclear Energy Market Volume (gigawatt), by Application (Qualitative Analysis) 2024 & 2032
- Figure 73: Middle East and Africa Nuclear Energy Market Revenue Share (%), by Application (Qualitative Analysis) 2024 & 2032
- Figure 74: Middle East and Africa Nuclear Energy Market Volume Share (%), by Application (Qualitative Analysis) 2024 & 2032
- Figure 75: Middle East and Africa Nuclear Energy Market Revenue (USD Billion), by Reactor Type 2024 & 2032
- Figure 76: Middle East and Africa Nuclear Energy Market Volume (gigawatt), by Reactor Type 2024 & 2032
- Figure 77: Middle East and Africa Nuclear Energy Market Revenue Share (%), by Reactor Type 2024 & 2032
- Figure 78: Middle East and Africa Nuclear Energy Market Volume Share (%), by Reactor Type 2024 & 2032
- Figure 79: Middle East and Africa Nuclear Energy Market Revenue (USD Billion), by Country 2024 & 2032
- Figure 80: Middle East and Africa Nuclear Energy Market Volume (gigawatt), by Country 2024 & 2032
- Figure 81: Middle East and Africa Nuclear Energy Market Revenue Share (%), by Country 2024 & 2032
- Figure 82: Middle East and Africa Nuclear Energy Market Volume Share (%), by Country 2024 & 2032
List of Tables
- Table 1: Global Nuclear Energy Market Revenue USD Billion Forecast, by Region 2019 & 2032
- Table 2: Global Nuclear Energy Market Volume gigawatt Forecast, by Region 2019 & 2032
- Table 3: Global Nuclear Energy Market Revenue USD Billion Forecast, by Application (Qualitative Analysis) 2019 & 2032
- Table 4: Global Nuclear Energy Market Volume gigawatt Forecast, by Application (Qualitative Analysis) 2019 & 2032
- Table 5: Global Nuclear Energy Market Revenue USD Billion Forecast, by Reactor Type 2019 & 2032
- Table 6: Global Nuclear Energy Market Volume gigawatt Forecast, by Reactor Type 2019 & 2032
- Table 7: Global Nuclear Energy Market Revenue USD Billion Forecast, by Region 2019 & 2032
- Table 8: Global Nuclear Energy Market Volume gigawatt Forecast, by Region 2019 & 2032
- Table 9: Global Nuclear Energy Market Revenue USD Billion Forecast, by Country 2019 & 2032
- Table 10: Global Nuclear Energy Market Volume gigawatt Forecast, by Country 2019 & 2032
- Table 11: United States Nuclear Energy Market Revenue (USD Billion) Forecast, by Application 2019 & 2032
- Table 12: United States Nuclear Energy Market Volume (gigawatt) Forecast, by Application 2019 & 2032
- Table 13: Canada Nuclear Energy Market Revenue (USD Billion) Forecast, by Application 2019 & 2032
- Table 14: Canada Nuclear Energy Market Volume (gigawatt) Forecast, by Application 2019 & 2032
- Table 15: Rest of North America Nuclear Energy Market Revenue (USD Billion) Forecast, by Application 2019 & 2032
- Table 16: Rest of North America Nuclear Energy Market Volume (gigawatt) Forecast, by Application 2019 & 2032
- Table 17: Global Nuclear Energy Market Revenue USD Billion Forecast, by Country 2019 & 2032
- Table 18: Global Nuclear Energy Market Volume gigawatt Forecast, by Country 2019 & 2032
- Table 19: Germany Nuclear Energy Market Revenue (USD Billion) Forecast, by Application 2019 & 2032
- Table 20: Germany Nuclear Energy Market Volume (gigawatt) Forecast, by Application 2019 & 2032
- Table 21: United Kingdom Nuclear Energy Market Revenue (USD Billion) Forecast, by Application 2019 & 2032
- Table 22: United Kingdom Nuclear Energy Market Volume (gigawatt) Forecast, by Application 2019 & 2032
- Table 23: Russia Nuclear Energy Market Revenue (USD Billion) Forecast, by Application 2019 & 2032
- Table 24: Russia Nuclear Energy Market Volume (gigawatt) Forecast, by Application 2019 & 2032
- Table 25: France Nuclear Energy Market Revenue (USD Billion) Forecast, by Application 2019 & 2032
- Table 26: France Nuclear Energy Market Volume (gigawatt) Forecast, by Application 2019 & 2032
- Table 27: Rest of Europe Nuclear Energy Market Revenue (USD Billion) Forecast, by Application 2019 & 2032
- Table 28: Rest of Europe Nuclear Energy Market Volume (gigawatt) Forecast, by Application 2019 & 2032
- Table 29: Global Nuclear Energy Market Revenue USD Billion Forecast, by Country 2019 & 2032
- Table 30: Global Nuclear Energy Market Volume gigawatt Forecast, by Country 2019 & 2032
- Table 31: China Nuclear Energy Market Revenue (USD Billion) Forecast, by Application 2019 & 2032
- Table 32: China Nuclear Energy Market Volume (gigawatt) Forecast, by Application 2019 & 2032
- Table 33: India Nuclear Energy Market Revenue (USD Billion) Forecast, by Application 2019 & 2032
- Table 34: India Nuclear Energy Market Volume (gigawatt) Forecast, by Application 2019 & 2032
- Table 35: Japan Nuclear Energy Market Revenue (USD Billion) Forecast, by Application 2019 & 2032
- Table 36: Japan Nuclear Energy Market Volume (gigawatt) Forecast, by Application 2019 & 2032
- Table 37: South Korea Nuclear Energy Market Revenue (USD Billion) Forecast, by Application 2019 & 2032
- Table 38: South Korea Nuclear Energy Market Volume (gigawatt) Forecast, by Application 2019 & 2032
- Table 39: Rest of Asia Pacific Nuclear Energy Market Revenue (USD Billion) Forecast, by Application 2019 & 2032
- Table 40: Rest of Asia Pacific Nuclear Energy Market Volume (gigawatt) Forecast, by Application 2019 & 2032
- Table 41: Global Nuclear Energy Market Revenue USD Billion Forecast, by Country 2019 & 2032
- Table 42: Global Nuclear Energy Market Volume gigawatt Forecast, by Country 2019 & 2032
- Table 43: Brazil Nuclear Energy Market Revenue (USD Billion) Forecast, by Application 2019 & 2032
- Table 44: Brazil Nuclear Energy Market Volume (gigawatt) Forecast, by Application 2019 & 2032
- Table 45: Argentina Nuclear Energy Market Revenue (USD Billion) Forecast, by Application 2019 & 2032
- Table 46: Argentina Nuclear Energy Market Volume (gigawatt) Forecast, by Application 2019 & 2032
- Table 47: Rest of South America Nuclear Energy Market Revenue (USD Billion) Forecast, by Application 2019 & 2032
- Table 48: Rest of South America Nuclear Energy Market Volume (gigawatt) Forecast, by Application 2019 & 2032
- Table 49: Global Nuclear Energy Market Revenue USD Billion Forecast, by Country 2019 & 2032
- Table 50: Global Nuclear Energy Market Volume gigawatt Forecast, by Country 2019 & 2032
- Table 51: United Arab Emirates Nuclear Energy Market Revenue (USD Billion) Forecast, by Application 2019 & 2032
- Table 52: United Arab Emirates Nuclear Energy Market Volume (gigawatt) Forecast, by Application 2019 & 2032
- Table 53: Saudi Arabia Nuclear Energy Market Revenue (USD Billion) Forecast, by Application 2019 & 2032
- Table 54: Saudi Arabia Nuclear Energy Market Volume (gigawatt) Forecast, by Application 2019 & 2032
- Table 55: South Africa Nuclear Energy Market Revenue (USD Billion) Forecast, by Application 2019 & 2032
- Table 56: South Africa Nuclear Energy Market Volume (gigawatt) Forecast, by Application 2019 & 2032
- Table 57: Iran Nuclear Energy Market Revenue (USD Billion) Forecast, by Application 2019 & 2032
- Table 58: Iran Nuclear Energy Market Volume (gigawatt) Forecast, by Application 2019 & 2032
- Table 59: Rest of Middle East and Africa Nuclear Energy Market Revenue (USD Billion) Forecast, by Application 2019 & 2032
- Table 60: Rest of Middle East and Africa Nuclear Energy Market Volume (gigawatt) Forecast, by Application 2019 & 2032
- Table 61: Global Nuclear Energy Market Revenue USD Billion Forecast, by Application (Qualitative Analysis) 2019 & 2032
- Table 62: Global Nuclear Energy Market Volume gigawatt Forecast, by Application (Qualitative Analysis) 2019 & 2032
- Table 63: Global Nuclear Energy Market Revenue USD Billion Forecast, by Reactor Type 2019 & 2032
- Table 64: Global Nuclear Energy Market Volume gigawatt Forecast, by Reactor Type 2019 & 2032
- Table 65: Global Nuclear Energy Market Revenue USD Billion Forecast, by Country 2019 & 2032
- Table 66: Global Nuclear Energy Market Volume gigawatt Forecast, by Country 2019 & 2032
- Table 67: United States Nuclear Energy Market Revenue (USD Billion) Forecast, by Application 2019 & 2032
- Table 68: United States Nuclear Energy Market Volume (gigawatt) Forecast, by Application 2019 & 2032
- Table 69: Canada Nuclear Energy Market Revenue (USD Billion) Forecast, by Application 2019 & 2032
- Table 70: Canada Nuclear Energy Market Volume (gigawatt) Forecast, by Application 2019 & 2032
- Table 71: Rest of North America Nuclear Energy Market Revenue (USD Billion) Forecast, by Application 2019 & 2032
- Table 72: Rest of North America Nuclear Energy Market Volume (gigawatt) Forecast, by Application 2019 & 2032
- Table 73: Global Nuclear Energy Market Revenue USD Billion Forecast, by Application (Qualitative Analysis) 2019 & 2032
- Table 74: Global Nuclear Energy Market Volume gigawatt Forecast, by Application (Qualitative Analysis) 2019 & 2032
- Table 75: Global Nuclear Energy Market Revenue USD Billion Forecast, by Reactor Type 2019 & 2032
- Table 76: Global Nuclear Energy Market Volume gigawatt Forecast, by Reactor Type 2019 & 2032
- Table 77: Global Nuclear Energy Market Revenue USD Billion Forecast, by Country 2019 & 2032
- Table 78: Global Nuclear Energy Market Volume gigawatt Forecast, by Country 2019 & 2032
- Table 79: Germany Nuclear Energy Market Revenue (USD Billion) Forecast, by Application 2019 & 2032
- Table 80: Germany Nuclear Energy Market Volume (gigawatt) Forecast, by Application 2019 & 2032
- Table 81: United Kingdom Nuclear Energy Market Revenue (USD Billion) Forecast, by Application 2019 & 2032
- Table 82: United Kingdom Nuclear Energy Market Volume (gigawatt) Forecast, by Application 2019 & 2032
- Table 83: Russia Nuclear Energy Market Revenue (USD Billion) Forecast, by Application 2019 & 2032
- Table 84: Russia Nuclear Energy Market Volume (gigawatt) Forecast, by Application 2019 & 2032
- Table 85: France Nuclear Energy Market Revenue (USD Billion) Forecast, by Application 2019 & 2032
- Table 86: France Nuclear Energy Market Volume (gigawatt) Forecast, by Application 2019 & 2032
- Table 87: Rest of Europe Nuclear Energy Market Revenue (USD Billion) Forecast, by Application 2019 & 2032
- Table 88: Rest of Europe Nuclear Energy Market Volume (gigawatt) Forecast, by Application 2019 & 2032
- Table 89: Global Nuclear Energy Market Revenue USD Billion Forecast, by Application (Qualitative Analysis) 2019 & 2032
- Table 90: Global Nuclear Energy Market Volume gigawatt Forecast, by Application (Qualitative Analysis) 2019 & 2032
- Table 91: Global Nuclear Energy Market Revenue USD Billion Forecast, by Reactor Type 2019 & 2032
- Table 92: Global Nuclear Energy Market Volume gigawatt Forecast, by Reactor Type 2019 & 2032
- Table 93: Global Nuclear Energy Market Revenue USD Billion Forecast, by Country 2019 & 2032
- Table 94: Global Nuclear Energy Market Volume gigawatt Forecast, by Country 2019 & 2032
- Table 95: China Nuclear Energy Market Revenue (USD Billion) Forecast, by Application 2019 & 2032
- Table 96: China Nuclear Energy Market Volume (gigawatt) Forecast, by Application 2019 & 2032
- Table 97: India Nuclear Energy Market Revenue (USD Billion) Forecast, by Application 2019 & 2032
- Table 98: India Nuclear Energy Market Volume (gigawatt) Forecast, by Application 2019 & 2032
- Table 99: Japan Nuclear Energy Market Revenue (USD Billion) Forecast, by Application 2019 & 2032
- Table 100: Japan Nuclear Energy Market Volume (gigawatt) Forecast, by Application 2019 & 2032
- Table 101: South Korea Nuclear Energy Market Revenue (USD Billion) Forecast, by Application 2019 & 2032
- Table 102: South Korea Nuclear Energy Market Volume (gigawatt) Forecast, by Application 2019 & 2032
- Table 103: Rest of Asia Pacific Nuclear Energy Market Revenue (USD Billion) Forecast, by Application 2019 & 2032
- Table 104: Rest of Asia Pacific Nuclear Energy Market Volume (gigawatt) Forecast, by Application 2019 & 2032
- Table 105: Global Nuclear Energy Market Revenue USD Billion Forecast, by Application (Qualitative Analysis) 2019 & 2032
- Table 106: Global Nuclear Energy Market Volume gigawatt Forecast, by Application (Qualitative Analysis) 2019 & 2032
- Table 107: Global Nuclear Energy Market Revenue USD Billion Forecast, by Reactor Type 2019 & 2032
- Table 108: Global Nuclear Energy Market Volume gigawatt Forecast, by Reactor Type 2019 & 2032
- Table 109: Global Nuclear Energy Market Revenue USD Billion Forecast, by Country 2019 & 2032
- Table 110: Global Nuclear Energy Market Volume gigawatt Forecast, by Country 2019 & 2032
- Table 111: Brazil Nuclear Energy Market Revenue (USD Billion) Forecast, by Application 2019 & 2032
- Table 112: Brazil Nuclear Energy Market Volume (gigawatt) Forecast, by Application 2019 & 2032
- Table 113: Argentina Nuclear Energy Market Revenue (USD Billion) Forecast, by Application 2019 & 2032
- Table 114: Argentina Nuclear Energy Market Volume (gigawatt) Forecast, by Application 2019 & 2032
- Table 115: Rest of South America Nuclear Energy Market Revenue (USD Billion) Forecast, by Application 2019 & 2032
- Table 116: Rest of South America Nuclear Energy Market Volume (gigawatt) Forecast, by Application 2019 & 2032
- Table 117: Global Nuclear Energy Market Revenue USD Billion Forecast, by Application (Qualitative Analysis) 2019 & 2032
- Table 118: Global Nuclear Energy Market Volume gigawatt Forecast, by Application (Qualitative Analysis) 2019 & 2032
- Table 119: Global Nuclear Energy Market Revenue USD Billion Forecast, by Reactor Type 2019 & 2032
- Table 120: Global Nuclear Energy Market Volume gigawatt Forecast, by Reactor Type 2019 & 2032
- Table 121: Global Nuclear Energy Market Revenue USD Billion Forecast, by Country 2019 & 2032
- Table 122: Global Nuclear Energy Market Volume gigawatt Forecast, by Country 2019 & 2032
- Table 123: United Arab Emirates Nuclear Energy Market Revenue (USD Billion) Forecast, by Application 2019 & 2032
- Table 124: United Arab Emirates Nuclear Energy Market Volume (gigawatt) Forecast, by Application 2019 & 2032
- Table 125: Saudi Arabia Nuclear Energy Market Revenue (USD Billion) Forecast, by Application 2019 & 2032
- Table 126: Saudi Arabia Nuclear Energy Market Volume (gigawatt) Forecast, by Application 2019 & 2032
- Table 127: South Africa Nuclear Energy Market Revenue (USD Billion) Forecast, by Application 2019 & 2032
- Table 128: South Africa Nuclear Energy Market Volume (gigawatt) Forecast, by Application 2019 & 2032
- Table 129: Iran Nuclear Energy Market Revenue (USD Billion) Forecast, by Application 2019 & 2032
- Table 130: Iran Nuclear Energy Market Volume (gigawatt) Forecast, by Application 2019 & 2032
- Table 131: Rest of Middle East and Africa Nuclear Energy Market Revenue (USD Billion) Forecast, by Application 2019 & 2032
- Table 132: Rest of Middle East and Africa Nuclear Energy Market Volume (gigawatt) Forecast, by Application 2019 & 2032
Frequently Asked Questions
1. What is the projected Compound Annual Growth Rate (CAGR) of the Nuclear Energy Market?
The projected CAGR is approximately 3.4%.
2. Which companies are prominent players in the Nuclear Energy Market?
Key companies in the market include BWX Technologies Inc, Westinghouse Electric Company LLC, Bilfinger SE, China National Nuclear Corporation, Doosan Enerbility Co Ltd, SKODA JS AS, Electricite de France SA (EDF), Rosatom State Atomic Energy Corporation, Bechtel Group Inc, KEPCO Engineering & Construction*List Not Exhaustive 6 4 Market Ranking/Share (%) Analysi, Japan Atomic Power Company, Duke Energy Corporation, Mitsubishi Heavy Industries Ltd, GE-Hitachi Nuclear Energy Inc.
3. What are the main segments of the Nuclear Energy Market?
The market segments include Application (Qualitative Analysis) , Reactor Type.
4. Can you provide details about the market size?
The market size is estimated to be USD 35.99 USD Billion as of 2022.
5. What are some drivers contributing to market growth?
4.; Increase in Demand for Clean Energy4.; Plant Lifetime Extensions With Favorable Policies.
6. What are the notable trends driving market growth?
Energy Segment Expected to Dominate the Market.
7. Are there any restraints impacting market growth?
4.; Intense Competition From Renewable Energy Sources4.; Accidents and Uncertainty over the Cost Effectiveness.
8. Can you provide examples of recent developments in the market?
February 2024: Iran commenced the construction of four additional nuclear power plants in the southern part of the country. These plants will have a combined capacity of 5,000 MW. The plants will be located in the port town of Sirik on Iran's East coast, about 1,150 km South of Tehran. The project is estimated to cost more than USD 20 billion. Each plant is projected to consume 35 tonnes of nuclear fuel per annum.
9. What pricing options are available for accessing the report?
Pricing options include single-user, multi-user, and enterprise licenses priced at USD 4750, USD 5250, and USD 8750 respectively.
10. Is the market size provided in terms of value or volume?
The market size is provided in terms of value, measured in USD Billion and volume, measured in gigawatt.
11. Are there any specific market keywords associated with the report?
Yes, the market keyword associated with the report is "Nuclear Energy Market," which aids in identifying and referencing the specific market segment covered.
12. How do I determine which pricing option suits my needs best?
The pricing options vary based on user requirements and access needs. Individual users may opt for single-user licenses, while businesses requiring broader access may choose multi-user or enterprise licenses for cost-effective access to the report.
13. Are there any additional resources or data provided in the Nuclear Energy Market report?
While the report offers comprehensive insights, it's advisable to review the specific contents or supplementary materials provided to ascertain if additional resources or data are available.
14. How can I stay updated on further developments or reports in the Nuclear Energy Market?
To stay informed about further developments, trends, and reports in the Nuclear Energy Market, consider subscribing to industry newsletters, following relevant companies and organizations, or regularly checking reputable industry news sources and publications.
Methodology
Step 1 - Identification of Relevant Samples Size from Population Database


Step 2 - Approaches for Defining Global Market Size (Value, Volume* & Price*)

Note*: In applicable scenarios
Step 3 - Data Sources
Primary Research
- Web Analytics
- Survey Reports
- Research Institute
- Latest Research Reports
- Opinion Leaders
Secondary Research
- Annual Reports
- White Paper
- Latest Press Release
- Industry Association
- Paid Database
- Investor Presentations

Step 4 - Data Triangulation
Involves using different sources of information in order to increase the validity of a study
These sources are likely to be stakeholders in a program - participants, other researchers, program staff, other community members, and so on.
Then we put all data in single framework & apply various statistical tools to find out the dynamic on the market.
During the analysis stage, feedback from the stakeholder groups would be compared to determine areas of agreement as well as areas of divergence
