

Key Insights
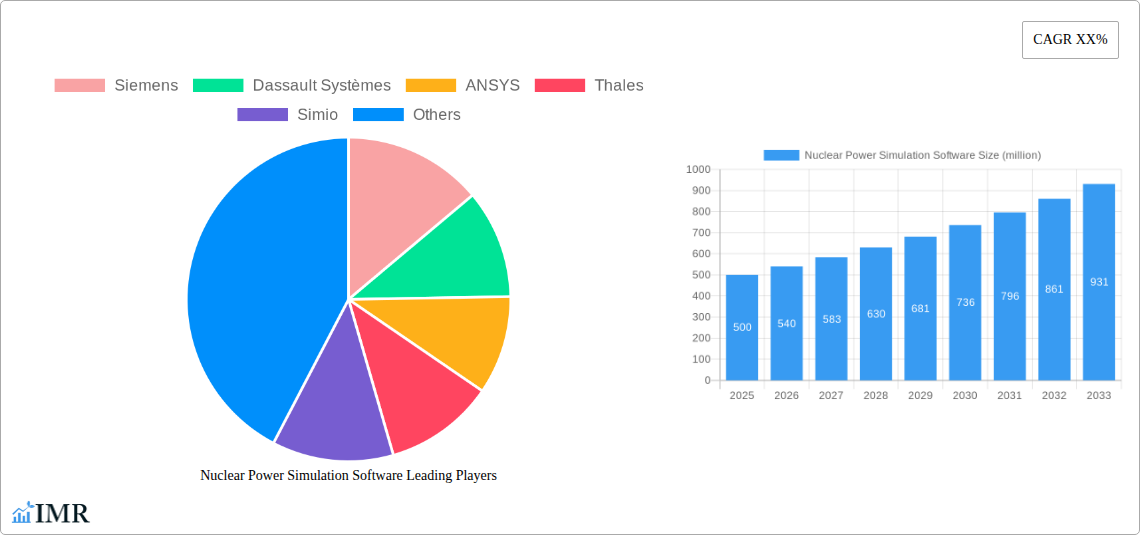
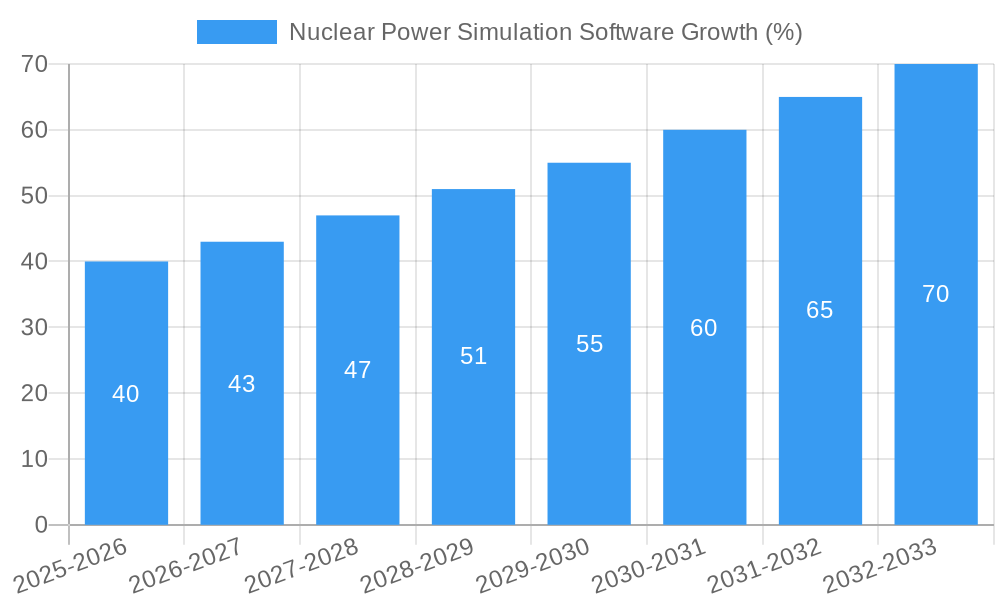
The nuclear power simulation software market is experiencing robust growth, driven by the increasing demand for safer and more efficient nuclear power plants globally. The market's expansion is fueled by several key factors: stringent regulatory requirements mandating rigorous safety assessments before plant operation, the need to optimize plant performance and reduce operational costs, and the rising adoption of digital twin technologies for predictive maintenance and enhanced operational efficiency. The market size in 2025 is estimated at $500 million, reflecting a significant increase from previous years. A compound annual growth rate (CAGR) of 8% is projected for the forecast period 2025-2033, indicating substantial market expansion. Key segments within the market include reactor simulation, fuel cycle simulation, and safety analysis software. Leading companies such as Siemens, Dassault Systèmes, and ANSYS are actively investing in research and development to enhance their software capabilities and maintain a competitive edge. The market faces challenges including high software costs, the complexity of nuclear power plant simulations and the need for specialized expertise to operate these sophisticated tools. However, the long-term prospects for the market remain positive, driven by the continued importance of nuclear energy in global energy mixes and the ongoing advancements in simulation technologies.
Despite the aforementioned challenges, the market is poised for significant expansion due to several emerging trends. The integration of Artificial Intelligence (AI) and Machine Learning (ML) into simulation software is enhancing accuracy and efficiency, leading to more sophisticated analysis capabilities. Cloud-based solutions are also gaining traction, offering improved accessibility and scalability. Furthermore, the increasing collaboration between software providers and nuclear power plant operators is fostering the development of more customized and user-friendly simulation tools. Regional growth is expected to be driven by both mature markets such as North America and Europe, alongside emerging markets in Asia and the Middle East which are undergoing significant investment in nuclear infrastructure development. This robust growth, coupled with continuous technological innovation, ensures that the nuclear power simulation software market will remain a dynamic and lucrative sector in the coming years.
Nuclear Power Simulation Software Market Report: 2019-2033
This comprehensive report provides an in-depth analysis of the global Nuclear Power Simulation Software market, encompassing market dynamics, growth trends, regional analysis, competitive landscape, and future outlook. The study period covers 2019-2033, with a base year of 2025 and a forecast period of 2025-2033. The report leverages extensive primary and secondary research, offering invaluable insights for industry professionals, investors, and strategic decision-makers. The market is valued at $xx million in 2025 and is projected to reach $xx million by 2033, exhibiting a CAGR of xx%.
Parent Market: Software Market (Parent Market Size in 2025: $xx million) Child Market: Nuclear Power Simulation Software Market
Nuclear Power Simulation Software Market Dynamics & Structure
The nuclear power simulation software market is characterized by moderate concentration, with key players like Siemens, ANSYS, and Dassault Systèmes holding significant market share. Technological innovation, driven by advancements in computational power and AI, is a primary growth driver. Stringent regulatory frameworks and safety protocols influence software development and adoption. Competitive substitutes include physical testing and simplified analytical models, but the increasing complexity of nuclear power plants necessitates sophisticated simulation software. The end-user demographic comprises nuclear power plant operators, engineering firms, research institutions, and government regulatory bodies. M&A activity in the sector has been moderate, with xx deals recorded during the historical period (2019-2024), primarily focused on enhancing capabilities and expanding market reach.
- Market Concentration: Moderately concentrated, with top 5 players holding xx% market share in 2025.
- Technological Innovation: Advancements in AI, HPC, and cloud computing are driving software sophistication.
- Regulatory Landscape: Stringent safety and security regulations influence software development and adoption.
- Competitive Substitutes: Physical testing and simplified analytical models pose competition, but are gradually being replaced by advanced simulation tools.
- M&A Activity: xx M&A deals recorded between 2019 and 2024, focusing on technology integration and market expansion.
- Innovation Barriers: High development costs, stringent regulatory approvals, and specialized expertise required.
Nuclear Power Simulation Software Growth Trends & Insights
The global nuclear power simulation software market witnessed steady growth during the historical period (2019-2024), driven by increasing demand for efficient and safe nuclear power generation. Adoption rates are influenced by factors such as technological advancements, regulatory changes, and rising safety concerns. The market is experiencing a shift towards cloud-based solutions and integration with other plant management systems. Technological disruptions, such as the emergence of AI-powered predictive maintenance capabilities, are enhancing software functionality. Consumer behavior shows a preference for comprehensive, user-friendly, and validated simulation packages that reduce operational risks and improve efficiency.
- Market Size Evolution: Market size grew from $xx million in 2019 to $xx million in 2024.
- Adoption Rate: xx% adoption rate among nuclear power plants in 2025, projected to reach xx% by 2033.
- Technological Disruptions: AI and machine learning are transforming predictive maintenance and risk assessment capabilities.
- Consumer Behavior Shifts: Increasing preference for cloud-based, integrated, and user-friendly software solutions.
Dominant Regions, Countries, or Segments in Nuclear Power Simulation Software
North America currently dominates the nuclear power simulation software market, driven by a mature nuclear power industry and significant investments in R&D. Strong regulatory frameworks and the presence of major software vendors further contribute to this region's dominance. Europe follows closely, with strong government support for nuclear energy and a high concentration of nuclear power plants. Asia-Pacific is expected to witness significant growth in the forecast period, propelled by increasing nuclear power capacity additions and technological advancements.
- Key Drivers in North America: Strong regulatory frameworks, high investment in R&D, presence of major software vendors.
- Key Drivers in Europe: Government support for nuclear energy, large nuclear power plant base, focus on safety and efficiency.
- Key Drivers in Asia-Pacific: Increasing nuclear power capacity, technological advancements, economic growth.
- Market Share: North America holds xx% market share, followed by Europe with xx% and Asia-Pacific with xx% in 2025.
Nuclear Power Simulation Software Product Landscape
Nuclear power simulation software encompasses a range of products, from standalone applications for specific functionalities (e.g., reactor core simulation) to integrated platforms encompassing multiple aspects of plant operation and safety analysis. These products boast advanced features such as high-fidelity modeling, real-time simulation, and sophisticated data visualization tools. Unique selling propositions frequently include enhanced accuracy, user-friendliness, and seamless integration with existing plant systems. Recent technological advancements involve incorporating AI for predictive maintenance and advanced risk assessment.
Key Drivers, Barriers & Challenges in Nuclear Power Simulation Software
Key Drivers: The increasing complexity of nuclear power plants, the need for enhanced safety and operational efficiency, and stringent regulatory requirements drive the demand for sophisticated simulation software. Growing focus on optimizing plant performance, reducing operational costs, and extending plant lifespan further fuels market growth.
Key Challenges: High development costs, the need for rigorous validation and verification, and potential cybersecurity vulnerabilities pose challenges. The complexity of integrating software with existing plant infrastructure also presents hurdles. Competitive pressures from established players and emerging technologies contribute to the market’s dynamic nature. Supply chain disruptions can impact software delivery and maintenance, while regulatory hurdles can delay product launches.
Emerging Opportunities in Nuclear Power Simulation Software
Emerging opportunities lie in the integration of AI and machine learning for predictive maintenance and risk assessment. The development of cloud-based solutions enhances accessibility and scalability. Furthermore, the expansion into new markets with growing nuclear power capacity offers significant potential. The integration of simulation software with other plant management systems presents opportunities for enhanced operational efficiency. Finally, development of specialized solutions for small modular reactors (SMRs) represents a promising new market segment.
Growth Accelerators in the Nuclear Power Simulation Software Industry
Strategic partnerships between software vendors and nuclear power plant operators accelerate technology adoption and market penetration. Technological breakthroughs, such as the incorporation of AI and advanced modeling techniques, enhance software capabilities. Government incentives and policies promoting nuclear energy foster market growth. Market expansion into developing economies with growing nuclear power capacity presents significant opportunities for long-term growth.
Key Players Shaping the Nuclear Power Simulation Software Market
- Siemens
- Dassault Systèmes
- ANSYS
- Thales
- Simio
- ESI
- Fortum
- WSC
- Coreform
- L3Harris
- CORYS
- Energy Exemplar
- ProSim
- Simuserv
- Chetu
Notable Milestones in Nuclear Power Simulation Software Sector
- 2020: ANSYS releases upgraded nuclear simulation software with improved AI capabilities.
- 2021: Siemens partners with a major nuclear power plant operator to integrate its simulation software into plant operations.
- 2022: Dassault Systèmes acquires a specialized nuclear simulation software company, expanding its product portfolio.
- 2023: A significant regulatory update impacts software validation requirements.
- 2024: Several new cloud-based nuclear simulation platforms are launched.
In-Depth Nuclear Power Simulation Software Market Outlook
The nuclear power simulation software market is poised for robust growth over the next decade, driven by technological advancements, increased regulatory scrutiny, and the need for enhanced plant safety and operational efficiency. The continued expansion into new markets and the integration of AI and machine learning will further fuel market growth. Strategic partnerships and innovative product development will play a key role in shaping the competitive landscape. The potential for significant market expansion in regions with planned increases in nuclear power capacity represents a substantial growth opportunity.
Nuclear Power Simulation Software Segmentation
-
1. Application
- 1.1. Nuclear Power Plant
- 1.2. Research
- 1.3. Other
-
2. Types
- 2.1. Cloud Based
- 2.2. On-Premise
Nuclear Power Simulation Software Segmentation By Geography
-
1. North America
- 1.1. United States
- 1.2. Canada
- 1.3. Mexico
-
2. South America
- 2.1. Brazil
- 2.2. Argentina
- 2.3. Rest of South America
-
3. Europe
- 3.1. United Kingdom
- 3.2. Germany
- 3.3. France
- 3.4. Italy
- 3.5. Spain
- 3.6. Russia
- 3.7. Benelux
- 3.8. Nordics
- 3.9. Rest of Europe
-
4. Middle East & Africa
- 4.1. Turkey
- 4.2. Israel
- 4.3. GCC
- 4.4. North Africa
- 4.5. South Africa
- 4.6. Rest of Middle East & Africa
-
5. Asia Pacific
- 5.1. China
- 5.2. India
- 5.3. Japan
- 5.4. South Korea
- 5.5. ASEAN
- 5.6. Oceania
- 5.7. Rest of Asia Pacific

Nuclear Power Simulation Software REPORT HIGHLIGHTS
| Aspects | Details |
|---|---|
| Study Period | 2019-2033 |
| Base Year | 2024 |
| Estimated Year | 2025 |
| Forecast Period | 2025-2033 |
| Historical Period | 2019-2024 |
| Growth Rate | CAGR of XX% from 2019-2033 |
| Segmentation |
|
Table of Contents
- 1. Introduction
- 1.1. Research Scope
- 1.2. Market Segmentation
- 1.3. Research Methodology
- 1.4. Definitions and Assumptions
- 2. Executive Summary
- 2.1. Introduction
- 3. Market Dynamics
- 3.1. Introduction
- 3.2. Market Drivers
- 3.3. Market Restrains
- 3.4. Market Trends
- 4. Market Factor Analysis
- 4.1. Porters Five Forces
- 4.2. Supply/Value Chain
- 4.3. PESTEL analysis
- 4.4. Market Entropy
- 4.5. Patent/Trademark Analysis
- 5. Global Nuclear Power Simulation Software Analysis, Insights and Forecast, 2019-2031
- 5.1. Market Analysis, Insights and Forecast - by Application
- 5.1.1. Nuclear Power Plant
- 5.1.2. Research
- 5.1.3. Other
- 5.2. Market Analysis, Insights and Forecast - by Types
- 5.2.1. Cloud Based
- 5.2.2. On-Premise
- 5.3. Market Analysis, Insights and Forecast - by Region
- 5.3.1. North America
- 5.3.2. South America
- 5.3.3. Europe
- 5.3.4. Middle East & Africa
- 5.3.5. Asia Pacific
- 5.1. Market Analysis, Insights and Forecast - by Application
- 6. North America Nuclear Power Simulation Software Analysis, Insights and Forecast, 2019-2031
- 6.1. Market Analysis, Insights and Forecast - by Application
- 6.1.1. Nuclear Power Plant
- 6.1.2. Research
- 6.1.3. Other
- 6.2. Market Analysis, Insights and Forecast - by Types
- 6.2.1. Cloud Based
- 6.2.2. On-Premise
- 6.1. Market Analysis, Insights and Forecast - by Application
- 7. South America Nuclear Power Simulation Software Analysis, Insights and Forecast, 2019-2031
- 7.1. Market Analysis, Insights and Forecast - by Application
- 7.1.1. Nuclear Power Plant
- 7.1.2. Research
- 7.1.3. Other
- 7.2. Market Analysis, Insights and Forecast - by Types
- 7.2.1. Cloud Based
- 7.2.2. On-Premise
- 7.1. Market Analysis, Insights and Forecast - by Application
- 8. Europe Nuclear Power Simulation Software Analysis, Insights and Forecast, 2019-2031
- 8.1. Market Analysis, Insights and Forecast - by Application
- 8.1.1. Nuclear Power Plant
- 8.1.2. Research
- 8.1.3. Other
- 8.2. Market Analysis, Insights and Forecast - by Types
- 8.2.1. Cloud Based
- 8.2.2. On-Premise
- 8.1. Market Analysis, Insights and Forecast - by Application
- 9. Middle East & Africa Nuclear Power Simulation Software Analysis, Insights and Forecast, 2019-2031
- 9.1. Market Analysis, Insights and Forecast - by Application
- 9.1.1. Nuclear Power Plant
- 9.1.2. Research
- 9.1.3. Other
- 9.2. Market Analysis, Insights and Forecast - by Types
- 9.2.1. Cloud Based
- 9.2.2. On-Premise
- 9.1. Market Analysis, Insights and Forecast - by Application
- 10. Asia Pacific Nuclear Power Simulation Software Analysis, Insights and Forecast, 2019-2031
- 10.1. Market Analysis, Insights and Forecast - by Application
- 10.1.1. Nuclear Power Plant
- 10.1.2. Research
- 10.1.3. Other
- 10.2. Market Analysis, Insights and Forecast - by Types
- 10.2.1. Cloud Based
- 10.2.2. On-Premise
- 10.1. Market Analysis, Insights and Forecast - by Application
- 11. Competitive Analysis
- 11.1. Global Market Share Analysis 2024
- 11.2. Company Profiles
- 11.2.1 Siemens
- 11.2.1.1. Overview
- 11.2.1.2. Products
- 11.2.1.3. SWOT Analysis
- 11.2.1.4. Recent Developments
- 11.2.1.5. Financials (Based on Availability)
- 11.2.2 Dassault Systèmes
- 11.2.2.1. Overview
- 11.2.2.2. Products
- 11.2.2.3. SWOT Analysis
- 11.2.2.4. Recent Developments
- 11.2.2.5. Financials (Based on Availability)
- 11.2.3 ANSYS
- 11.2.3.1. Overview
- 11.2.3.2. Products
- 11.2.3.3. SWOT Analysis
- 11.2.3.4. Recent Developments
- 11.2.3.5. Financials (Based on Availability)
- 11.2.4 Thales
- 11.2.4.1. Overview
- 11.2.4.2. Products
- 11.2.4.3. SWOT Analysis
- 11.2.4.4. Recent Developments
- 11.2.4.5. Financials (Based on Availability)
- 11.2.5 Simio
- 11.2.5.1. Overview
- 11.2.5.2. Products
- 11.2.5.3. SWOT Analysis
- 11.2.5.4. Recent Developments
- 11.2.5.5. Financials (Based on Availability)
- 11.2.6 ESI
- 11.2.6.1. Overview
- 11.2.6.2. Products
- 11.2.6.3. SWOT Analysis
- 11.2.6.4. Recent Developments
- 11.2.6.5. Financials (Based on Availability)
- 11.2.7 Fortum
- 11.2.7.1. Overview
- 11.2.7.2. Products
- 11.2.7.3. SWOT Analysis
- 11.2.7.4. Recent Developments
- 11.2.7.5. Financials (Based on Availability)
- 11.2.8 WSC
- 11.2.8.1. Overview
- 11.2.8.2. Products
- 11.2.8.3. SWOT Analysis
- 11.2.8.4. Recent Developments
- 11.2.8.5. Financials (Based on Availability)
- 11.2.9 Coreform
- 11.2.9.1. Overview
- 11.2.9.2. Products
- 11.2.9.3. SWOT Analysis
- 11.2.9.4. Recent Developments
- 11.2.9.5. Financials (Based on Availability)
- 11.2.10 L3Harris
- 11.2.10.1. Overview
- 11.2.10.2. Products
- 11.2.10.3. SWOT Analysis
- 11.2.10.4. Recent Developments
- 11.2.10.5. Financials (Based on Availability)
- 11.2.11 CORYS
- 11.2.11.1. Overview
- 11.2.11.2. Products
- 11.2.11.3. SWOT Analysis
- 11.2.11.4. Recent Developments
- 11.2.11.5. Financials (Based on Availability)
- 11.2.12 Energy Exemplar
- 11.2.12.1. Overview
- 11.2.12.2. Products
- 11.2.12.3. SWOT Analysis
- 11.2.12.4. Recent Developments
- 11.2.12.5. Financials (Based on Availability)
- 11.2.13 ProSim
- 11.2.13.1. Overview
- 11.2.13.2. Products
- 11.2.13.3. SWOT Analysis
- 11.2.13.4. Recent Developments
- 11.2.13.5. Financials (Based on Availability)
- 11.2.14 Simuserv
- 11.2.14.1. Overview
- 11.2.14.2. Products
- 11.2.14.3. SWOT Analysis
- 11.2.14.4. Recent Developments
- 11.2.14.5. Financials (Based on Availability)
- 11.2.15 Chetu
- 11.2.15.1. Overview
- 11.2.15.2. Products
- 11.2.15.3. SWOT Analysis
- 11.2.15.4. Recent Developments
- 11.2.15.5. Financials (Based on Availability)
- 11.2.1 Siemens
List of Figures
- Figure 1: Global Nuclear Power Simulation Software Revenue Breakdown (million, %) by Region 2024 & 2032
- Figure 2: North America Nuclear Power Simulation Software Revenue (million), by Application 2024 & 2032
- Figure 3: North America Nuclear Power Simulation Software Revenue Share (%), by Application 2024 & 2032
- Figure 4: North America Nuclear Power Simulation Software Revenue (million), by Types 2024 & 2032
- Figure 5: North America Nuclear Power Simulation Software Revenue Share (%), by Types 2024 & 2032
- Figure 6: North America Nuclear Power Simulation Software Revenue (million), by Country 2024 & 2032
- Figure 7: North America Nuclear Power Simulation Software Revenue Share (%), by Country 2024 & 2032
- Figure 8: South America Nuclear Power Simulation Software Revenue (million), by Application 2024 & 2032
- Figure 9: South America Nuclear Power Simulation Software Revenue Share (%), by Application 2024 & 2032
- Figure 10: South America Nuclear Power Simulation Software Revenue (million), by Types 2024 & 2032
- Figure 11: South America Nuclear Power Simulation Software Revenue Share (%), by Types 2024 & 2032
- Figure 12: South America Nuclear Power Simulation Software Revenue (million), by Country 2024 & 2032
- Figure 13: South America Nuclear Power Simulation Software Revenue Share (%), by Country 2024 & 2032
- Figure 14: Europe Nuclear Power Simulation Software Revenue (million), by Application 2024 & 2032
- Figure 15: Europe Nuclear Power Simulation Software Revenue Share (%), by Application 2024 & 2032
- Figure 16: Europe Nuclear Power Simulation Software Revenue (million), by Types 2024 & 2032
- Figure 17: Europe Nuclear Power Simulation Software Revenue Share (%), by Types 2024 & 2032
- Figure 18: Europe Nuclear Power Simulation Software Revenue (million), by Country 2024 & 2032
- Figure 19: Europe Nuclear Power Simulation Software Revenue Share (%), by Country 2024 & 2032
- Figure 20: Middle East & Africa Nuclear Power Simulation Software Revenue (million), by Application 2024 & 2032
- Figure 21: Middle East & Africa Nuclear Power Simulation Software Revenue Share (%), by Application 2024 & 2032
- Figure 22: Middle East & Africa Nuclear Power Simulation Software Revenue (million), by Types 2024 & 2032
- Figure 23: Middle East & Africa Nuclear Power Simulation Software Revenue Share (%), by Types 2024 & 2032
- Figure 24: Middle East & Africa Nuclear Power Simulation Software Revenue (million), by Country 2024 & 2032
- Figure 25: Middle East & Africa Nuclear Power Simulation Software Revenue Share (%), by Country 2024 & 2032
- Figure 26: Asia Pacific Nuclear Power Simulation Software Revenue (million), by Application 2024 & 2032
- Figure 27: Asia Pacific Nuclear Power Simulation Software Revenue Share (%), by Application 2024 & 2032
- Figure 28: Asia Pacific Nuclear Power Simulation Software Revenue (million), by Types 2024 & 2032
- Figure 29: Asia Pacific Nuclear Power Simulation Software Revenue Share (%), by Types 2024 & 2032
- Figure 30: Asia Pacific Nuclear Power Simulation Software Revenue (million), by Country 2024 & 2032
- Figure 31: Asia Pacific Nuclear Power Simulation Software Revenue Share (%), by Country 2024 & 2032
List of Tables
- Table 1: Global Nuclear Power Simulation Software Revenue million Forecast, by Region 2019 & 2032
- Table 2: Global Nuclear Power Simulation Software Revenue million Forecast, by Application 2019 & 2032
- Table 3: Global Nuclear Power Simulation Software Revenue million Forecast, by Types 2019 & 2032
- Table 4: Global Nuclear Power Simulation Software Revenue million Forecast, by Region 2019 & 2032
- Table 5: Global Nuclear Power Simulation Software Revenue million Forecast, by Application 2019 & 2032
- Table 6: Global Nuclear Power Simulation Software Revenue million Forecast, by Types 2019 & 2032
- Table 7: Global Nuclear Power Simulation Software Revenue million Forecast, by Country 2019 & 2032
- Table 8: United States Nuclear Power Simulation Software Revenue (million) Forecast, by Application 2019 & 2032
- Table 9: Canada Nuclear Power Simulation Software Revenue (million) Forecast, by Application 2019 & 2032
- Table 10: Mexico Nuclear Power Simulation Software Revenue (million) Forecast, by Application 2019 & 2032
- Table 11: Global Nuclear Power Simulation Software Revenue million Forecast, by Application 2019 & 2032
- Table 12: Global Nuclear Power Simulation Software Revenue million Forecast, by Types 2019 & 2032
- Table 13: Global Nuclear Power Simulation Software Revenue million Forecast, by Country 2019 & 2032
- Table 14: Brazil Nuclear Power Simulation Software Revenue (million) Forecast, by Application 2019 & 2032
- Table 15: Argentina Nuclear Power Simulation Software Revenue (million) Forecast, by Application 2019 & 2032
- Table 16: Rest of South America Nuclear Power Simulation Software Revenue (million) Forecast, by Application 2019 & 2032
- Table 17: Global Nuclear Power Simulation Software Revenue million Forecast, by Application 2019 & 2032
- Table 18: Global Nuclear Power Simulation Software Revenue million Forecast, by Types 2019 & 2032
- Table 19: Global Nuclear Power Simulation Software Revenue million Forecast, by Country 2019 & 2032
- Table 20: United Kingdom Nuclear Power Simulation Software Revenue (million) Forecast, by Application 2019 & 2032
- Table 21: Germany Nuclear Power Simulation Software Revenue (million) Forecast, by Application 2019 & 2032
- Table 22: France Nuclear Power Simulation Software Revenue (million) Forecast, by Application 2019 & 2032
- Table 23: Italy Nuclear Power Simulation Software Revenue (million) Forecast, by Application 2019 & 2032
- Table 24: Spain Nuclear Power Simulation Software Revenue (million) Forecast, by Application 2019 & 2032
- Table 25: Russia Nuclear Power Simulation Software Revenue (million) Forecast, by Application 2019 & 2032
- Table 26: Benelux Nuclear Power Simulation Software Revenue (million) Forecast, by Application 2019 & 2032
- Table 27: Nordics Nuclear Power Simulation Software Revenue (million) Forecast, by Application 2019 & 2032
- Table 28: Rest of Europe Nuclear Power Simulation Software Revenue (million) Forecast, by Application 2019 & 2032
- Table 29: Global Nuclear Power Simulation Software Revenue million Forecast, by Application 2019 & 2032
- Table 30: Global Nuclear Power Simulation Software Revenue million Forecast, by Types 2019 & 2032
- Table 31: Global Nuclear Power Simulation Software Revenue million Forecast, by Country 2019 & 2032
- Table 32: Turkey Nuclear Power Simulation Software Revenue (million) Forecast, by Application 2019 & 2032
- Table 33: Israel Nuclear Power Simulation Software Revenue (million) Forecast, by Application 2019 & 2032
- Table 34: GCC Nuclear Power Simulation Software Revenue (million) Forecast, by Application 2019 & 2032
- Table 35: North Africa Nuclear Power Simulation Software Revenue (million) Forecast, by Application 2019 & 2032
- Table 36: South Africa Nuclear Power Simulation Software Revenue (million) Forecast, by Application 2019 & 2032
- Table 37: Rest of Middle East & Africa Nuclear Power Simulation Software Revenue (million) Forecast, by Application 2019 & 2032
- Table 38: Global Nuclear Power Simulation Software Revenue million Forecast, by Application 2019 & 2032
- Table 39: Global Nuclear Power Simulation Software Revenue million Forecast, by Types 2019 & 2032
- Table 40: Global Nuclear Power Simulation Software Revenue million Forecast, by Country 2019 & 2032
- Table 41: China Nuclear Power Simulation Software Revenue (million) Forecast, by Application 2019 & 2032
- Table 42: India Nuclear Power Simulation Software Revenue (million) Forecast, by Application 2019 & 2032
- Table 43: Japan Nuclear Power Simulation Software Revenue (million) Forecast, by Application 2019 & 2032
- Table 44: South Korea Nuclear Power Simulation Software Revenue (million) Forecast, by Application 2019 & 2032
- Table 45: ASEAN Nuclear Power Simulation Software Revenue (million) Forecast, by Application 2019 & 2032
- Table 46: Oceania Nuclear Power Simulation Software Revenue (million) Forecast, by Application 2019 & 2032
- Table 47: Rest of Asia Pacific Nuclear Power Simulation Software Revenue (million) Forecast, by Application 2019 & 2032
Frequently Asked Questions
1. What is the projected Compound Annual Growth Rate (CAGR) of the Nuclear Power Simulation Software?
The projected CAGR is approximately XX%.
2. Which companies are prominent players in the Nuclear Power Simulation Software?
Key companies in the market include Siemens, Dassault Systèmes, ANSYS, Thales, Simio, ESI, Fortum, WSC, Coreform, L3Harris, CORYS, Energy Exemplar, ProSim, Simuserv, Chetu.
3. What are the main segments of the Nuclear Power Simulation Software?
The market segments include Application, Types.
4. Can you provide details about the market size?
The market size is estimated to be USD XXX million as of 2022.
5. What are some drivers contributing to market growth?
N/A
6. What are the notable trends driving market growth?
N/A
7. Are there any restraints impacting market growth?
N/A
8. Can you provide examples of recent developments in the market?
N/A
9. What pricing options are available for accessing the report?
Pricing options include single-user, multi-user, and enterprise licenses priced at USD 4350.00, USD 6525.00, and USD 8700.00 respectively.
10. Is the market size provided in terms of value or volume?
The market size is provided in terms of value, measured in million.
11. Are there any specific market keywords associated with the report?
Yes, the market keyword associated with the report is "Nuclear Power Simulation Software," which aids in identifying and referencing the specific market segment covered.
12. How do I determine which pricing option suits my needs best?
The pricing options vary based on user requirements and access needs. Individual users may opt for single-user licenses, while businesses requiring broader access may choose multi-user or enterprise licenses for cost-effective access to the report.
13. Are there any additional resources or data provided in the Nuclear Power Simulation Software report?
While the report offers comprehensive insights, it's advisable to review the specific contents or supplementary materials provided to ascertain if additional resources or data are available.
14. How can I stay updated on further developments or reports in the Nuclear Power Simulation Software?
To stay informed about further developments, trends, and reports in the Nuclear Power Simulation Software, consider subscribing to industry newsletters, following relevant companies and organizations, or regularly checking reputable industry news sources and publications.
Methodology
Step 1 - Identification of Relevant Samples Size from Population Database


Step 2 - Approaches for Defining Global Market Size (Value, Volume* & Price*)

Note*: In applicable scenarios
Step 3 - Data Sources
Primary Research
- Web Analytics
- Survey Reports
- Research Institute
- Latest Research Reports
- Opinion Leaders
Secondary Research
- Annual Reports
- White Paper
- Latest Press Release
- Industry Association
- Paid Database
- Investor Presentations

Step 4 - Data Triangulation
Involves using different sources of information in order to increase the validity of a study
These sources are likely to be stakeholders in a program - participants, other researchers, program staff, other community members, and so on.
Then we put all data in single framework & apply various statistical tools to find out the dynamic on the market.
During the analysis stage, feedback from the stakeholder groups would be compared to determine areas of agreement as well as areas of divergence
