

Key Insights
The Occupancy Sensor market is projected for substantial expansion, anticipated to reach $3.07 billion by 2025, driven by a compelling Compound Annual Growth Rate (CAGR) of 11.92%. This robust growth is underpinned by increasing demand for energy efficiency and automation in both residential and commercial environments. Key growth catalysts include the widespread adoption of smart building technologies and supportive government regulations focused on reducing energy consumption. Growing awareness of the economic and environmental advantages of optimized energy usage is also accelerating market penetration. The industry is observing a notable shift towards wireless sensor solutions, prized for their installation simplicity and adaptability, though wired systems retain a significant presence, particularly in new construction. Ultrasonic and Passive Infrared (PIR) technologies currently dominate, delivering reliable and cost-effective occupancy detection across a range of applications.
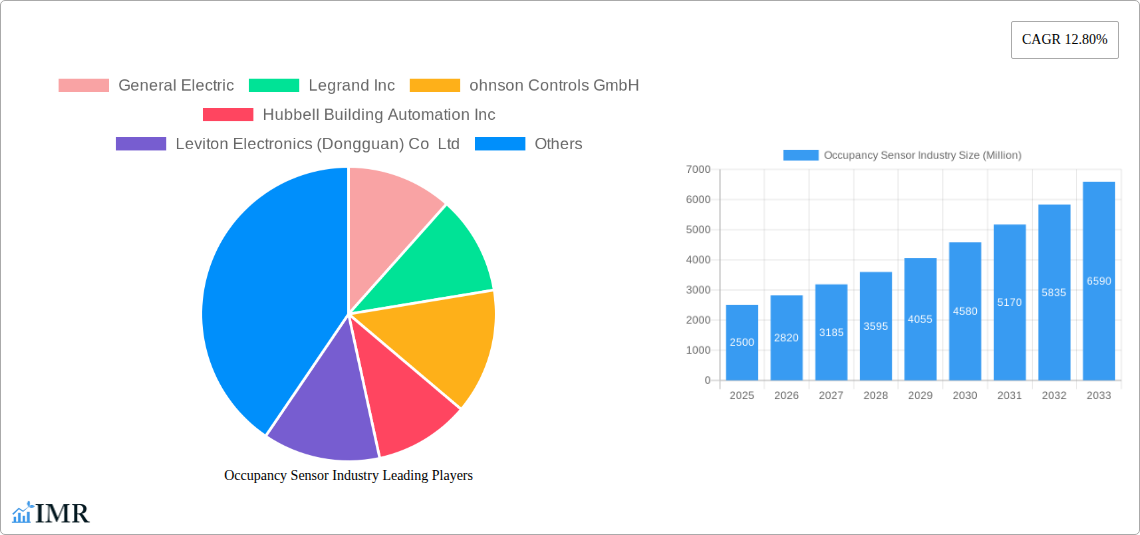
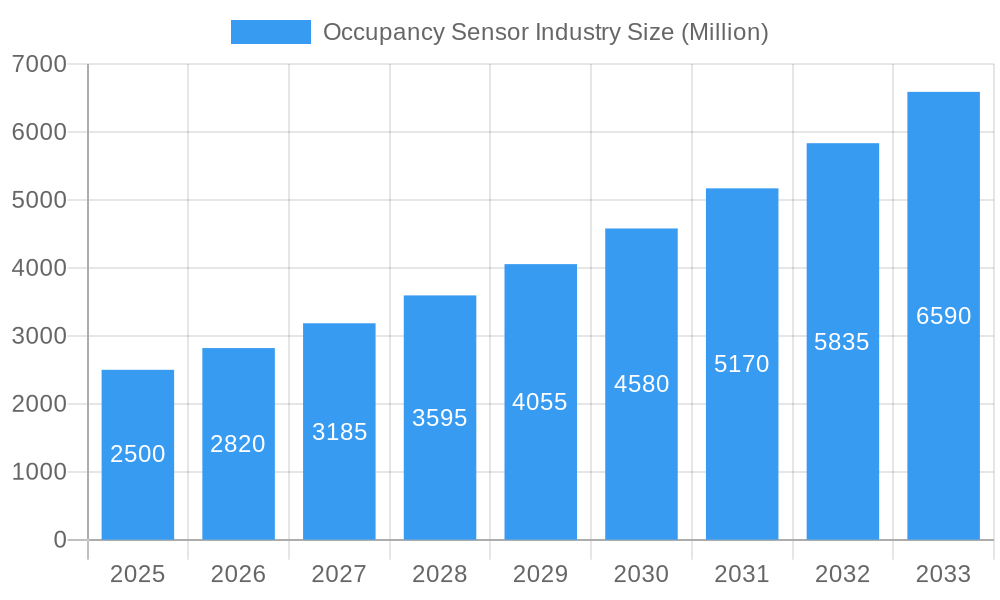
Occupancy Sensor Industry Market Size (In Billion)
The market is segmented by network type, technology, building type, and application, underscoring the broad applicability of occupancy sensors. Lighting control and HVAC management are the leading application segments, directly contributing to energy savings. Occupancy sensors are also increasingly integrated into security and surveillance systems as smart security solutions gain prominence. While North America and Europe currently lead in market adoption, driven by advanced smart building initiatives and regulatory environments, the Asia Pacific region is poised for the most rapid growth. This is attributed to swift urbanization, rising disposable incomes, and a heightened emphasis on sustainable development. Leading companies are actively investing in research and development to introduce novel sensor technologies, enhance connectivity, and broaden their product offerings to meet evolving market needs. Initial installation costs and data privacy concerns persist as challenges, but are expected to be addressed through technological innovation and increased consumer acceptance.
Occupancy Sensor Industry Company Market Share
Gain essential insights into the dynamic global Occupancy Sensor market. This comprehensive analysis offers a deep dive into market size, growth drivers, technological innovations, and competitive dynamics, crucial for stakeholders aiming to leverage the burgeoning smart building and IoT revolution. Explore detailed market segmentation by network type, technology, building type, and application, alongside critical industry advancements.
Occupancy Sensor Industry Market Dynamics & Structure
The global Occupancy Sensor market is characterized by moderate to high concentration, with a handful of key players holding significant market share. Technological innovation, particularly in AI integration and sensor accuracy, is a primary driver of market evolution. Regulatory frameworks mandating energy efficiency and building automation are also shaping adoption rates. Competitive product substitutes, such as manual timers and basic motion detectors, are gradually being phased out by more sophisticated occupancy sensing solutions. End-user demographics are shifting towards businesses and homeowners prioritizing energy savings, enhanced security, and improved occupant comfort and productivity. Merger and acquisition (M&A) trends are moderately active, with larger companies acquiring innovative startups to expand their product portfolios and technological capabilities.
- Market Concentration: Dominated by established players in building automation and electronics, but with increasing fragmentation due to niche innovators.
- Technological Innovation Drivers: AI for predictive analytics, enhanced privacy features, miniaturization of sensors, and seamless integration with IoT platforms.
- Regulatory Frameworks: Energy efficiency standards (e.g., ASHRAE 90.1), smart city initiatives, and building codes promoting automated systems.
- Competitive Product Substitutes: Manual controls, simple timers, basic PIR motion sensors with limited functionality.
- End-User Demographics: Growing demand from commercial real estate, educational institutions, healthcare facilities, and increasingly, the residential sector.
- M&A Trends: Strategic acquisitions focused on acquiring intellectual property in AI, data analytics, and advanced sensor technologies.
Occupancy Sensor Industry Growth Trends & Insights
The Occupancy Sensor market is poised for robust growth, projected to expand significantly over the forecast period. This expansion is fueled by a confluence of factors, including escalating energy efficiency mandates, the pervasive adoption of the Internet of Things (IoT) in smart buildings, and a heightened awareness of occupant comfort and productivity. Market penetration is rapidly increasing across both commercial and residential sectors as the tangible benefits of occupancy sensors—reduced energy consumption, optimized space utilization, and enhanced security—become more apparent. Technological disruptions, such as the integration of advanced artificial intelligence (AI) and machine learning algorithms, are enabling more sophisticated applications, moving beyond simple presence detection to intelligent space management and predictive analytics. Consumer behavior is shifting towards a greater acceptance and demand for automated and connected living and working environments. The market is witnessing a surge in demand for wireless occupancy sensors due to their ease of installation and flexibility, further accelerating adoption rates. The continuous evolution of sensor technologies, including improvements in accuracy, range, and the ability to distinguish between different types of activity, will continue to drive market expansion. The growing emphasis on sustainability and carbon footprint reduction across industries also acts as a significant tailwind for the occupancy sensor market.
Dominant Regions, Countries, or Segments in Occupancy Sensor Industry
North America currently leads the global Occupancy Sensor market, driven by strong government initiatives promoting energy efficiency, significant investments in smart city infrastructure, and a high rate of commercial building retrofitting. The United States, in particular, stands out due to stringent building codes and a mature market for building automation systems.
- Dominant Region: North America
- Key Countries: United States, Canada
Within the Network Type segment, Wireless occupancy sensors are experiencing the most rapid growth. Their ease of installation, flexibility, and lower upfront costs make them highly attractive for both new construction and retrofitting projects across various building types.
- Dominant Network Type: Wireless
- Key Drivers: Ease of installation, cost-effectiveness, compatibility with existing infrastructure, ability to support dynamic space utilization.
In terms of Technology, Passive Infrared (PIR) sensors continue to hold a significant market share due to their reliability and cost-effectiveness. However, Ultrasonic and Microwave technologies are gaining traction, especially in applications requiring higher accuracy and the ability to detect smaller movements or occupancy through obstacles. The integration of AI with these technologies is further enhancing their capabilities.
- Leading Technology: Passive Infrared (PIR) with growing adoption of Ultrasonic and Microwave.
- Emerging Trend: Fusion of multiple technologies and AI-powered analytics for enhanced accuracy and functionality.
The Commercial building sector is the largest consumer of occupancy sensors. This dominance is attributed to the substantial energy savings potential in large office spaces, retail environments, and public institutions, as well as the need for optimized facility management and enhanced security.
- Dominant Building Type: Commercial
- Key Drivers: Energy cost reduction, space utilization optimization, regulatory compliance, enhanced occupant experience.
The primary Application driving market growth is Lighting Control. Occupancy sensors automatically switch lights on when a space is occupied and off when it is vacant, leading to substantial energy savings. However, applications in HVAC control and Security and Surveillance are also experiencing significant growth as integrated smart building solutions become more prevalent.
- Dominant Application: Lighting Control
- Growing Applications: HVAC control, Security and Surveillance, Workplace analytics.
Occupancy Sensor Industry Product Landscape
The Occupancy Sensor market is characterized by a diverse product landscape featuring innovations in sensor accuracy, connectivity, and data analytics. Products range from standalone PIR sensors for basic lighting control to advanced wireless multi-sensor devices integrating ultrasonic, microwave, and thermal technologies for comprehensive space monitoring. These advanced sensors offer granular data on occupancy levels, movement patterns, and environmental conditions, enabling intelligent building management. Unique selling propositions often lie in seamless integration with existing building management systems (BMS) and IoT platforms, cloud-based data analytics for insights into space utilization, and enhanced privacy features for sensitive environments. Technological advancements focus on miniaturization, improved power efficiency, and the incorporation of edge AI for local data processing, reducing latency and bandwidth requirements.
Key Drivers, Barriers & Challenges in Occupancy Sensor Industry
Key Drivers:
- Energy Efficiency Mandates: Government regulations and corporate sustainability goals are pushing for reduced energy consumption in buildings, making occupancy sensors a vital tool for lighting and HVAC optimization.
- IoT and Smart Building Adoption: The widespread integration of IoT devices and the growth of smart building technologies create a natural demand for occupancy sensors to enable intelligent automation.
- Cost Savings: Significant operational cost reductions through energy savings and optimized facility management drive adoption across commercial sectors.
- Occupant Comfort and Productivity: Smart lighting and HVAC control based on occupancy enhances comfort levels and can indirectly boost productivity.
- Advancements in Sensor Technology: Miniaturization, increased accuracy, and multi-technology integration are making sensors more versatile and effective.
Barriers & Challenges:
- High Initial Investment: While long-term savings are evident, the upfront cost of advanced occupancy sensing systems can be a barrier for some smaller businesses and residential users.
- Installation Complexity and Integration: Integrating new sensor systems with legacy building infrastructure can be complex and require specialized expertise.
- Data Privacy Concerns: The collection of occupancy data raises privacy concerns, particularly in certain environments, necessitating robust data protection measures.
- False Triggering and Accuracy Limitations: Earlier generations of sensors sometimes suffered from false triggering due to pets or minor movements, leading to user frustration, though this is being addressed by advanced technologies.
- Lack of Awareness and Education: In some markets, there's still a need for greater awareness regarding the benefits and capabilities of modern occupancy sensing solutions.
Emerging Opportunities in Occupancy Sensor Industry
Emerging opportunities in the Occupancy Sensor industry lie in the expanding applications beyond traditional lighting control. The integration of AI with occupancy data is unlocking new possibilities for intelligent space management, enabling dynamic allocation of resources, optimizing cleaning schedules, and providing detailed workplace analytics for improved employee experience and operational efficiency. The burgeoning demand for smart homes and connected living spaces presents a significant opportunity in the residential sector, with sensors enhancing security, convenience, and energy management. Furthermore, the development of privacy-preserving occupancy sensing technologies catering to sensitive environments like healthcare and education will open new market segments. Untapped markets in developing economies, coupled with government push for sustainable infrastructure, represent considerable growth potential.
Growth Accelerators in the Occupancy Sensor Industry Industry
Several catalysts are accelerating the long-term growth of the Occupancy Sensor industry. Technological breakthroughs in AI and machine learning are transforming sensors from simple detection devices into intelligent analytics platforms. Strategic partnerships between sensor manufacturers, building automation providers, and software developers are creating integrated ecosystems that enhance functionality and user adoption. Market expansion strategies, including the development of more affordable and user-friendly solutions, are making occupancy sensors accessible to a wider range of customers. The increasing focus on circular economy principles and sustainability further bolsters demand for technologies that reduce energy waste and optimize resource utilization.
Key Players Shaping the Occupancy Sensor Industry Market
- General Electric
- Legrand Inc
- Johnson Controls GmbH
- Hubbell Building Automation Inc
- Leviton Electronics (Dongguan) Co Ltd
- Honeywell International
- Schneider Electric
- Texas Instruments Incorporated
- Pammvi Group
- Philips Ltd
- Lutron Electronics Inc
- Eaton Corporation
Notable Milestones in Occupancy Sensor Industry Sector
- June 2022: Butlr launched as an occupancy-sensing platform that captures the presence and movement of individuals within a space in real-time, stating that the data gathered by the platform can be utilized to revolutionize the workplace. Butlr's platform's spatial insights, occupancy, and activity analytics may be utilized to make data-driven real estate and design decisions, as well as to improve the tenant experience.
- April 2022: Lumentum Holdings Inc. and Ambarella Inc. have launched a new collaborative reference design for smart building applications that integrates edge artificial intelligence (AI) with privacy. This combination enables the deployment of small AIoT sensors with local processing throughout buildings for applications such as occupancy sensor systems, intelligent space management, and smart retail.
In-Depth Occupancy Sensor Industry Market Outlook
The future outlook for the Occupancy Sensor market is exceptionally bright, driven by a persistent global drive towards energy efficiency and the ubiquitous expansion of smart building technologies. Growth accelerators such as the integration of AI for advanced analytics, the development of edge computing for enhanced data privacy and real-time processing, and strategic collaborations across the value chain are expected to propel market expansion. Untapped potential in emerging economies and the continuous evolution of consumer preferences towards connected and automated living and working spaces further solidify the positive trajectory. The industry is poised for significant innovation, with a focus on developing more sophisticated, user-friendly, and cost-effective solutions that cater to an ever-widening array of applications.
Occupancy Sensor Industry Segmentation
-
1. Network Type
- 1.1. Wired
- 1.2. Wireless
-
2. Technology
- 2.1. Ultrasonic
- 2.2. Passive Infrared
- 2.3. Microwave
-
3. Building Type
- 3.1. Residential
- 3.2. Commercial
-
4. Application
- 4.1. Lighting Control
- 4.2. HVAC
- 4.3. Security and Surveillance
- 4.4. Other Applications
Occupancy Sensor Industry Segmentation By Geography
-
1. North America
- 1.1. United States
- 1.2. Canada
-
2. Europe
- 2.1. United Kingdom
- 2.2. France
- 2.3. Germany
- 2.4. Italy
- 2.5. Rest of Europe
-
3. Asia Pacific
- 3.1. China
- 3.2. Japan
- 3.3. South Korea
- 3.4. Australia
- 3.5. Rest of Asia Pacific
-
4. Latin America
- 4.1. Mexico
- 4.2. Rest of Latin America
- 5. Middle East and Africa
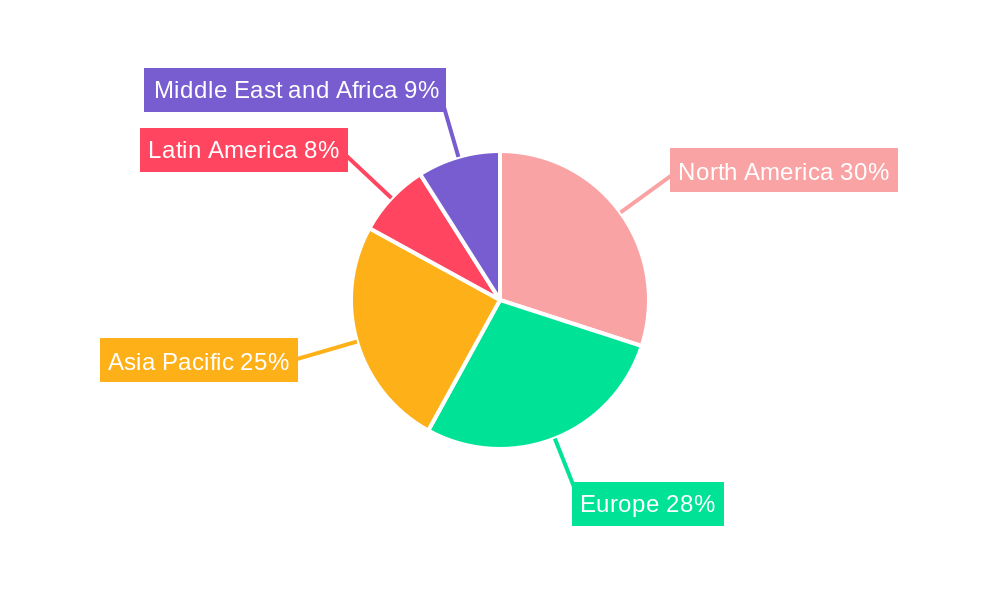
Occupancy Sensor Industry Regional Market Share
Geographic Coverage of Occupancy Sensor Industry
Occupancy Sensor Industry REPORT HIGHLIGHTS
| Aspects | Details |
|---|---|
| Study Period | 2020-2034 |
| Base Year | 2025 |
| Estimated Year | 2026 |
| Forecast Period | 2026-2034 |
| Historical Period | 2020-2025 |
| Growth Rate | CAGR of 11.92% from 2020-2034 |
| Segmentation |
|
Table of Contents
- 1. Introduction
- 1.1. Research Scope
- 1.2. Market Segmentation
- 1.3. Research Methodology
- 1.4. Definitions and Assumptions
- 2. Executive Summary
- 2.1. Introduction
- 3. Market Dynamics
- 3.1. Introduction
- 3.2. Market Drivers
- 3.2.1. Rising Demand for Energy-efficient Devices; Demand for Passive Infrared Due to Low Cost and High Energy Efficiency
- 3.3. Market Restrains
- 3.3.1. False Triggering of Switch and Inconsistency Issues Associated with Wireless Network Systems
- 3.4. Market Trends
- 3.4.1. Smart City to Increase the Growth of the Occupancy Sensor Market
- 4. Market Factor Analysis
- 4.1. Porters Five Forces
- 4.2. Supply/Value Chain
- 4.3. PESTEL analysis
- 4.4. Market Entropy
- 4.5. Patent/Trademark Analysis
- 5. Global Occupancy Sensor Industry Analysis, Insights and Forecast, 2020-2032
- 5.1. Market Analysis, Insights and Forecast - by Network Type
- 5.1.1. Wired
- 5.1.2. Wireless
- 5.2. Market Analysis, Insights and Forecast - by Technology
- 5.2.1. Ultrasonic
- 5.2.2. Passive Infrared
- 5.2.3. Microwave
- 5.3. Market Analysis, Insights and Forecast - by Building Type
- 5.3.1. Residential
- 5.3.2. Commercial
- 5.4. Market Analysis, Insights and Forecast - by Application
- 5.4.1. Lighting Control
- 5.4.2. HVAC
- 5.4.3. Security and Surveillance
- 5.4.4. Other Applications
- 5.5. Market Analysis, Insights and Forecast - by Region
- 5.5.1. North America
- 5.5.2. Europe
- 5.5.3. Asia Pacific
- 5.5.4. Latin America
- 5.5.5. Middle East and Africa
- 5.1. Market Analysis, Insights and Forecast - by Network Type
- 6. North America Occupancy Sensor Industry Analysis, Insights and Forecast, 2020-2032
- 6.1. Market Analysis, Insights and Forecast - by Network Type
- 6.1.1. Wired
- 6.1.2. Wireless
- 6.2. Market Analysis, Insights and Forecast - by Technology
- 6.2.1. Ultrasonic
- 6.2.2. Passive Infrared
- 6.2.3. Microwave
- 6.3. Market Analysis, Insights and Forecast - by Building Type
- 6.3.1. Residential
- 6.3.2. Commercial
- 6.4. Market Analysis, Insights and Forecast - by Application
- 6.4.1. Lighting Control
- 6.4.2. HVAC
- 6.4.3. Security and Surveillance
- 6.4.4. Other Applications
- 6.1. Market Analysis, Insights and Forecast - by Network Type
- 7. Europe Occupancy Sensor Industry Analysis, Insights and Forecast, 2020-2032
- 7.1. Market Analysis, Insights and Forecast - by Network Type
- 7.1.1. Wired
- 7.1.2. Wireless
- 7.2. Market Analysis, Insights and Forecast - by Technology
- 7.2.1. Ultrasonic
- 7.2.2. Passive Infrared
- 7.2.3. Microwave
- 7.3. Market Analysis, Insights and Forecast - by Building Type
- 7.3.1. Residential
- 7.3.2. Commercial
- 7.4. Market Analysis, Insights and Forecast - by Application
- 7.4.1. Lighting Control
- 7.4.2. HVAC
- 7.4.3. Security and Surveillance
- 7.4.4. Other Applications
- 7.1. Market Analysis, Insights and Forecast - by Network Type
- 8. Asia Pacific Occupancy Sensor Industry Analysis, Insights and Forecast, 2020-2032
- 8.1. Market Analysis, Insights and Forecast - by Network Type
- 8.1.1. Wired
- 8.1.2. Wireless
- 8.2. Market Analysis, Insights and Forecast - by Technology
- 8.2.1. Ultrasonic
- 8.2.2. Passive Infrared
- 8.2.3. Microwave
- 8.3. Market Analysis, Insights and Forecast - by Building Type
- 8.3.1. Residential
- 8.3.2. Commercial
- 8.4. Market Analysis, Insights and Forecast - by Application
- 8.4.1. Lighting Control
- 8.4.2. HVAC
- 8.4.3. Security and Surveillance
- 8.4.4. Other Applications
- 8.1. Market Analysis, Insights and Forecast - by Network Type
- 9. Latin America Occupancy Sensor Industry Analysis, Insights and Forecast, 2020-2032
- 9.1. Market Analysis, Insights and Forecast - by Network Type
- 9.1.1. Wired
- 9.1.2. Wireless
- 9.2. Market Analysis, Insights and Forecast - by Technology
- 9.2.1. Ultrasonic
- 9.2.2. Passive Infrared
- 9.2.3. Microwave
- 9.3. Market Analysis, Insights and Forecast - by Building Type
- 9.3.1. Residential
- 9.3.2. Commercial
- 9.4. Market Analysis, Insights and Forecast - by Application
- 9.4.1. Lighting Control
- 9.4.2. HVAC
- 9.4.3. Security and Surveillance
- 9.4.4. Other Applications
- 9.1. Market Analysis, Insights and Forecast - by Network Type
- 10. Middle East and Africa Occupancy Sensor Industry Analysis, Insights and Forecast, 2020-2032
- 10.1. Market Analysis, Insights and Forecast - by Network Type
- 10.1.1. Wired
- 10.1.2. Wireless
- 10.2. Market Analysis, Insights and Forecast - by Technology
- 10.2.1. Ultrasonic
- 10.2.2. Passive Infrared
- 10.2.3. Microwave
- 10.3. Market Analysis, Insights and Forecast - by Building Type
- 10.3.1. Residential
- 10.3.2. Commercial
- 10.4. Market Analysis, Insights and Forecast - by Application
- 10.4.1. Lighting Control
- 10.4.2. HVAC
- 10.4.3. Security and Surveillance
- 10.4.4. Other Applications
- 10.1. Market Analysis, Insights and Forecast - by Network Type
- 11. Competitive Analysis
- 11.1. Global Market Share Analysis 2025
- 11.2. Company Profiles
- 11.2.1 General Electric
- 11.2.1.1. Overview
- 11.2.1.2. Products
- 11.2.1.3. SWOT Analysis
- 11.2.1.4. Recent Developments
- 11.2.1.5. Financials (Based on Availability)
- 11.2.2 Legrand Inc
- 11.2.2.1. Overview
- 11.2.2.2. Products
- 11.2.2.3. SWOT Analysis
- 11.2.2.4. Recent Developments
- 11.2.2.5. Financials (Based on Availability)
- 11.2.3 ohnson Controls GmbH
- 11.2.3.1. Overview
- 11.2.3.2. Products
- 11.2.3.3. SWOT Analysis
- 11.2.3.4. Recent Developments
- 11.2.3.5. Financials (Based on Availability)
- 11.2.4 Hubbell Building Automation Inc
- 11.2.4.1. Overview
- 11.2.4.2. Products
- 11.2.4.3. SWOT Analysis
- 11.2.4.4. Recent Developments
- 11.2.4.5. Financials (Based on Availability)
- 11.2.5 Leviton Electronics (Dongguan) Co Ltd
- 11.2.5.1. Overview
- 11.2.5.2. Products
- 11.2.5.3. SWOT Analysis
- 11.2.5.4. Recent Developments
- 11.2.5.5. Financials (Based on Availability)
- 11.2.6 Honeywell International
- 11.2.6.1. Overview
- 11.2.6.2. Products
- 11.2.6.3. SWOT Analysis
- 11.2.6.4. Recent Developments
- 11.2.6.5. Financials (Based on Availability)
- 11.2.7 Schneider Electric
- 11.2.7.1. Overview
- 11.2.7.2. Products
- 11.2.7.3. SWOT Analysis
- 11.2.7.4. Recent Developments
- 11.2.7.5. Financials (Based on Availability)
- 11.2.8 Texas Instruments Incorporated*List Not Exhaustive
- 11.2.8.1. Overview
- 11.2.8.2. Products
- 11.2.8.3. SWOT Analysis
- 11.2.8.4. Recent Developments
- 11.2.8.5. Financials (Based on Availability)
- 11.2.9 Pammvi Group
- 11.2.9.1. Overview
- 11.2.9.2. Products
- 11.2.9.3. SWOT Analysis
- 11.2.9.4. Recent Developments
- 11.2.9.5. Financials (Based on Availability)
- 11.2.10 Philips Ltd
- 11.2.10.1. Overview
- 11.2.10.2. Products
- 11.2.10.3. SWOT Analysis
- 11.2.10.4. Recent Developments
- 11.2.10.5. Financials (Based on Availability)
- 11.2.11 Lutron Electronics Inc
- 11.2.11.1. Overview
- 11.2.11.2. Products
- 11.2.11.3. SWOT Analysis
- 11.2.11.4. Recent Developments
- 11.2.11.5. Financials (Based on Availability)
- 11.2.12 Eaton Corporation
- 11.2.12.1. Overview
- 11.2.12.2. Products
- 11.2.12.3. SWOT Analysis
- 11.2.12.4. Recent Developments
- 11.2.12.5. Financials (Based on Availability)
- 11.2.1 General Electric
List of Figures
- Figure 1: Global Occupancy Sensor Industry Revenue Breakdown (billion, %) by Region 2025 & 2033
- Figure 2: North America Occupancy Sensor Industry Revenue (billion), by Network Type 2025 & 2033
- Figure 3: North America Occupancy Sensor Industry Revenue Share (%), by Network Type 2025 & 2033
- Figure 4: North America Occupancy Sensor Industry Revenue (billion), by Technology 2025 & 2033
- Figure 5: North America Occupancy Sensor Industry Revenue Share (%), by Technology 2025 & 2033
- Figure 6: North America Occupancy Sensor Industry Revenue (billion), by Building Type 2025 & 2033
- Figure 7: North America Occupancy Sensor Industry Revenue Share (%), by Building Type 2025 & 2033
- Figure 8: North America Occupancy Sensor Industry Revenue (billion), by Application 2025 & 2033
- Figure 9: North America Occupancy Sensor Industry Revenue Share (%), by Application 2025 & 2033
- Figure 10: North America Occupancy Sensor Industry Revenue (billion), by Country 2025 & 2033
- Figure 11: North America Occupancy Sensor Industry Revenue Share (%), by Country 2025 & 2033
- Figure 12: Europe Occupancy Sensor Industry Revenue (billion), by Network Type 2025 & 2033
- Figure 13: Europe Occupancy Sensor Industry Revenue Share (%), by Network Type 2025 & 2033
- Figure 14: Europe Occupancy Sensor Industry Revenue (billion), by Technology 2025 & 2033
- Figure 15: Europe Occupancy Sensor Industry Revenue Share (%), by Technology 2025 & 2033
- Figure 16: Europe Occupancy Sensor Industry Revenue (billion), by Building Type 2025 & 2033
- Figure 17: Europe Occupancy Sensor Industry Revenue Share (%), by Building Type 2025 & 2033
- Figure 18: Europe Occupancy Sensor Industry Revenue (billion), by Application 2025 & 2033
- Figure 19: Europe Occupancy Sensor Industry Revenue Share (%), by Application 2025 & 2033
- Figure 20: Europe Occupancy Sensor Industry Revenue (billion), by Country 2025 & 2033
- Figure 21: Europe Occupancy Sensor Industry Revenue Share (%), by Country 2025 & 2033
- Figure 22: Asia Pacific Occupancy Sensor Industry Revenue (billion), by Network Type 2025 & 2033
- Figure 23: Asia Pacific Occupancy Sensor Industry Revenue Share (%), by Network Type 2025 & 2033
- Figure 24: Asia Pacific Occupancy Sensor Industry Revenue (billion), by Technology 2025 & 2033
- Figure 25: Asia Pacific Occupancy Sensor Industry Revenue Share (%), by Technology 2025 & 2033
- Figure 26: Asia Pacific Occupancy Sensor Industry Revenue (billion), by Building Type 2025 & 2033
- Figure 27: Asia Pacific Occupancy Sensor Industry Revenue Share (%), by Building Type 2025 & 2033
- Figure 28: Asia Pacific Occupancy Sensor Industry Revenue (billion), by Application 2025 & 2033
- Figure 29: Asia Pacific Occupancy Sensor Industry Revenue Share (%), by Application 2025 & 2033
- Figure 30: Asia Pacific Occupancy Sensor Industry Revenue (billion), by Country 2025 & 2033
- Figure 31: Asia Pacific Occupancy Sensor Industry Revenue Share (%), by Country 2025 & 2033
- Figure 32: Latin America Occupancy Sensor Industry Revenue (billion), by Network Type 2025 & 2033
- Figure 33: Latin America Occupancy Sensor Industry Revenue Share (%), by Network Type 2025 & 2033
- Figure 34: Latin America Occupancy Sensor Industry Revenue (billion), by Technology 2025 & 2033
- Figure 35: Latin America Occupancy Sensor Industry Revenue Share (%), by Technology 2025 & 2033
- Figure 36: Latin America Occupancy Sensor Industry Revenue (billion), by Building Type 2025 & 2033
- Figure 37: Latin America Occupancy Sensor Industry Revenue Share (%), by Building Type 2025 & 2033
- Figure 38: Latin America Occupancy Sensor Industry Revenue (billion), by Application 2025 & 2033
- Figure 39: Latin America Occupancy Sensor Industry Revenue Share (%), by Application 2025 & 2033
- Figure 40: Latin America Occupancy Sensor Industry Revenue (billion), by Country 2025 & 2033
- Figure 41: Latin America Occupancy Sensor Industry Revenue Share (%), by Country 2025 & 2033
- Figure 42: Middle East and Africa Occupancy Sensor Industry Revenue (billion), by Network Type 2025 & 2033
- Figure 43: Middle East and Africa Occupancy Sensor Industry Revenue Share (%), by Network Type 2025 & 2033
- Figure 44: Middle East and Africa Occupancy Sensor Industry Revenue (billion), by Technology 2025 & 2033
- Figure 45: Middle East and Africa Occupancy Sensor Industry Revenue Share (%), by Technology 2025 & 2033
- Figure 46: Middle East and Africa Occupancy Sensor Industry Revenue (billion), by Building Type 2025 & 2033
- Figure 47: Middle East and Africa Occupancy Sensor Industry Revenue Share (%), by Building Type 2025 & 2033
- Figure 48: Middle East and Africa Occupancy Sensor Industry Revenue (billion), by Application 2025 & 2033
- Figure 49: Middle East and Africa Occupancy Sensor Industry Revenue Share (%), by Application 2025 & 2033
- Figure 50: Middle East and Africa Occupancy Sensor Industry Revenue (billion), by Country 2025 & 2033
- Figure 51: Middle East and Africa Occupancy Sensor Industry Revenue Share (%), by Country 2025 & 2033
List of Tables
- Table 1: Global Occupancy Sensor Industry Revenue billion Forecast, by Network Type 2020 & 2033
- Table 2: Global Occupancy Sensor Industry Revenue billion Forecast, by Technology 2020 & 2033
- Table 3: Global Occupancy Sensor Industry Revenue billion Forecast, by Building Type 2020 & 2033
- Table 4: Global Occupancy Sensor Industry Revenue billion Forecast, by Application 2020 & 2033
- Table 5: Global Occupancy Sensor Industry Revenue billion Forecast, by Region 2020 & 2033
- Table 6: Global Occupancy Sensor Industry Revenue billion Forecast, by Network Type 2020 & 2033
- Table 7: Global Occupancy Sensor Industry Revenue billion Forecast, by Technology 2020 & 2033
- Table 8: Global Occupancy Sensor Industry Revenue billion Forecast, by Building Type 2020 & 2033
- Table 9: Global Occupancy Sensor Industry Revenue billion Forecast, by Application 2020 & 2033
- Table 10: Global Occupancy Sensor Industry Revenue billion Forecast, by Country 2020 & 2033
- Table 11: United States Occupancy Sensor Industry Revenue (billion) Forecast, by Application 2020 & 2033
- Table 12: Canada Occupancy Sensor Industry Revenue (billion) Forecast, by Application 2020 & 2033
- Table 13: Global Occupancy Sensor Industry Revenue billion Forecast, by Network Type 2020 & 2033
- Table 14: Global Occupancy Sensor Industry Revenue billion Forecast, by Technology 2020 & 2033
- Table 15: Global Occupancy Sensor Industry Revenue billion Forecast, by Building Type 2020 & 2033
- Table 16: Global Occupancy Sensor Industry Revenue billion Forecast, by Application 2020 & 2033
- Table 17: Global Occupancy Sensor Industry Revenue billion Forecast, by Country 2020 & 2033
- Table 18: United Kingdom Occupancy Sensor Industry Revenue (billion) Forecast, by Application 2020 & 2033
- Table 19: France Occupancy Sensor Industry Revenue (billion) Forecast, by Application 2020 & 2033
- Table 20: Germany Occupancy Sensor Industry Revenue (billion) Forecast, by Application 2020 & 2033
- Table 21: Italy Occupancy Sensor Industry Revenue (billion) Forecast, by Application 2020 & 2033
- Table 22: Rest of Europe Occupancy Sensor Industry Revenue (billion) Forecast, by Application 2020 & 2033
- Table 23: Global Occupancy Sensor Industry Revenue billion Forecast, by Network Type 2020 & 2033
- Table 24: Global Occupancy Sensor Industry Revenue billion Forecast, by Technology 2020 & 2033
- Table 25: Global Occupancy Sensor Industry Revenue billion Forecast, by Building Type 2020 & 2033
- Table 26: Global Occupancy Sensor Industry Revenue billion Forecast, by Application 2020 & 2033
- Table 27: Global Occupancy Sensor Industry Revenue billion Forecast, by Country 2020 & 2033
- Table 28: China Occupancy Sensor Industry Revenue (billion) Forecast, by Application 2020 & 2033
- Table 29: Japan Occupancy Sensor Industry Revenue (billion) Forecast, by Application 2020 & 2033
- Table 30: South Korea Occupancy Sensor Industry Revenue (billion) Forecast, by Application 2020 & 2033
- Table 31: Australia Occupancy Sensor Industry Revenue (billion) Forecast, by Application 2020 & 2033
- Table 32: Rest of Asia Pacific Occupancy Sensor Industry Revenue (billion) Forecast, by Application 2020 & 2033
- Table 33: Global Occupancy Sensor Industry Revenue billion Forecast, by Network Type 2020 & 2033
- Table 34: Global Occupancy Sensor Industry Revenue billion Forecast, by Technology 2020 & 2033
- Table 35: Global Occupancy Sensor Industry Revenue billion Forecast, by Building Type 2020 & 2033
- Table 36: Global Occupancy Sensor Industry Revenue billion Forecast, by Application 2020 & 2033
- Table 37: Global Occupancy Sensor Industry Revenue billion Forecast, by Country 2020 & 2033
- Table 38: Mexico Occupancy Sensor Industry Revenue (billion) Forecast, by Application 2020 & 2033
- Table 39: Rest of Latin America Occupancy Sensor Industry Revenue (billion) Forecast, by Application 2020 & 2033
- Table 40: Global Occupancy Sensor Industry Revenue billion Forecast, by Network Type 2020 & 2033
- Table 41: Global Occupancy Sensor Industry Revenue billion Forecast, by Technology 2020 & 2033
- Table 42: Global Occupancy Sensor Industry Revenue billion Forecast, by Building Type 2020 & 2033
- Table 43: Global Occupancy Sensor Industry Revenue billion Forecast, by Application 2020 & 2033
- Table 44: Global Occupancy Sensor Industry Revenue billion Forecast, by Country 2020 & 2033
Frequently Asked Questions
1. What is the projected Compound Annual Growth Rate (CAGR) of the Occupancy Sensor Industry?
The projected CAGR is approximately 11.92%.
2. Which companies are prominent players in the Occupancy Sensor Industry?
Key companies in the market include General Electric, Legrand Inc, ohnson Controls GmbH, Hubbell Building Automation Inc, Leviton Electronics (Dongguan) Co Ltd, Honeywell International, Schneider Electric, Texas Instruments Incorporated*List Not Exhaustive, Pammvi Group, Philips Ltd, Lutron Electronics Inc, Eaton Corporation.
3. What are the main segments of the Occupancy Sensor Industry?
The market segments include Network Type, Technology, Building Type, Application.
4. Can you provide details about the market size?
The market size is estimated to be USD 3.07 billion as of 2022.
5. What are some drivers contributing to market growth?
Rising Demand for Energy-efficient Devices; Demand for Passive Infrared Due to Low Cost and High Energy Efficiency.
6. What are the notable trends driving market growth?
Smart City to Increase the Growth of the Occupancy Sensor Market.
7. Are there any restraints impacting market growth?
False Triggering of Switch and Inconsistency Issues Associated with Wireless Network Systems.
8. Can you provide examples of recent developments in the market?
June 2022 - Butlr launched as an occupancy-sensing platform that captures the presence and movement of individuals within a space in real-time, stating that the data gathered by the platform can be utilized to revolutionize the workplace. Butlr's platform's spatial insights, occupancy, and activity analytics may be utilized to make data-driven real estate and design decisions, as well as to improve the tenant experience.
9. What pricing options are available for accessing the report?
Pricing options include single-user, multi-user, and enterprise licenses priced at USD 4750, USD 5250, and USD 8750 respectively.
10. Is the market size provided in terms of value or volume?
The market size is provided in terms of value, measured in billion.
11. Are there any specific market keywords associated with the report?
Yes, the market keyword associated with the report is "Occupancy Sensor Industry," which aids in identifying and referencing the specific market segment covered.
12. How do I determine which pricing option suits my needs best?
The pricing options vary based on user requirements and access needs. Individual users may opt for single-user licenses, while businesses requiring broader access may choose multi-user or enterprise licenses for cost-effective access to the report.
13. Are there any additional resources or data provided in the Occupancy Sensor Industry report?
While the report offers comprehensive insights, it's advisable to review the specific contents or supplementary materials provided to ascertain if additional resources or data are available.
14. How can I stay updated on further developments or reports in the Occupancy Sensor Industry?
To stay informed about further developments, trends, and reports in the Occupancy Sensor Industry, consider subscribing to industry newsletters, following relevant companies and organizations, or regularly checking reputable industry news sources and publications.
Methodology
Step 1 - Identification of Relevant Samples Size from Population Database


Step 2 - Approaches for Defining Global Market Size (Value, Volume* & Price*)

Note*: In applicable scenarios
Step 3 - Data Sources
Primary Research
- Web Analytics
- Survey Reports
- Research Institute
- Latest Research Reports
- Opinion Leaders
Secondary Research
- Annual Reports
- White Paper
- Latest Press Release
- Industry Association
- Paid Database
- Investor Presentations

Step 4 - Data Triangulation
Involves using different sources of information in order to increase the validity of a study
These sources are likely to be stakeholders in a program - participants, other researchers, program staff, other community members, and so on.
Then we put all data in single framework & apply various statistical tools to find out the dynamic on the market.
During the analysis stage, feedback from the stakeholder groups would be compared to determine areas of agreement as well as areas of divergence