

Key Insights
The Network Automation Solution Industry is poised for remarkable expansion, with a current market size of $25.16 million and a projected CAGR of 23.16% through 2033. This robust growth is fueled by the increasing complexity of modern IT infrastructures, the escalating demand for operational efficiency, and the critical need to reduce human error in network management. Key drivers include the burgeoning adoption of Software-Defined Networking (SDN) and Network Function Virtualization (NFV), which inherently support automated provisioning and management. Furthermore, the widespread integration of AI and machine learning into network operations is enabling predictive maintenance, proactive issue resolution, and more intelligent traffic management. Organizations are increasingly recognizing that network automation is no longer a luxury but a necessity for maintaining agility, enhancing security, and delivering seamless user experiences in today's dynamic digital landscape.
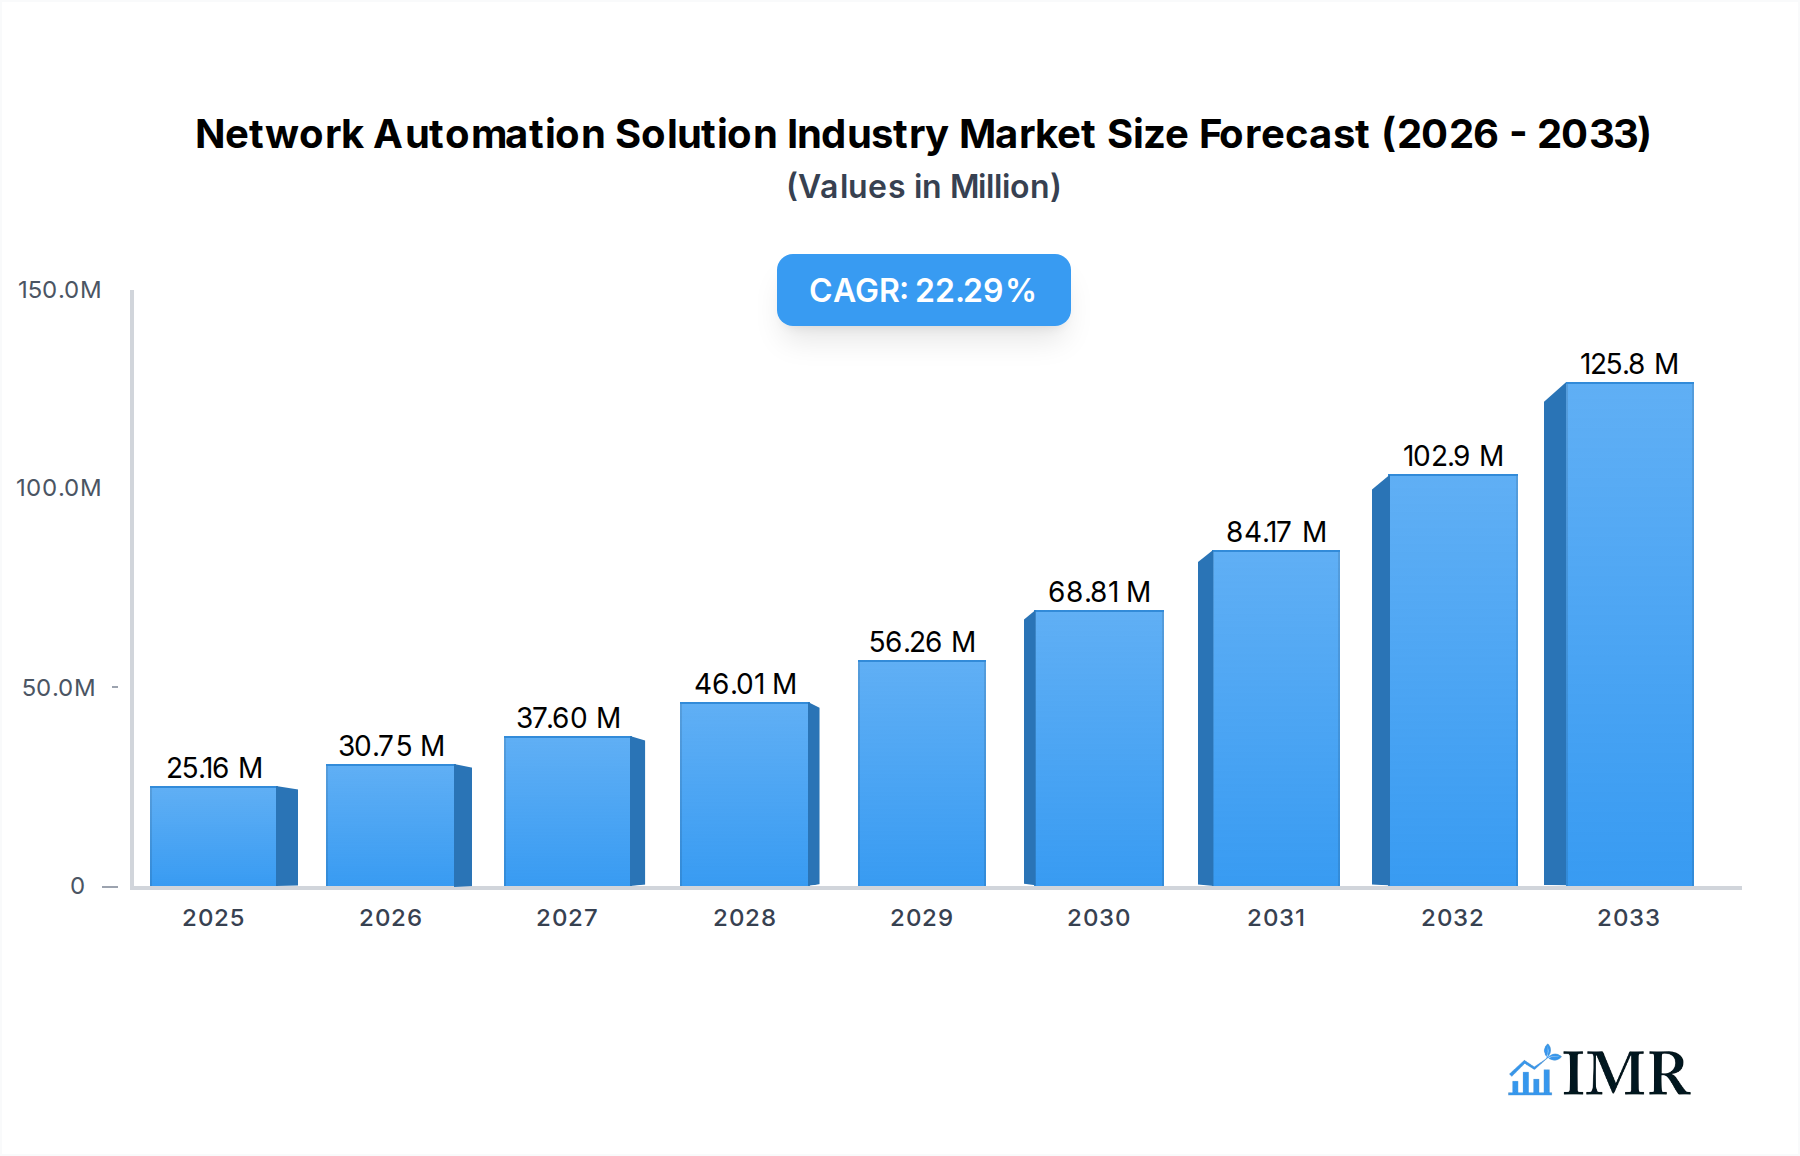
Network Automation Solution Industry Market Size (In Million)
The industry's trajectory is further shaped by significant trends such as the rise of intent-based networking (IBN), which allows for the expression of business intent that the network can then autonomously translate into configurations. This shift from command-line interfaces to policy-driven automation is a pivotal development. Managed and professional services are also seeing substantial growth as businesses seek expertise to design, implement, and manage their automation strategies effectively. While the benefits are clear, potential restraints include the initial investment cost for comprehensive automation solutions, the challenge of integrating legacy systems, and the ongoing need for skilled personnel to manage and evolve these sophisticated platforms. However, the overwhelming advantages in terms of cost savings, improved network performance, and enhanced security are compelling organizations across various end-user industries to prioritize network automation.

Network Automation Solution Industry Company Market Share
This comprehensive report delves into the dynamic Network Automation Solution Industry, providing an in-depth analysis of market trends, growth drivers, and future outlook from 2019 to 2033. With a base year of 2025 and a forecast period extending to 2033, this study offers critical insights for industry professionals seeking to understand the market's evolution and capitalize on emerging opportunities.
Network Automation Solution Industry Market Dynamics & Structure
The global Network Automation Solution Industry is characterized by a moderately concentrated market structure, driven by significant technological innovation and an evolving regulatory landscape. Key players like Cisco Systems Inc., IBM Corporation, and Hewlett Packard Enterprise Company are investing heavily in research and development to enhance their offerings, fueling advancements in areas such as AI-driven network management and intent-based networking. The competitive product substitute landscape includes traditional network management tools and manual configuration methods, but the superior efficiency and scalability of automation solutions are increasingly displacing these. End-user demographics are shifting towards a greater demand for agility and cost-efficiency, particularly within the IT and Telecom sector. Merger and acquisition (M&A) activities are moderately prevalent, with companies strategically acquiring innovative startups to expand their portfolios and market reach. For instance, there were an estimated 15 M&A deals in the historical period (2019-2024) valued at over $500 million collectively. Innovation barriers, such as the complexity of legacy systems and the need for specialized skillsets, are being addressed through partnerships and enhanced training programs.
- Market Concentration: Moderately concentrated, with top 5 players holding an estimated 45% of the market share.
- Technological Innovation Drivers: AI/ML integration, SDN, NFV, Cloud-native architectures.
- Regulatory Frameworks: Growing emphasis on data security and privacy, influencing compliance features.
- Competitive Product Substitutes: Manual configuration, legacy network management systems.
- End-User Demographics: Growing demand from SMEs and large enterprises across all sectors.
- M&A Trends: Strategic acquisitions to gain access to new technologies and markets.
Network Automation Solution Industry Growth Trends & Insights
The Network Automation Solution Industry is poised for significant expansion, projected to grow at a Compound Annual Growth Rate (CAGR) of approximately 15% from 2025 to 2033. This robust growth trajectory is underpinned by escalating adoption rates driven by the digital transformation initiatives across enterprises and the increasing complexity of modern network infrastructures. Technological disruptions, including the advent of 5G, edge computing, and the Internet of Things (IoT), are creating unprecedented demands for scalable, resilient, and highly automated network operations. These advancements necessitate sophisticated automation solutions to manage the sheer volume and velocity of data, ensure low latency, and maintain optimal performance. Consumer behavior shifts are characterized by a heightened expectation for seamless, always-on connectivity and self-healing network capabilities, pushing vendors to deliver solutions that are proactive rather than reactive. The market penetration of network automation solutions, currently estimated at 35% in 2025, is expected to reach over 60% by 2033. The global market size is anticipated to grow from an estimated $15 billion in 2025 to over $40 billion by 2033. Key performance indicators such as Mean Time to Repair (MTTR) reduction of up to 70% and operational cost savings of 25-40% are compelling enterprises to invest in automation.
Dominant Regions, Countries, or Segments in Network Automation Solution Industry
North America currently dominates the Network Automation Solution Industry, driven by a strong ecosystem of technology providers, a high adoption rate of advanced networking technologies, and significant investments in digital transformation by its end-user industries. The IT and Telecom sector within North America contributes an estimated 30% to the region's market share, followed closely by Banking and Financial Services and Manufacturing.
Leading Segment - Component: Solution Type: Within the component segment, Network Automation Tools are leading the market, accounting for an estimated 40% of the market share in 2025. This is followed by SD-WAN and Network Virtualization (30%) and Intent-based Networking (30%). The demand for intelligent, self-optimizing networks is fueling the growth of intent-based networking solutions.
Dominant Region - North America:
- Key Drivers: Robust digital infrastructure, high spending on IT and telecom services, presence of major technology vendors, and government initiatives supporting digital innovation.
- Market Share: Estimated at 40% of the global market in 2025.
- Growth Potential: Continued strong growth due to ongoing 5G deployments and the increasing adoption of cloud services.
Dominant Deployment - Cloud: Cloud deployment models are gaining significant traction, accounting for an estimated 55% of the market in 2025, due to their scalability, flexibility, and cost-effectiveness.
Dominant End-user Industry - IT and Telecom:
- Key Drivers: Rapid evolution of network technologies, need for efficient management of complex infrastructures, and the increasing demand for high-speed connectivity.
- Market Share: Estimated at 30% of the global market in 2025.
- Growth Potential: Continued expansion with the rollout of 5G, edge computing, and enterprise cloud adoption.
Dominant Network Type - Hybrid: Hybrid network types, combining physical and virtual elements, represent the largest segment due to the existing infrastructure of many organizations.
Network Automation Solution Industry Product Landscape
The product landscape in the Network Automation Solution Industry is rapidly evolving, with a strong focus on AI-powered analytics, predictive maintenance, and self-healing capabilities. Companies are increasingly offering integrated platforms that provide end-to-end network visibility and control, from physical infrastructure to application performance. Unique selling propositions often revolve around simplified deployment, enhanced security features, and seamless integration with existing IT ecosystems. Technological advancements are enabling solutions that can autonomously detect, diagnose, and resolve network issues, significantly reducing downtime and operational costs. For instance, new offerings are providing automated configuration compliance and security policy enforcement, crucial for highly regulated industries.
Key Drivers, Barriers & Challenges in Network Automation Solution Industry
Key Drivers: The network automation solution industry is propelled by several key factors. The escalating complexity of modern networks, driven by the proliferation of IoT devices and cloud adoption, necessitates automated management. The imperative for enhanced operational efficiency and cost reduction fuels the demand for automation. Furthermore, the growing need for improved network performance, agility, and resilience in the face of increasing cyber threats acts as a significant driver.
Barriers & Challenges: Despite the strong growth, the industry faces several barriers and challenges. The significant upfront investment required for implementing sophisticated automation solutions can be a deterrent for smaller enterprises. The lack of skilled personnel capable of managing and leveraging these advanced technologies is a persistent challenge. Integration complexities with legacy IT infrastructure and concerns around data security and privacy during automation processes also pose considerable hurdles. Supply chain disruptions for critical hardware components can also impact deployment timelines, with an estimated impact of 10-15% on project completion for certain solutions.
Emerging Opportunities in Network Automation Solution Industry
Emerging opportunities in the Network Automation Solution Industry are plentiful, particularly in the integration of AI and machine learning for predictive network analytics and proactive issue resolution. The burgeoning adoption of edge computing and the expansion of 5G networks present a significant market for localized, intelligent network automation. Furthermore, the increasing focus on sustainability and energy efficiency in data centers is driving demand for automation solutions that can optimize resource utilization and reduce power consumption. The development of more user-friendly, low-code/no-code automation platforms is also opening up the market to a wider range of users and applications.
Growth Accelerators in the Network Automation Solution Industry Industry
Several catalysts are accelerating long-term growth in the Network Automation Solution Industry. Technological breakthroughs in areas like programmable networks and software-defined everything (SDx) are foundational. Strategic partnerships between network hardware vendors, software providers, and cloud service providers are crucial for creating comprehensive, end-to-end automation solutions. Market expansion into emerging economies, driven by increasing digitalization and the adoption of advanced network infrastructure, represents a significant growth avenue. The continuous evolution of cloud-native architectures and microservices further enables scalable and agile network automation.
Key Players Shaping the Network Automation Solution Industry Market
- AppViewX Inc.
- IBM Corporation
- Nuage Networks (Nokia Corporation)
- Arista Networks Inc.
- Hewlett Packard Enterprise Company
- Cisco Systems Inc.
- Broadcom Inc.
- Fujitsu Limited
- Juniper Networks Inc.
- BMC Software Inc.
- Extreme Networks Inc.
- NetBrain Technologies Inc.
- Forward Networks Inc.
- Solarwinds Corporation
- Open Text Corporation
- Fortra LLC
Notable Milestones in Network Automation Solution Industry Sector
- March 2024: Arista announced a new network observability software, Arista’s CloudVision Universal Network Observability™ (CV UNOTM) system, enhancing network automation and visibility across data centers, campuses, and wide-area networks.
- March 2024: Nokia enhanced its WaveSuite optical network automation platform, offering improved bandwidth, reliability, and latency management, with expanded applications for network optimization and monetization.
In-Depth Network Automation Solution Industry Market Outlook
The future outlook for the Network Automation Solution Industry is exceptionally strong, driven by the sustained digital transformation across all sectors. Growth accelerators, including the pervasive integration of AI/ML, the widespread adoption of 5G and edge computing, and the increasing reliance on cloud services, will continue to shape the market. Strategic partnerships and market expansion into underserved regions will further fuel this growth. The industry is set to witness a paradigm shift towards fully autonomous networks, where automation plays a pivotal role in ensuring efficiency, security, and unparalleled user experience. The estimated market potential by 2033 is substantial, offering significant strategic opportunities for innovation and market leadership.
Network Automation Solution Industry Segmentation
-
1. Network Type
- 1.1. Physical
- 1.2. Virtual
- 1.3. Hybrid
-
2. Component
-
2.1. Solution Type
- 2.1.1. Network Automation Tools
- 2.1.2. SD-WAN and Network Virtualization
- 2.1.3. Intent-based Networking
-
2.2. Service Type
- 2.2.1. Managed Service
- 2.2.2. Professional Service
-
2.1. Solution Type
-
3. Deployment
- 3.1. Cloud
- 3.2. On-premise
- 3.3. Hybrid
-
4. End-user Industry
- 4.1. IT and Telecom
- 4.2. Manufacturing
- 4.3. Energy and Utility
- 4.4. Banking and Financial Services
- 4.5. Education
- 4.6. Other End-user Industries
Network Automation Solution Industry Segmentation By Geography
- 1. North America
- 2. Europe
- 3. Asia
- 4. Australia and New Zealand
- 5. Latin America
- 6. Middle East and Africa

Network Automation Solution Industry Regional Market Share
Geographic Coverage of Network Automation Solution Industry
Network Automation Solution Industry REPORT HIGHLIGHTS
| Aspects | Details |
|---|---|
| Study Period | 2020-2034 |
| Base Year | 2025 |
| Estimated Year | 2026 |
| Forecast Period | 2026-2034 |
| Historical Period | 2020-2025 |
| Growth Rate | CAGR of 23.16% from 2020-2034 |
| Segmentation |
|
Table of Contents
- 1. Introduction
- 1.1. Research Scope
- 1.2. Market Segmentation
- 1.3. Research Objective
- 1.4. Definitions and Assumptions
- 2. Executive Summary
- 2.1. Market Snapshot
- 3. Market Dynamics
- 3.1. Market Drivers
- 3.2. Market Restrains
- 3.3. Market Trends
- 3.4. Market Opportunities
- 4. Market Factor Analysis
- 4.1. Porters Five Forces
- 4.1.1. Bargaining Power of Suppliers
- 4.1.2. Bargaining Power of Buyers
- 4.1.3. Threat of New Entrants
- 4.1.4. Threat of Substitutes
- 4.1.5. Competitive Rivalry
- 4.2. PESTEL analysis
- 4.3. BCG Analysis
- 4.3.1. Stars (High Growth, High Market Share)
- 4.3.2. Cash Cows (Low Growth, High Market Share)
- 4.3.3. Question Mark (High Growth, Low Market Share)
- 4.3.4. Dogs (Low Growth, Low Market Share)
- 4.4. Ansoff Matrix Analysis
- 4.5. Supply Chain Analysis
- 4.6. Regulatory Landscape
- 4.7. Current Market Potential and Opportunity Assessment (TAM–SAM–SOM Framework)
- 4.8. IMR Analyst Note
- 4.1. Porters Five Forces
- 5. Market Analysis, Insights and Forecast 2021-2033
- 5.1. Market Analysis, Insights and Forecast - by Network Type
- 5.1.1. Physical
- 5.1.2. Virtual
- 5.1.3. Hybrid
- 5.2. Market Analysis, Insights and Forecast - by Component
- 5.2.1. Solution Type
- 5.2.1.1. Network Automation Tools
- 5.2.1.2. SD-WAN and Network Virtualization
- 5.2.1.3. Intent-based Networking
- 5.2.2. Service Type
- 5.2.2.1. Managed Service
- 5.2.2.2. Professional Service
- 5.2.1. Solution Type
- 5.3. Market Analysis, Insights and Forecast - by Deployment
- 5.3.1. Cloud
- 5.3.2. On-premise
- 5.3.3. Hybrid
- 5.4. Market Analysis, Insights and Forecast - by End-user Industry
- 5.4.1. IT and Telecom
- 5.4.2. Manufacturing
- 5.4.3. Energy and Utility
- 5.4.4. Banking and Financial Services
- 5.4.5. Education
- 5.4.6. Other End-user Industries
- 5.5. Market Analysis, Insights and Forecast - by Region
- 5.5.1. North America
- 5.5.2. Europe
- 5.5.3. Asia
- 5.5.4. Australia and New Zealand
- 5.5.5. Latin America
- 5.5.6. Middle East and Africa
- 5.1. Market Analysis, Insights and Forecast - by Network Type
- 6. Global Network Automation Solution Industry Analysis, Insights and Forecast, 2021-2033
- 6.1. Market Analysis, Insights and Forecast - by Network Type
- 6.1.1. Physical
- 6.1.2. Virtual
- 6.1.3. Hybrid
- 6.2. Market Analysis, Insights and Forecast - by Component
- 6.2.1. Solution Type
- 6.2.1.1. Network Automation Tools
- 6.2.1.2. SD-WAN and Network Virtualization
- 6.2.1.3. Intent-based Networking
- 6.2.2. Service Type
- 6.2.2.1. Managed Service
- 6.2.2.2. Professional Service
- 6.2.1. Solution Type
- 6.3. Market Analysis, Insights and Forecast - by Deployment
- 6.3.1. Cloud
- 6.3.2. On-premise
- 6.3.3. Hybrid
- 6.4. Market Analysis, Insights and Forecast - by End-user Industry
- 6.4.1. IT and Telecom
- 6.4.2. Manufacturing
- 6.4.3. Energy and Utility
- 6.4.4. Banking and Financial Services
- 6.4.5. Education
- 6.4.6. Other End-user Industries
- 6.1. Market Analysis, Insights and Forecast - by Network Type
- 7. North America Network Automation Solution Industry Analysis, Insights and Forecast, 2020-2032
- 7.1. Market Analysis, Insights and Forecast - by Network Type
- 7.1.1. Physical
- 7.1.2. Virtual
- 7.1.3. Hybrid
- 7.2. Market Analysis, Insights and Forecast - by Component
- 7.2.1. Solution Type
- 7.2.1.1. Network Automation Tools
- 7.2.1.2. SD-WAN and Network Virtualization
- 7.2.1.3. Intent-based Networking
- 7.2.2. Service Type
- 7.2.2.1. Managed Service
- 7.2.2.2. Professional Service
- 7.2.1. Solution Type
- 7.3. Market Analysis, Insights and Forecast - by Deployment
- 7.3.1. Cloud
- 7.3.2. On-premise
- 7.3.3. Hybrid
- 7.4. Market Analysis, Insights and Forecast - by End-user Industry
- 7.4.1. IT and Telecom
- 7.4.2. Manufacturing
- 7.4.3. Energy and Utility
- 7.4.4. Banking and Financial Services
- 7.4.5. Education
- 7.4.6. Other End-user Industries
- 7.1. Market Analysis, Insights and Forecast - by Network Type
- 8. Europe Network Automation Solution Industry Analysis, Insights and Forecast, 2020-2032
- 8.1. Market Analysis, Insights and Forecast - by Network Type
- 8.1.1. Physical
- 8.1.2. Virtual
- 8.1.3. Hybrid
- 8.2. Market Analysis, Insights and Forecast - by Component
- 8.2.1. Solution Type
- 8.2.1.1. Network Automation Tools
- 8.2.1.2. SD-WAN and Network Virtualization
- 8.2.1.3. Intent-based Networking
- 8.2.2. Service Type
- 8.2.2.1. Managed Service
- 8.2.2.2. Professional Service
- 8.2.1. Solution Type
- 8.3. Market Analysis, Insights and Forecast - by Deployment
- 8.3.1. Cloud
- 8.3.2. On-premise
- 8.3.3. Hybrid
- 8.4. Market Analysis, Insights and Forecast - by End-user Industry
- 8.4.1. IT and Telecom
- 8.4.2. Manufacturing
- 8.4.3. Energy and Utility
- 8.4.4. Banking and Financial Services
- 8.4.5. Education
- 8.4.6. Other End-user Industries
- 8.1. Market Analysis, Insights and Forecast - by Network Type
- 9. Asia Network Automation Solution Industry Analysis, Insights and Forecast, 2020-2032
- 9.1. Market Analysis, Insights and Forecast - by Network Type
- 9.1.1. Physical
- 9.1.2. Virtual
- 9.1.3. Hybrid
- 9.2. Market Analysis, Insights and Forecast - by Component
- 9.2.1. Solution Type
- 9.2.1.1. Network Automation Tools
- 9.2.1.2. SD-WAN and Network Virtualization
- 9.2.1.3. Intent-based Networking
- 9.2.2. Service Type
- 9.2.2.1. Managed Service
- 9.2.2.2. Professional Service
- 9.2.1. Solution Type
- 9.3. Market Analysis, Insights and Forecast - by Deployment
- 9.3.1. Cloud
- 9.3.2. On-premise
- 9.3.3. Hybrid
- 9.4. Market Analysis, Insights and Forecast - by End-user Industry
- 9.4.1. IT and Telecom
- 9.4.2. Manufacturing
- 9.4.3. Energy and Utility
- 9.4.4. Banking and Financial Services
- 9.4.5. Education
- 9.4.6. Other End-user Industries
- 9.1. Market Analysis, Insights and Forecast - by Network Type
- 10. Australia and New Zealand Network Automation Solution Industry Analysis, Insights and Forecast, 2020-2032
- 10.1. Market Analysis, Insights and Forecast - by Network Type
- 10.1.1. Physical
- 10.1.2. Virtual
- 10.1.3. Hybrid
- 10.2. Market Analysis, Insights and Forecast - by Component
- 10.2.1. Solution Type
- 10.2.1.1. Network Automation Tools
- 10.2.1.2. SD-WAN and Network Virtualization
- 10.2.1.3. Intent-based Networking
- 10.2.2. Service Type
- 10.2.2.1. Managed Service
- 10.2.2.2. Professional Service
- 10.2.1. Solution Type
- 10.3. Market Analysis, Insights and Forecast - by Deployment
- 10.3.1. Cloud
- 10.3.2. On-premise
- 10.3.3. Hybrid
- 10.4. Market Analysis, Insights and Forecast - by End-user Industry
- 10.4.1. IT and Telecom
- 10.4.2. Manufacturing
- 10.4.3. Energy and Utility
- 10.4.4. Banking and Financial Services
- 10.4.5. Education
- 10.4.6. Other End-user Industries
- 10.1. Market Analysis, Insights and Forecast - by Network Type
- 11. Latin America Network Automation Solution Industry Analysis, Insights and Forecast, 2020-2032
- 11.1. Market Analysis, Insights and Forecast - by Network Type
- 11.1.1. Physical
- 11.1.2. Virtual
- 11.1.3. Hybrid
- 11.2. Market Analysis, Insights and Forecast - by Component
- 11.2.1. Solution Type
- 11.2.1.1. Network Automation Tools
- 11.2.1.2. SD-WAN and Network Virtualization
- 11.2.1.3. Intent-based Networking
- 11.2.2. Service Type
- 11.2.2.1. Managed Service
- 11.2.2.2. Professional Service
- 11.2.1. Solution Type
- 11.3. Market Analysis, Insights and Forecast - by Deployment
- 11.3.1. Cloud
- 11.3.2. On-premise
- 11.3.3. Hybrid
- 11.4. Market Analysis, Insights and Forecast - by End-user Industry
- 11.4.1. IT and Telecom
- 11.4.2. Manufacturing
- 11.4.3. Energy and Utility
- 11.4.4. Banking and Financial Services
- 11.4.5. Education
- 11.4.6. Other End-user Industries
- 11.1. Market Analysis, Insights and Forecast - by Network Type
- 12. Middle East and Africa Network Automation Solution Industry Analysis, Insights and Forecast, 2020-2032
- 12.1. Market Analysis, Insights and Forecast - by Network Type
- 12.1.1. Physical
- 12.1.2. Virtual
- 12.1.3. Hybrid
- 12.2. Market Analysis, Insights and Forecast - by Component
- 12.2.1. Solution Type
- 12.2.1.1. Network Automation Tools
- 12.2.1.2. SD-WAN and Network Virtualization
- 12.2.1.3. Intent-based Networking
- 12.2.2. Service Type
- 12.2.2.1. Managed Service
- 12.2.2.2. Professional Service
- 12.2.1. Solution Type
- 12.3. Market Analysis, Insights and Forecast - by Deployment
- 12.3.1. Cloud
- 12.3.2. On-premise
- 12.3.3. Hybrid
- 12.4. Market Analysis, Insights and Forecast - by End-user Industry
- 12.4.1. IT and Telecom
- 12.4.2. Manufacturing
- 12.4.3. Energy and Utility
- 12.4.4. Banking and Financial Services
- 12.4.5. Education
- 12.4.6. Other End-user Industries
- 12.1. Market Analysis, Insights and Forecast - by Network Type
- 13. Competitive Analysis
- 13.1. Company Profiles
- 13.1.1 AppViewX Inc
- 13.1.1.1. Company Overview
- 13.1.1.2. Products
- 13.1.1.3. Company Financials
- 13.1.1.4. SWOT Analysis
- 13.1.2 IBM Corporation
- 13.1.2.1. Company Overview
- 13.1.2.2. Products
- 13.1.2.3. Company Financials
- 13.1.2.4. SWOT Analysis
- 13.1.3 Nuage Networks (Nokia Corporation)
- 13.1.3.1. Company Overview
- 13.1.3.2. Products
- 13.1.3.3. Company Financials
- 13.1.3.4. SWOT Analysis
- 13.1.4 Arista Networks Inc
- 13.1.4.1. Company Overview
- 13.1.4.2. Products
- 13.1.4.3. Company Financials
- 13.1.4.4. SWOT Analysis
- 13.1.5 Hewlett Packard Enterprise Company
- 13.1.5.1. Company Overview
- 13.1.5.2. Products
- 13.1.5.3. Company Financials
- 13.1.5.4. SWOT Analysis
- 13.1.6 Cisco Systems Inc
- 13.1.6.1. Company Overview
- 13.1.6.2. Products
- 13.1.6.3. Company Financials
- 13.1.6.4. SWOT Analysis
- 13.1.7 Broadcom Inc
- 13.1.7.1. Company Overview
- 13.1.7.2. Products
- 13.1.7.3. Company Financials
- 13.1.7.4. SWOT Analysis
- 13.1.8 Fujitsu Limited
- 13.1.8.1. Company Overview
- 13.1.8.2. Products
- 13.1.8.3. Company Financials
- 13.1.8.4. SWOT Analysis
- 13.1.9 Juniper Networks Inc
- 13.1.9.1. Company Overview
- 13.1.9.2. Products
- 13.1.9.3. Company Financials
- 13.1.9.4. SWOT Analysis
- 13.1.10 BMC Software Inc
- 13.1.10.1. Company Overview
- 13.1.10.2. Products
- 13.1.10.3. Company Financials
- 13.1.10.4. SWOT Analysis
- 13.1.11 Extreme Networks Inc
- 13.1.11.1. Company Overview
- 13.1.11.2. Products
- 13.1.11.3. Company Financials
- 13.1.11.4. SWOT Analysis
- 13.1.12 NetBrain Technologies Inc
- 13.1.12.1. Company Overview
- 13.1.12.2. Products
- 13.1.12.3. Company Financials
- 13.1.12.4. SWOT Analysis
- 13.1.13 Forward Networks Inc
- 13.1.13.1. Company Overview
- 13.1.13.2. Products
- 13.1.13.3. Company Financials
- 13.1.13.4. SWOT Analysis
- 13.1.14 Solarwinds Corporation
- 13.1.14.1. Company Overview
- 13.1.14.2. Products
- 13.1.14.3. Company Financials
- 13.1.14.4. SWOT Analysis
- 13.1.15 Open Text Corporation
- 13.1.15.1. Company Overview
- 13.1.15.2. Products
- 13.1.15.3. Company Financials
- 13.1.15.4. SWOT Analysis
- 13.1.16 Fortra LLC
- 13.1.16.1. Company Overview
- 13.1.16.2. Products
- 13.1.16.3. Company Financials
- 13.1.16.4. SWOT Analysis
- 13.1.1 AppViewX Inc
- 13.2. Market Entropy
- 13.2.1 Company's Key Areas Served
- 13.2.2 Recent Developments
- 13.3. Company Market Share Analysis 2025
- 13.3.1 Top 5 Companies Market Share Analysis
- 13.3.2 Top 3 Companies Market Share Analysis
- 13.4. List of Potential Customers
- 14. Research Methodology
List of Figures
- Figure 1: Global Network Automation Solution Industry Revenue Breakdown (Million, %) by Region 2025 & 2033
- Figure 2: North America Network Automation Solution Industry Revenue (Million), by Network Type 2025 & 2033
- Figure 3: North America Network Automation Solution Industry Revenue Share (%), by Network Type 2025 & 2033
- Figure 4: North America Network Automation Solution Industry Revenue (Million), by Component 2025 & 2033
- Figure 5: North America Network Automation Solution Industry Revenue Share (%), by Component 2025 & 2033
- Figure 6: North America Network Automation Solution Industry Revenue (Million), by Deployment 2025 & 2033
- Figure 7: North America Network Automation Solution Industry Revenue Share (%), by Deployment 2025 & 2033
- Figure 8: North America Network Automation Solution Industry Revenue (Million), by End-user Industry 2025 & 2033
- Figure 9: North America Network Automation Solution Industry Revenue Share (%), by End-user Industry 2025 & 2033
- Figure 10: North America Network Automation Solution Industry Revenue (Million), by Country 2025 & 2033
- Figure 11: North America Network Automation Solution Industry Revenue Share (%), by Country 2025 & 2033
- Figure 12: Europe Network Automation Solution Industry Revenue (Million), by Network Type 2025 & 2033
- Figure 13: Europe Network Automation Solution Industry Revenue Share (%), by Network Type 2025 & 2033
- Figure 14: Europe Network Automation Solution Industry Revenue (Million), by Component 2025 & 2033
- Figure 15: Europe Network Automation Solution Industry Revenue Share (%), by Component 2025 & 2033
- Figure 16: Europe Network Automation Solution Industry Revenue (Million), by Deployment 2025 & 2033
- Figure 17: Europe Network Automation Solution Industry Revenue Share (%), by Deployment 2025 & 2033
- Figure 18: Europe Network Automation Solution Industry Revenue (Million), by End-user Industry 2025 & 2033
- Figure 19: Europe Network Automation Solution Industry Revenue Share (%), by End-user Industry 2025 & 2033
- Figure 20: Europe Network Automation Solution Industry Revenue (Million), by Country 2025 & 2033
- Figure 21: Europe Network Automation Solution Industry Revenue Share (%), by Country 2025 & 2033
- Figure 22: Asia Network Automation Solution Industry Revenue (Million), by Network Type 2025 & 2033
- Figure 23: Asia Network Automation Solution Industry Revenue Share (%), by Network Type 2025 & 2033
- Figure 24: Asia Network Automation Solution Industry Revenue (Million), by Component 2025 & 2033
- Figure 25: Asia Network Automation Solution Industry Revenue Share (%), by Component 2025 & 2033
- Figure 26: Asia Network Automation Solution Industry Revenue (Million), by Deployment 2025 & 2033
- Figure 27: Asia Network Automation Solution Industry Revenue Share (%), by Deployment 2025 & 2033
- Figure 28: Asia Network Automation Solution Industry Revenue (Million), by End-user Industry 2025 & 2033
- Figure 29: Asia Network Automation Solution Industry Revenue Share (%), by End-user Industry 2025 & 2033
- Figure 30: Asia Network Automation Solution Industry Revenue (Million), by Country 2025 & 2033
- Figure 31: Asia Network Automation Solution Industry Revenue Share (%), by Country 2025 & 2033
- Figure 32: Australia and New Zealand Network Automation Solution Industry Revenue (Million), by Network Type 2025 & 2033
- Figure 33: Australia and New Zealand Network Automation Solution Industry Revenue Share (%), by Network Type 2025 & 2033
- Figure 34: Australia and New Zealand Network Automation Solution Industry Revenue (Million), by Component 2025 & 2033
- Figure 35: Australia and New Zealand Network Automation Solution Industry Revenue Share (%), by Component 2025 & 2033
- Figure 36: Australia and New Zealand Network Automation Solution Industry Revenue (Million), by Deployment 2025 & 2033
- Figure 37: Australia and New Zealand Network Automation Solution Industry Revenue Share (%), by Deployment 2025 & 2033
- Figure 38: Australia and New Zealand Network Automation Solution Industry Revenue (Million), by End-user Industry 2025 & 2033
- Figure 39: Australia and New Zealand Network Automation Solution Industry Revenue Share (%), by End-user Industry 2025 & 2033
- Figure 40: Australia and New Zealand Network Automation Solution Industry Revenue (Million), by Country 2025 & 2033
- Figure 41: Australia and New Zealand Network Automation Solution Industry Revenue Share (%), by Country 2025 & 2033
- Figure 42: Latin America Network Automation Solution Industry Revenue (Million), by Network Type 2025 & 2033
- Figure 43: Latin America Network Automation Solution Industry Revenue Share (%), by Network Type 2025 & 2033
- Figure 44: Latin America Network Automation Solution Industry Revenue (Million), by Component 2025 & 2033
- Figure 45: Latin America Network Automation Solution Industry Revenue Share (%), by Component 2025 & 2033
- Figure 46: Latin America Network Automation Solution Industry Revenue (Million), by Deployment 2025 & 2033
- Figure 47: Latin America Network Automation Solution Industry Revenue Share (%), by Deployment 2025 & 2033
- Figure 48: Latin America Network Automation Solution Industry Revenue (Million), by End-user Industry 2025 & 2033
- Figure 49: Latin America Network Automation Solution Industry Revenue Share (%), by End-user Industry 2025 & 2033
- Figure 50: Latin America Network Automation Solution Industry Revenue (Million), by Country 2025 & 2033
- Figure 51: Latin America Network Automation Solution Industry Revenue Share (%), by Country 2025 & 2033
- Figure 52: Middle East and Africa Network Automation Solution Industry Revenue (Million), by Network Type 2025 & 2033
- Figure 53: Middle East and Africa Network Automation Solution Industry Revenue Share (%), by Network Type 2025 & 2033
- Figure 54: Middle East and Africa Network Automation Solution Industry Revenue (Million), by Component 2025 & 2033
- Figure 55: Middle East and Africa Network Automation Solution Industry Revenue Share (%), by Component 2025 & 2033
- Figure 56: Middle East and Africa Network Automation Solution Industry Revenue (Million), by Deployment 2025 & 2033
- Figure 57: Middle East and Africa Network Automation Solution Industry Revenue Share (%), by Deployment 2025 & 2033
- Figure 58: Middle East and Africa Network Automation Solution Industry Revenue (Million), by End-user Industry 2025 & 2033
- Figure 59: Middle East and Africa Network Automation Solution Industry Revenue Share (%), by End-user Industry 2025 & 2033
- Figure 60: Middle East and Africa Network Automation Solution Industry Revenue (Million), by Country 2025 & 2033
- Figure 61: Middle East and Africa Network Automation Solution Industry Revenue Share (%), by Country 2025 & 2033
List of Tables
- Table 1: Global Network Automation Solution Industry Revenue Million Forecast, by Network Type 2020 & 2033
- Table 2: Global Network Automation Solution Industry Revenue Million Forecast, by Component 2020 & 2033
- Table 3: Global Network Automation Solution Industry Revenue Million Forecast, by Deployment 2020 & 2033
- Table 4: Global Network Automation Solution Industry Revenue Million Forecast, by End-user Industry 2020 & 2033
- Table 5: Global Network Automation Solution Industry Revenue Million Forecast, by Region 2020 & 2033
- Table 6: Global Network Automation Solution Industry Revenue Million Forecast, by Network Type 2020 & 2033
- Table 7: Global Network Automation Solution Industry Revenue Million Forecast, by Component 2020 & 2033
- Table 8: Global Network Automation Solution Industry Revenue Million Forecast, by Deployment 2020 & 2033
- Table 9: Global Network Automation Solution Industry Revenue Million Forecast, by End-user Industry 2020 & 2033
- Table 10: Global Network Automation Solution Industry Revenue Million Forecast, by Country 2020 & 2033
- Table 11: Global Network Automation Solution Industry Revenue Million Forecast, by Network Type 2020 & 2033
- Table 12: Global Network Automation Solution Industry Revenue Million Forecast, by Component 2020 & 2033
- Table 13: Global Network Automation Solution Industry Revenue Million Forecast, by Deployment 2020 & 2033
- Table 14: Global Network Automation Solution Industry Revenue Million Forecast, by End-user Industry 2020 & 2033
- Table 15: Global Network Automation Solution Industry Revenue Million Forecast, by Country 2020 & 2033
- Table 16: Global Network Automation Solution Industry Revenue Million Forecast, by Network Type 2020 & 2033
- Table 17: Global Network Automation Solution Industry Revenue Million Forecast, by Component 2020 & 2033
- Table 18: Global Network Automation Solution Industry Revenue Million Forecast, by Deployment 2020 & 2033
- Table 19: Global Network Automation Solution Industry Revenue Million Forecast, by End-user Industry 2020 & 2033
- Table 20: Global Network Automation Solution Industry Revenue Million Forecast, by Country 2020 & 2033
- Table 21: Global Network Automation Solution Industry Revenue Million Forecast, by Network Type 2020 & 2033
- Table 22: Global Network Automation Solution Industry Revenue Million Forecast, by Component 2020 & 2033
- Table 23: Global Network Automation Solution Industry Revenue Million Forecast, by Deployment 2020 & 2033
- Table 24: Global Network Automation Solution Industry Revenue Million Forecast, by End-user Industry 2020 & 2033
- Table 25: Global Network Automation Solution Industry Revenue Million Forecast, by Country 2020 & 2033
- Table 26: Global Network Automation Solution Industry Revenue Million Forecast, by Network Type 2020 & 2033
- Table 27: Global Network Automation Solution Industry Revenue Million Forecast, by Component 2020 & 2033
- Table 28: Global Network Automation Solution Industry Revenue Million Forecast, by Deployment 2020 & 2033
- Table 29: Global Network Automation Solution Industry Revenue Million Forecast, by End-user Industry 2020 & 2033
- Table 30: Global Network Automation Solution Industry Revenue Million Forecast, by Country 2020 & 2033
- Table 31: Global Network Automation Solution Industry Revenue Million Forecast, by Network Type 2020 & 2033
- Table 32: Global Network Automation Solution Industry Revenue Million Forecast, by Component 2020 & 2033
- Table 33: Global Network Automation Solution Industry Revenue Million Forecast, by Deployment 2020 & 2033
- Table 34: Global Network Automation Solution Industry Revenue Million Forecast, by End-user Industry 2020 & 2033
- Table 35: Global Network Automation Solution Industry Revenue Million Forecast, by Country 2020 & 2033
Frequently Asked Questions
1. What is the projected Compound Annual Growth Rate (CAGR) of the Network Automation Solution Industry?
The projected CAGR is approximately 23.16%.
2. Which companies are prominent players in the Network Automation Solution Industry?
Key companies in the market include AppViewX Inc, IBM Corporation, Nuage Networks (Nokia Corporation), Arista Networks Inc, Hewlett Packard Enterprise Company, Cisco Systems Inc, Broadcom Inc, Fujitsu Limited, Juniper Networks Inc, BMC Software Inc, Extreme Networks Inc, NetBrain Technologies Inc, Forward Networks Inc, Solarwinds Corporation, Open Text Corporation, Fortra LLC.
3. What are the main segments of the Network Automation Solution Industry?
The market segments include Network Type, Component, Deployment, End-user Industry.
4. Can you provide details about the market size?
The market size is estimated to be USD 25.16 Million as of 2022.
5. What are some drivers contributing to market growth?
Increasing Demand for Data Center Network; Rising Trend of Connected Devices.
6. What are the notable trends driving market growth?
IT and Telecom End-user Industry is Expected to Hold Significant Market Share.
7. Are there any restraints impacting market growth?
Lack of Skilled Professional Across Industries.
8. Can you provide examples of recent developments in the market?
March 2024: Arista announced a new network observability software. This offering integrates data from network infrastructure performance with insights from compute and server systems to provide comprehensive insights into application and workload performance across data centers, campuses, and wide-area networks. Arista’s CloudVision Universal Network ObservabilityTM (CV UNOTM) system, available as a premium feature on Arista CloudVision, facilitates network automation, systems, and application visibility.
9. What pricing options are available for accessing the report?
Pricing options include single-user, multi-user, and enterprise licenses priced at USD 4750, USD 5250, and USD 8750 respectively.
10. Is the market size provided in terms of value or volume?
The market size is provided in terms of value, measured in Million.
11. Are there any specific market keywords associated with the report?
Yes, the market keyword associated with the report is "Network Automation Solution Industry," which aids in identifying and referencing the specific market segment covered.
12. How do I determine which pricing option suits my needs best?
The pricing options vary based on user requirements and access needs. Individual users may opt for single-user licenses, while businesses requiring broader access may choose multi-user or enterprise licenses for cost-effective access to the report.
13. Are there any additional resources or data provided in the Network Automation Solution Industry report?
While the report offers comprehensive insights, it's advisable to review the specific contents or supplementary materials provided to ascertain if additional resources or data are available.
14. How can I stay updated on further developments or reports in the Network Automation Solution Industry?
To stay informed about further developments, trends, and reports in the Network Automation Solution Industry, consider subscribing to industry newsletters, following relevant companies and organizations, or regularly checking reputable industry news sources and publications.
Methodology
Step 1 - Identification of Relevant Samples Size from Population Database


Step 2 - Approaches for Defining Global Market Size (Value, Volume* & Price*)

Note*: In applicable scenarios
Step 3 - Data Sources
Primary Research
- Web Analytics
- Survey Reports
- Research Institute
- Latest Research Reports
- Opinion Leaders
Secondary Research
- Annual Reports
- White Paper
- Latest Press Release
- Industry Association
- Paid Database
- Investor Presentations

Step 4 - Data Triangulation
Involves using different sources of information in order to increase the validity of a study
These sources are likely to be stakeholders in a program - participants, other researchers, program staff, other community members, and so on.
Then we put all data in single framework & apply various statistical tools to find out the dynamic on the market.
During the analysis stage, feedback from the stakeholder groups would be compared to determine areas of agreement as well as areas of divergence