

Key Insights
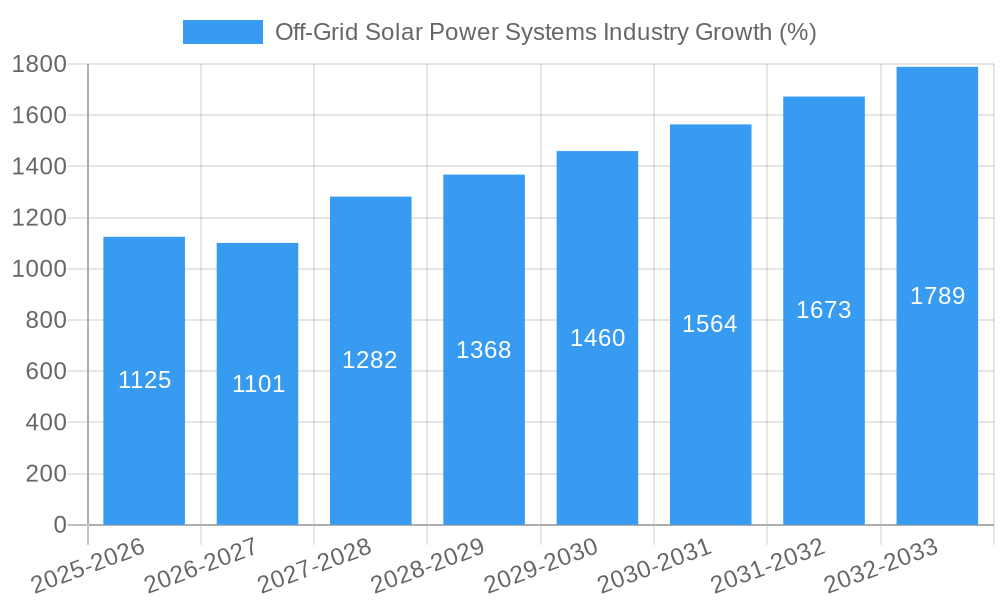
The off-grid solar power systems market is experiencing robust growth, driven by increasing energy demands in remote areas, rising electricity prices, and a growing focus on environmental sustainability. A compound annual growth rate (CAGR) of 7.51% from 2019 to 2024 indicates a significant upward trajectory. This expansion is fueled by several key factors. Firstly, the declining cost of solar panels and batteries makes off-grid solutions increasingly affordable and accessible, even in developing nations. Secondly, government initiatives promoting renewable energy and rural electrification are providing substantial incentives for adoption. Thirdly, the reliability and ease of installation of these systems are attractive to both residential and commercial users. The market is segmented by end-user (residential, commercial, and industrial), with residential currently dominating due to widespread affordability and individual needs. However, commercial and industrial sectors are showing significant potential for future growth, particularly in areas lacking reliable grid infrastructure. Leading companies like JinkoSolar, Schneider Electric, LONGi Green Energy, and Tesla are at the forefront of innovation, driving technological advancements and expanding market reach. Geographic expansion is also a key driver, with strong growth potential in emerging markets of Asia-Pacific and Africa where grid access remains limited. While challenges such as initial investment costs and reliance on solar irradiance remain, these are being mitigated by innovative financing options and advancements in battery technology, supporting continued market expansion.
The forecast period (2025-2033) projects continued growth, exceeding the historical CAGR due to accelerating technological advancements and broader adoption across sectors. The strong presence of major players, combined with ongoing technological improvements – including enhanced battery storage capacity and more efficient solar panels – will continue to shape the market landscape. Furthermore, growing awareness of climate change and a push for energy independence are expected to further stimulate demand. The diverse regional market presents significant opportunities for expansion, particularly in regions with high solar irradiance and limited grid access. Continued investments in research and development, coupled with favorable government policies, will likely accelerate market penetration in both established and developing economies, thereby sustaining the growth momentum of the off-grid solar power systems industry.
Off-Grid Solar Power Systems Industry Market Report: 2019-2033
This comprehensive report provides an in-depth analysis of the Off-Grid Solar Power Systems market, encompassing market dynamics, growth trends, regional dominance, product landscapes, key players, and future outlook. The report covers the period 2019-2033, with 2025 as the base and estimated year. This analysis is crucial for investors, industry professionals, and policymakers seeking to understand and capitalize on the booming off-grid solar energy sector. The parent market is the broader renewable energy sector, while the child market focuses specifically on off-grid solar power solutions for residential, commercial, and industrial applications.
Off-Grid Solar Power Systems Industry Market Dynamics & Structure
The off-grid solar power systems market is experiencing robust growth, fueled by escalating energy demands, rising electricity prices, and supportive government policies promoting renewable energy adoption. The market exhibits moderate concentration, with a mix of established multinational corporations and numerous agile, specialized smaller companies vying for market share. Technological advancements, particularly in energy storage solutions (like advanced battery technologies including lithium-ion and flow batteries) and enhanced solar panel efficiency (higher wattage panels and improved cell designs), are pivotal drivers. However, regulatory landscapes differ significantly across geographical regions, influencing market access and expansion trajectories. Traditional alternatives, such as diesel generators, are gradually losing ground due to their higher operational expenses and considerable environmental impact. End-user demographics are evolving, showing increased adoption in residential and commercial sectors, especially within developing economies. Mergers and acquisitions (M&A) activity is on the rise, with larger players strategically consolidating their market positions through acquisitions of smaller, specialized firms possessing unique technologies or strong regional presence.
- Market Concentration: Moderate (Insert Percentage with Source if Available)
- Technological Innovation: High (driven by advancements in battery technology, including improved energy density and lifespan, and solar panel efficiency, including higher power output and bifacial technology)
- Regulatory Frameworks: Varied by region, significantly impacting market access and project development timelines.
- M&A Activity: Increasing, with Insert Number deals recorded between 2019-2024 (Specify Source).
- Innovation Barriers: High upfront capital costs, complex system integration requirements, and a shortage of skilled labor in certain regions remain significant hurdles.
Off-Grid Solar Power Systems Industry Growth Trends & Insights
The off-grid solar power systems market exhibits robust growth, fueled by increasing energy access needs in remote areas and a growing preference for sustainable energy solutions. Market size has shown substantial expansion during the historical period (2019-2024), with a projected CAGR of xx% from 2025 to 2033. This growth is driven by declining solar panel costs, improved battery technology, and government support programs promoting off-grid electrification. Technological disruptions, such as the emergence of more efficient solar panels and longer-lasting batteries, are accelerating market penetration. Consumer behavior shifts towards environmentally conscious choices are further boosting adoption rates. The market penetration rate is expected to reach xx% by 2033.
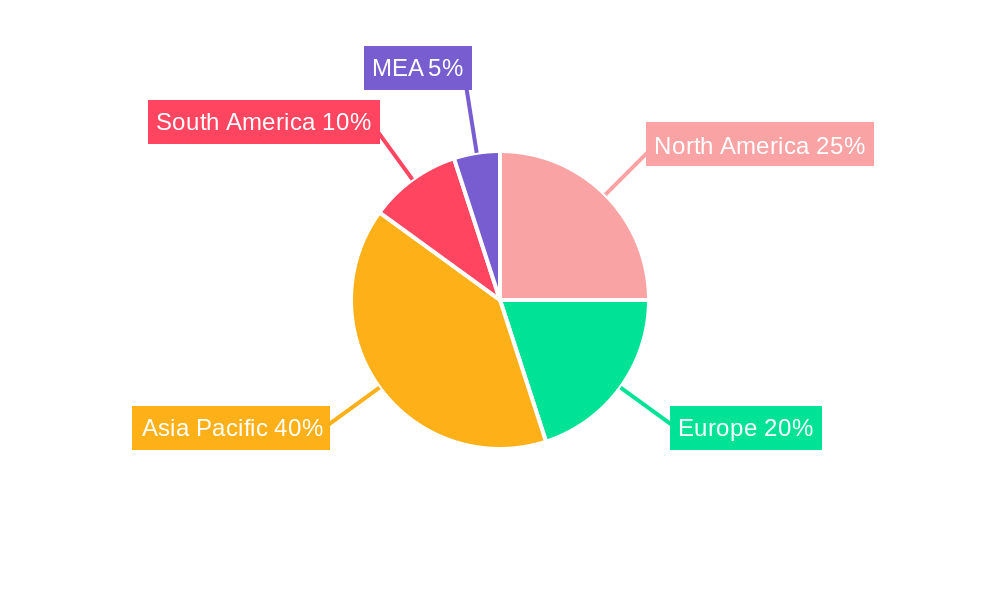
Dominant Regions, Countries, or Segments in Off-Grid Solar Power Systems Industry
Growth within the off-grid solar power systems market displays considerable regional disparity. Developing nations in Asia and Africa are witnessing the most rapid expansion, primarily due to substantial energy demands and inadequate grid infrastructure. The residential segment currently holds the largest market share, particularly in rural areas lacking reliable grid electricity. Nevertheless, the commercial and industrial sectors are poised for significant growth in the coming years, driven by increasing investments in off-grid renewable energy solutions to reduce operational costs and enhance sustainability profiles.
- Key Drivers:
- Asia (India, Southeast Asia, Sub-Saharan Africa): High energy demand, government support for renewable energy through subsidies and tax incentives, and increasing awareness of climate change.
- Africa: Large underserved populations, limited grid access, and a growing number of microgrid projects.
- Residential Segment: High adoption rates due to lack of grid electricity, cost-effectiveness (especially considering decreasing battery prices), and increasing availability of financing options.
- Dominance Factors:
- Government policies and incentives, including feed-in tariffs, tax breaks, and grants.
- Technological advancements leading to improved efficiency, reliability, and reduced costs.
- Falling costs of solar panels and batteries, making off-grid systems increasingly affordable.
- Growing awareness of the environmental and economic benefits of renewable energy.
Off-Grid Solar Power Systems Industry Product Landscape
The off-grid solar power systems market presents a diverse range of products, encompassing solar panels (monocrystalline, polycrystalline, thin-film), inverters (string, microinverter, hybrid), batteries (lead-acid, lithium-ion, flow), charge controllers (PWM, MPPT), and mounting systems (ground, roof). Recent innovations center on enhancing efficiency, durability, and affordability, focusing on higher energy density batteries, improved panel power output, and smart inverters that optimize system performance. The integration of smart technologies, including remote monitoring and control systems via IoT connectivity, empowers enhanced system performance, predictive maintenance, and optimized energy management. Key differentiating features encompass superior energy storage capabilities, extended lifespans, and integrated energy management systems (EMS) with advanced algorithms for optimal energy utilization and grid integration (when applicable).
Key Drivers, Barriers & Challenges in Off-Grid Solar Power Systems Industry
Key Drivers:
- Continuous decline in the cost of solar panels and batteries.
- Surge in demand for reliable and sustainable energy in underserved regions.
- Supportive government policies and financial incentives promoting renewable energy deployment.
- Heightened environmental consciousness and concerns regarding climate change.
- Increasing energy independence and resilience requirements for individuals and communities.
Challenges:
- High initial capital expenditure can present a significant barrier to entry for many consumers.
- Limited grid infrastructure in many regions necessitates extensive and potentially costly site preparation and installation.
- Supply chain vulnerabilities and disruptions can affect component availability and pricing.
- Shortage of skilled labor for installation, maintenance, and repair leads to project delays and increased costs (estimated at Insert Amount with Source USD in annual project delays).
- Ensuring long-term system reliability and performance in challenging environmental conditions (extreme temperatures, humidity).
Emerging Opportunities in Off-Grid Solar Power Systems Industry
Emerging opportunities abound in the off-grid solar power systems market. Untapped markets exist in many developing countries with limited grid access. Innovative applications, such as powering telecommunications towers and agricultural facilities, are gaining traction. The evolving consumer preference for sustainable and reliable energy sources presents further opportunities. Hybrid systems integrating solar power with other renewable energy sources are gaining popularity.
Growth Accelerators in the Off-Grid Solar Power Systems Industry
Long-term growth in the off-grid solar power systems market is driven by ongoing technological breakthroughs in solar panel efficiency and battery storage capacity. Strategic partnerships between manufacturers, distributors, and installers are enhancing market reach and streamlining operations. Government policies encouraging renewable energy adoption and supporting off-grid electrification initiatives are crucial growth catalysts. The expansion into new markets and applications will further accelerate market growth.
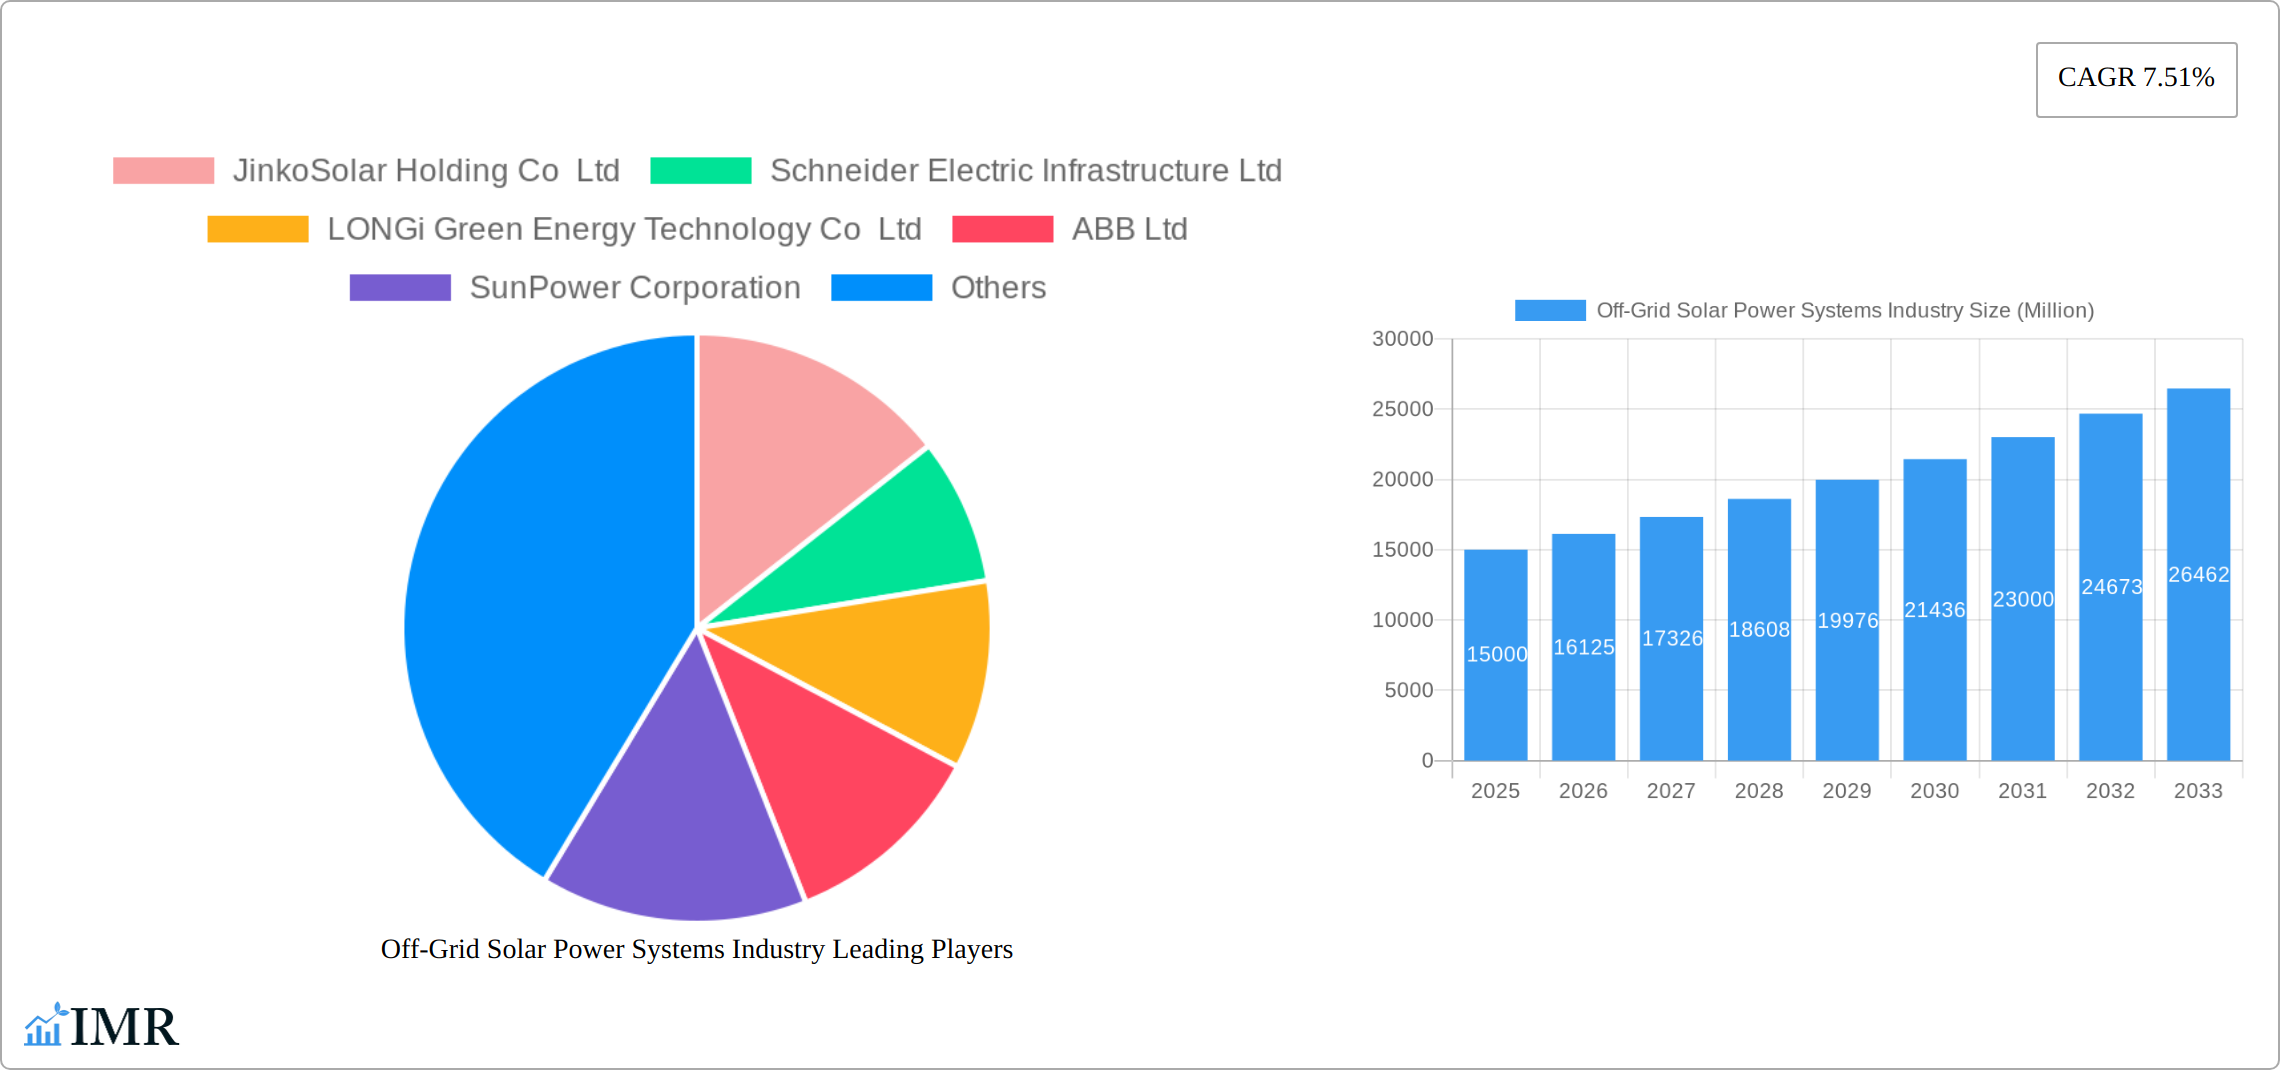
Key Players Shaping the Off-Grid Solar Power Systems Market
- JinkoSolar Holding Co Ltd
- Schneider Electric Infrastructure Ltd
- LONGi Green Energy Technology Co Ltd
- ABB Ltd
- SunPower Corporation
- Tesla Inc
- Canadian Solar Inc
- Trina Solar Ltd
- Sharp Corporation
- JA Solar Holding
Notable Milestones in Off-Grid Solar Power Systems Industry Sector
- November 2022: LONGi Solar Technology Co., Ltd. completes delivery of 406MW of bifacial PV panels for Saudi Arabia's Red Sea Solar PV Project – the world's largest off-grid energy storage project.
- October 2022: Tata Power Solar Systems launches cost-efficient off-grid solar solutions in West Bengal, Bihar, and Jharkhand, India.
- September 2022: Servotech Power Systems secures a 1.8 MW off-grid solar project in Uttar Pradesh, India.
In-Depth Off-Grid Solar Power Systems Industry Market Outlook
The off-grid solar power systems market presents significant future potential, driven by increasing energy demand, declining costs, and supportive government policies. Strategic opportunities lie in expanding into underserved markets, developing innovative applications, and fostering strategic partnerships to enhance market penetration. The ongoing technological advancements in solar panel and battery technology will continue to drive market growth, creating lucrative opportunities for both established and emerging players in the industry. The market is poised for sustained expansion, making it an attractive sector for investment and business development.
Off-Grid Solar Power Systems Industry Segmentation
-
1. End-User
- 1.1. Residential
- 1.2. Commercial and Industrial
Off-Grid Solar Power Systems Industry Segmentation By Geography
-
1. North America
- 1.1. United States
- 1.2. Canada
- 1.3. Rest of North America
-
2. Europe
- 2.1. Germany
- 2.2. France
- 2.3. Italy
- 2.4. United Kingdom
- 2.5. Spain
- 2.6. NORDIC
- 2.7. Turkey
- 2.8. Russia
- 2.9. Rest of Europe
-
3. Asia Pacific
- 3.1. China
- 3.2. India
- 3.3. South Korea
- 3.4. Japan
- 3.5. Malaysia
- 3.6. Thailand
- 3.7. Indonesia
- 3.8. Vietnam
- 3.9. Rest of Asia Pacific
-
4. Middle East and Africa
- 4.1. Saudi Arabia
- 4.2. Qatar
- 4.3. South Africa
- 4.4. United Arab Emirates
- 4.5. Nigeria
- 4.6. Oman
- 4.7. Egypt
- 4.8. Algeria
- 4.9. Rest of Middle East and Africa
-
5. South America
- 5.1. Brazil
- 5.2. Argentina
- 5.3. Colombia
- 5.4. Rest of South America
Off-Grid Solar Power Systems Industry REPORT HIGHLIGHTS
| Aspects | Details |
|---|---|
| Study Period | 2019-2033 |
| Base Year | 2024 |
| Estimated Year | 2025 |
| Forecast Period | 2025-2033 |
| Historical Period | 2019-2024 |
| Growth Rate | CAGR of 7.51% from 2019-2033 |
| Segmentation |
|
Table of Contents
- 1. Introduction
- 1.1. Research Scope
- 1.2. Market Segmentation
- 1.3. Research Methodology
- 1.4. Definitions and Assumptions
- 2. Executive Summary
- 2.1. Introduction
- 3. Market Dynamics
- 3.1. Introduction
- 3.2. Market Drivers
- 3.2.1. 4.; Growth in Electric Vehicle Sales4.; Companies Investing in Commissioning New Charging Stations
- 3.3. Market Restrains
- 3.3.1. 4.; The Negative Impact on the Environment
- 3.4. Market Trends
- 3.4.1. Residential Segment Expected to Dominate the Market
- 4. Market Factor Analysis
- 4.1. Porters Five Forces
- 4.2. Supply/Value Chain
- 4.3. PESTEL analysis
- 4.4. Market Entropy
- 4.5. Patent/Trademark Analysis
- 5. Global Off-Grid Solar Power Systems Industry Analysis, Insights and Forecast, 2019-2031
- 5.1. Market Analysis, Insights and Forecast - by End-User
- 5.1.1. Residential
- 5.1.2. Commercial and Industrial
- 5.2. Market Analysis, Insights and Forecast - by Region
- 5.2.1. North America
- 5.2.2. Europe
- 5.2.3. Asia Pacific
- 5.2.4. Middle East and Africa
- 5.2.5. South America
- 5.1. Market Analysis, Insights and Forecast - by End-User
- 6. North America Off-Grid Solar Power Systems Industry Analysis, Insights and Forecast, 2019-2031
- 6.1. Market Analysis, Insights and Forecast - by End-User
- 6.1.1. Residential
- 6.1.2. Commercial and Industrial
- 6.1. Market Analysis, Insights and Forecast - by End-User
- 7. Europe Off-Grid Solar Power Systems Industry Analysis, Insights and Forecast, 2019-2031
- 7.1. Market Analysis, Insights and Forecast - by End-User
- 7.1.1. Residential
- 7.1.2. Commercial and Industrial
- 7.1. Market Analysis, Insights and Forecast - by End-User
- 8. Asia Pacific Off-Grid Solar Power Systems Industry Analysis, Insights and Forecast, 2019-2031
- 8.1. Market Analysis, Insights and Forecast - by End-User
- 8.1.1. Residential
- 8.1.2. Commercial and Industrial
- 8.1. Market Analysis, Insights and Forecast - by End-User
- 9. Middle East and Africa Off-Grid Solar Power Systems Industry Analysis, Insights and Forecast, 2019-2031
- 9.1. Market Analysis, Insights and Forecast - by End-User
- 9.1.1. Residential
- 9.1.2. Commercial and Industrial
- 9.1. Market Analysis, Insights and Forecast - by End-User
- 10. South America Off-Grid Solar Power Systems Industry Analysis, Insights and Forecast, 2019-2031
- 10.1. Market Analysis, Insights and Forecast - by End-User
- 10.1.1. Residential
- 10.1.2. Commercial and Industrial
- 10.1. Market Analysis, Insights and Forecast - by End-User
- 11. North America Off-Grid Solar Power Systems Industry Analysis, Insights and Forecast, 2019-2031
- 11.1. Market Analysis, Insights and Forecast - By Country/Sub-region
- 11.1.1 United States
- 11.1.2 Canada
- 11.1.3 Mexico
- 12. Europe Off-Grid Solar Power Systems Industry Analysis, Insights and Forecast, 2019-2031
- 12.1. Market Analysis, Insights and Forecast - By Country/Sub-region
- 12.1.1 Germany
- 12.1.2 United Kingdom
- 12.1.3 France
- 12.1.4 Spain
- 12.1.5 Italy
- 12.1.6 Spain
- 12.1.7 Belgium
- 12.1.8 Netherland
- 12.1.9 Nordics
- 12.1.10 Rest of Europe
- 13. Asia Pacific Off-Grid Solar Power Systems Industry Analysis, Insights and Forecast, 2019-2031
- 13.1. Market Analysis, Insights and Forecast - By Country/Sub-region
- 13.1.1 China
- 13.1.2 Japan
- 13.1.3 India
- 13.1.4 South Korea
- 13.1.5 Southeast Asia
- 13.1.6 Australia
- 13.1.7 Indonesia
- 13.1.8 Phillipes
- 13.1.9 Singapore
- 13.1.10 Thailandc
- 13.1.11 Rest of Asia Pacific
- 14. South America Off-Grid Solar Power Systems Industry Analysis, Insights and Forecast, 2019-2031
- 14.1. Market Analysis, Insights and Forecast - By Country/Sub-region
- 14.1.1 Brazil
- 14.1.2 Argentina
- 14.1.3 Peru
- 14.1.4 Chile
- 14.1.5 Colombia
- 14.1.6 Ecuador
- 14.1.7 Venezuela
- 14.1.8 Rest of South America
- 15. North America Off-Grid Solar Power Systems Industry Analysis, Insights and Forecast, 2019-2031
- 15.1. Market Analysis, Insights and Forecast - By Country/Sub-region
- 15.1.1 United States
- 15.1.2 Canada
- 15.1.3 Mexico
- 16. MEA Off-Grid Solar Power Systems Industry Analysis, Insights and Forecast, 2019-2031
- 16.1. Market Analysis, Insights and Forecast - By Country/Sub-region
- 16.1.1 United Arab Emirates
- 16.1.2 Saudi Arabia
- 16.1.3 South Africa
- 16.1.4 Rest of Middle East and Africa
- 17. Competitive Analysis
- 17.1. Global Market Share Analysis 2024
- 17.2. Company Profiles
- 17.2.1 JinkoSolar Holding Co Ltd
- 17.2.1.1. Overview
- 17.2.1.2. Products
- 17.2.1.3. SWOT Analysis
- 17.2.1.4. Recent Developments
- 17.2.1.5. Financials (Based on Availability)
- 17.2.2 Schneider Electric Infrastructure Ltd
- 17.2.2.1. Overview
- 17.2.2.2. Products
- 17.2.2.3. SWOT Analysis
- 17.2.2.4. Recent Developments
- 17.2.2.5. Financials (Based on Availability)
- 17.2.3 LONGi Green Energy Technology Co Ltd
- 17.2.3.1. Overview
- 17.2.3.2. Products
- 17.2.3.3. SWOT Analysis
- 17.2.3.4. Recent Developments
- 17.2.3.5. Financials (Based on Availability)
- 17.2.4 ABB Ltd
- 17.2.4.1. Overview
- 17.2.4.2. Products
- 17.2.4.3. SWOT Analysis
- 17.2.4.4. Recent Developments
- 17.2.4.5. Financials (Based on Availability)
- 17.2.5 SunPower Corporation
- 17.2.5.1. Overview
- 17.2.5.2. Products
- 17.2.5.3. SWOT Analysis
- 17.2.5.4. Recent Developments
- 17.2.5.5. Financials (Based on Availability)
- 17.2.6 Tesla Inc *List Not Exhaustive
- 17.2.6.1. Overview
- 17.2.6.2. Products
- 17.2.6.3. SWOT Analysis
- 17.2.6.4. Recent Developments
- 17.2.6.5. Financials (Based on Availability)
- 17.2.7 Canadian Solar Inc
- 17.2.7.1. Overview
- 17.2.7.2. Products
- 17.2.7.3. SWOT Analysis
- 17.2.7.4. Recent Developments
- 17.2.7.5. Financials (Based on Availability)
- 17.2.8 Trina Solar Ltd
- 17.2.8.1. Overview
- 17.2.8.2. Products
- 17.2.8.3. SWOT Analysis
- 17.2.8.4. Recent Developments
- 17.2.8.5. Financials (Based on Availability)
- 17.2.9 Sharp Corporation
- 17.2.9.1. Overview
- 17.2.9.2. Products
- 17.2.9.3. SWOT Analysis
- 17.2.9.4. Recent Developments
- 17.2.9.5. Financials (Based on Availability)
- 17.2.10 JA Solar Holding
- 17.2.10.1. Overview
- 17.2.10.2. Products
- 17.2.10.3. SWOT Analysis
- 17.2.10.4. Recent Developments
- 17.2.10.5. Financials (Based on Availability)
- 17.2.1 JinkoSolar Holding Co Ltd
List of Figures
- Figure 1: Global Off-Grid Solar Power Systems Industry Revenue Breakdown (Million, %) by Region 2024 & 2032
- Figure 2: Global Off-Grid Solar Power Systems Industry Volume Breakdown (gigawatt, %) by Region 2024 & 2032
- Figure 3: North America Off-Grid Solar Power Systems Industry Revenue (Million), by Country 2024 & 2032
- Figure 4: North America Off-Grid Solar Power Systems Industry Volume (gigawatt), by Country 2024 & 2032
- Figure 5: North America Off-Grid Solar Power Systems Industry Revenue Share (%), by Country 2024 & 2032
- Figure 6: North America Off-Grid Solar Power Systems Industry Volume Share (%), by Country 2024 & 2032
- Figure 7: Europe Off-Grid Solar Power Systems Industry Revenue (Million), by Country 2024 & 2032
- Figure 8: Europe Off-Grid Solar Power Systems Industry Volume (gigawatt), by Country 2024 & 2032
- Figure 9: Europe Off-Grid Solar Power Systems Industry Revenue Share (%), by Country 2024 & 2032
- Figure 10: Europe Off-Grid Solar Power Systems Industry Volume Share (%), by Country 2024 & 2032
- Figure 11: Asia Pacific Off-Grid Solar Power Systems Industry Revenue (Million), by Country 2024 & 2032
- Figure 12: Asia Pacific Off-Grid Solar Power Systems Industry Volume (gigawatt), by Country 2024 & 2032
- Figure 13: Asia Pacific Off-Grid Solar Power Systems Industry Revenue Share (%), by Country 2024 & 2032
- Figure 14: Asia Pacific Off-Grid Solar Power Systems Industry Volume Share (%), by Country 2024 & 2032
- Figure 15: South America Off-Grid Solar Power Systems Industry Revenue (Million), by Country 2024 & 2032
- Figure 16: South America Off-Grid Solar Power Systems Industry Volume (gigawatt), by Country 2024 & 2032
- Figure 17: South America Off-Grid Solar Power Systems Industry Revenue Share (%), by Country 2024 & 2032
- Figure 18: South America Off-Grid Solar Power Systems Industry Volume Share (%), by Country 2024 & 2032
- Figure 19: North America Off-Grid Solar Power Systems Industry Revenue (Million), by Country 2024 & 2032
- Figure 20: North America Off-Grid Solar Power Systems Industry Volume (gigawatt), by Country 2024 & 2032
- Figure 21: North America Off-Grid Solar Power Systems Industry Revenue Share (%), by Country 2024 & 2032
- Figure 22: North America Off-Grid Solar Power Systems Industry Volume Share (%), by Country 2024 & 2032
- Figure 23: MEA Off-Grid Solar Power Systems Industry Revenue (Million), by Country 2024 & 2032
- Figure 24: MEA Off-Grid Solar Power Systems Industry Volume (gigawatt), by Country 2024 & 2032
- Figure 25: MEA Off-Grid Solar Power Systems Industry Revenue Share (%), by Country 2024 & 2032
- Figure 26: MEA Off-Grid Solar Power Systems Industry Volume Share (%), by Country 2024 & 2032
- Figure 27: North America Off-Grid Solar Power Systems Industry Revenue (Million), by End-User 2024 & 2032
- Figure 28: North America Off-Grid Solar Power Systems Industry Volume (gigawatt), by End-User 2024 & 2032
- Figure 29: North America Off-Grid Solar Power Systems Industry Revenue Share (%), by End-User 2024 & 2032
- Figure 30: North America Off-Grid Solar Power Systems Industry Volume Share (%), by End-User 2024 & 2032
- Figure 31: North America Off-Grid Solar Power Systems Industry Revenue (Million), by Country 2024 & 2032
- Figure 32: North America Off-Grid Solar Power Systems Industry Volume (gigawatt), by Country 2024 & 2032
- Figure 33: North America Off-Grid Solar Power Systems Industry Revenue Share (%), by Country 2024 & 2032
- Figure 34: North America Off-Grid Solar Power Systems Industry Volume Share (%), by Country 2024 & 2032
- Figure 35: Europe Off-Grid Solar Power Systems Industry Revenue (Million), by End-User 2024 & 2032
- Figure 36: Europe Off-Grid Solar Power Systems Industry Volume (gigawatt), by End-User 2024 & 2032
- Figure 37: Europe Off-Grid Solar Power Systems Industry Revenue Share (%), by End-User 2024 & 2032
- Figure 38: Europe Off-Grid Solar Power Systems Industry Volume Share (%), by End-User 2024 & 2032
- Figure 39: Europe Off-Grid Solar Power Systems Industry Revenue (Million), by Country 2024 & 2032
- Figure 40: Europe Off-Grid Solar Power Systems Industry Volume (gigawatt), by Country 2024 & 2032
- Figure 41: Europe Off-Grid Solar Power Systems Industry Revenue Share (%), by Country 2024 & 2032
- Figure 42: Europe Off-Grid Solar Power Systems Industry Volume Share (%), by Country 2024 & 2032
- Figure 43: Asia Pacific Off-Grid Solar Power Systems Industry Revenue (Million), by End-User 2024 & 2032
- Figure 44: Asia Pacific Off-Grid Solar Power Systems Industry Volume (gigawatt), by End-User 2024 & 2032
- Figure 45: Asia Pacific Off-Grid Solar Power Systems Industry Revenue Share (%), by End-User 2024 & 2032
- Figure 46: Asia Pacific Off-Grid Solar Power Systems Industry Volume Share (%), by End-User 2024 & 2032
- Figure 47: Asia Pacific Off-Grid Solar Power Systems Industry Revenue (Million), by Country 2024 & 2032
- Figure 48: Asia Pacific Off-Grid Solar Power Systems Industry Volume (gigawatt), by Country 2024 & 2032
- Figure 49: Asia Pacific Off-Grid Solar Power Systems Industry Revenue Share (%), by Country 2024 & 2032
- Figure 50: Asia Pacific Off-Grid Solar Power Systems Industry Volume Share (%), by Country 2024 & 2032
- Figure 51: Middle East and Africa Off-Grid Solar Power Systems Industry Revenue (Million), by End-User 2024 & 2032
- Figure 52: Middle East and Africa Off-Grid Solar Power Systems Industry Volume (gigawatt), by End-User 2024 & 2032
- Figure 53: Middle East and Africa Off-Grid Solar Power Systems Industry Revenue Share (%), by End-User 2024 & 2032
- Figure 54: Middle East and Africa Off-Grid Solar Power Systems Industry Volume Share (%), by End-User 2024 & 2032
- Figure 55: Middle East and Africa Off-Grid Solar Power Systems Industry Revenue (Million), by Country 2024 & 2032
- Figure 56: Middle East and Africa Off-Grid Solar Power Systems Industry Volume (gigawatt), by Country 2024 & 2032
- Figure 57: Middle East and Africa Off-Grid Solar Power Systems Industry Revenue Share (%), by Country 2024 & 2032
- Figure 58: Middle East and Africa Off-Grid Solar Power Systems Industry Volume Share (%), by Country 2024 & 2032
- Figure 59: South America Off-Grid Solar Power Systems Industry Revenue (Million), by End-User 2024 & 2032
- Figure 60: South America Off-Grid Solar Power Systems Industry Volume (gigawatt), by End-User 2024 & 2032
- Figure 61: South America Off-Grid Solar Power Systems Industry Revenue Share (%), by End-User 2024 & 2032
- Figure 62: South America Off-Grid Solar Power Systems Industry Volume Share (%), by End-User 2024 & 2032
- Figure 63: South America Off-Grid Solar Power Systems Industry Revenue (Million), by Country 2024 & 2032
- Figure 64: South America Off-Grid Solar Power Systems Industry Volume (gigawatt), by Country 2024 & 2032
- Figure 65: South America Off-Grid Solar Power Systems Industry Revenue Share (%), by Country 2024 & 2032
- Figure 66: South America Off-Grid Solar Power Systems Industry Volume Share (%), by Country 2024 & 2032
List of Tables
- Table 1: Global Off-Grid Solar Power Systems Industry Revenue Million Forecast, by Region 2019 & 2032
- Table 2: Global Off-Grid Solar Power Systems Industry Volume gigawatt Forecast, by Region 2019 & 2032
- Table 3: Global Off-Grid Solar Power Systems Industry Revenue Million Forecast, by End-User 2019 & 2032
- Table 4: Global Off-Grid Solar Power Systems Industry Volume gigawatt Forecast, by End-User 2019 & 2032
- Table 5: Global Off-Grid Solar Power Systems Industry Revenue Million Forecast, by Region 2019 & 2032
- Table 6: Global Off-Grid Solar Power Systems Industry Volume gigawatt Forecast, by Region 2019 & 2032
- Table 7: Global Off-Grid Solar Power Systems Industry Revenue Million Forecast, by Country 2019 & 2032
- Table 8: Global Off-Grid Solar Power Systems Industry Volume gigawatt Forecast, by Country 2019 & 2032
- Table 9: United States Off-Grid Solar Power Systems Industry Revenue (Million) Forecast, by Application 2019 & 2032
- Table 10: United States Off-Grid Solar Power Systems Industry Volume (gigawatt) Forecast, by Application 2019 & 2032
- Table 11: Canada Off-Grid Solar Power Systems Industry Revenue (Million) Forecast, by Application 2019 & 2032
- Table 12: Canada Off-Grid Solar Power Systems Industry Volume (gigawatt) Forecast, by Application 2019 & 2032
- Table 13: Mexico Off-Grid Solar Power Systems Industry Revenue (Million) Forecast, by Application 2019 & 2032
- Table 14: Mexico Off-Grid Solar Power Systems Industry Volume (gigawatt) Forecast, by Application 2019 & 2032
- Table 15: Global Off-Grid Solar Power Systems Industry Revenue Million Forecast, by Country 2019 & 2032
- Table 16: Global Off-Grid Solar Power Systems Industry Volume gigawatt Forecast, by Country 2019 & 2032
- Table 17: Germany Off-Grid Solar Power Systems Industry Revenue (Million) Forecast, by Application 2019 & 2032
- Table 18: Germany Off-Grid Solar Power Systems Industry Volume (gigawatt) Forecast, by Application 2019 & 2032
- Table 19: United Kingdom Off-Grid Solar Power Systems Industry Revenue (Million) Forecast, by Application 2019 & 2032
- Table 20: United Kingdom Off-Grid Solar Power Systems Industry Volume (gigawatt) Forecast, by Application 2019 & 2032
- Table 21: France Off-Grid Solar Power Systems Industry Revenue (Million) Forecast, by Application 2019 & 2032
- Table 22: France Off-Grid Solar Power Systems Industry Volume (gigawatt) Forecast, by Application 2019 & 2032
- Table 23: Spain Off-Grid Solar Power Systems Industry Revenue (Million) Forecast, by Application 2019 & 2032
- Table 24: Spain Off-Grid Solar Power Systems Industry Volume (gigawatt) Forecast, by Application 2019 & 2032
- Table 25: Italy Off-Grid Solar Power Systems Industry Revenue (Million) Forecast, by Application 2019 & 2032
- Table 26: Italy Off-Grid Solar Power Systems Industry Volume (gigawatt) Forecast, by Application 2019 & 2032
- Table 27: Spain Off-Grid Solar Power Systems Industry Revenue (Million) Forecast, by Application 2019 & 2032
- Table 28: Spain Off-Grid Solar Power Systems Industry Volume (gigawatt) Forecast, by Application 2019 & 2032
- Table 29: Belgium Off-Grid Solar Power Systems Industry Revenue (Million) Forecast, by Application 2019 & 2032
- Table 30: Belgium Off-Grid Solar Power Systems Industry Volume (gigawatt) Forecast, by Application 2019 & 2032
- Table 31: Netherland Off-Grid Solar Power Systems Industry Revenue (Million) Forecast, by Application 2019 & 2032
- Table 32: Netherland Off-Grid Solar Power Systems Industry Volume (gigawatt) Forecast, by Application 2019 & 2032
- Table 33: Nordics Off-Grid Solar Power Systems Industry Revenue (Million) Forecast, by Application 2019 & 2032
- Table 34: Nordics Off-Grid Solar Power Systems Industry Volume (gigawatt) Forecast, by Application 2019 & 2032
- Table 35: Rest of Europe Off-Grid Solar Power Systems Industry Revenue (Million) Forecast, by Application 2019 & 2032
- Table 36: Rest of Europe Off-Grid Solar Power Systems Industry Volume (gigawatt) Forecast, by Application 2019 & 2032
- Table 37: Global Off-Grid Solar Power Systems Industry Revenue Million Forecast, by Country 2019 & 2032
- Table 38: Global Off-Grid Solar Power Systems Industry Volume gigawatt Forecast, by Country 2019 & 2032
- Table 39: China Off-Grid Solar Power Systems Industry Revenue (Million) Forecast, by Application 2019 & 2032
- Table 40: China Off-Grid Solar Power Systems Industry Volume (gigawatt) Forecast, by Application 2019 & 2032
- Table 41: Japan Off-Grid Solar Power Systems Industry Revenue (Million) Forecast, by Application 2019 & 2032
- Table 42: Japan Off-Grid Solar Power Systems Industry Volume (gigawatt) Forecast, by Application 2019 & 2032
- Table 43: India Off-Grid Solar Power Systems Industry Revenue (Million) Forecast, by Application 2019 & 2032
- Table 44: India Off-Grid Solar Power Systems Industry Volume (gigawatt) Forecast, by Application 2019 & 2032
- Table 45: South Korea Off-Grid Solar Power Systems Industry Revenue (Million) Forecast, by Application 2019 & 2032
- Table 46: South Korea Off-Grid Solar Power Systems Industry Volume (gigawatt) Forecast, by Application 2019 & 2032
- Table 47: Southeast Asia Off-Grid Solar Power Systems Industry Revenue (Million) Forecast, by Application 2019 & 2032
- Table 48: Southeast Asia Off-Grid Solar Power Systems Industry Volume (gigawatt) Forecast, by Application 2019 & 2032
- Table 49: Australia Off-Grid Solar Power Systems Industry Revenue (Million) Forecast, by Application 2019 & 2032
- Table 50: Australia Off-Grid Solar Power Systems Industry Volume (gigawatt) Forecast, by Application 2019 & 2032
- Table 51: Indonesia Off-Grid Solar Power Systems Industry Revenue (Million) Forecast, by Application 2019 & 2032
- Table 52: Indonesia Off-Grid Solar Power Systems Industry Volume (gigawatt) Forecast, by Application 2019 & 2032
- Table 53: Phillipes Off-Grid Solar Power Systems Industry Revenue (Million) Forecast, by Application 2019 & 2032
- Table 54: Phillipes Off-Grid Solar Power Systems Industry Volume (gigawatt) Forecast, by Application 2019 & 2032
- Table 55: Singapore Off-Grid Solar Power Systems Industry Revenue (Million) Forecast, by Application 2019 & 2032
- Table 56: Singapore Off-Grid Solar Power Systems Industry Volume (gigawatt) Forecast, by Application 2019 & 2032
- Table 57: Thailandc Off-Grid Solar Power Systems Industry Revenue (Million) Forecast, by Application 2019 & 2032
- Table 58: Thailandc Off-Grid Solar Power Systems Industry Volume (gigawatt) Forecast, by Application 2019 & 2032
- Table 59: Rest of Asia Pacific Off-Grid Solar Power Systems Industry Revenue (Million) Forecast, by Application 2019 & 2032
- Table 60: Rest of Asia Pacific Off-Grid Solar Power Systems Industry Volume (gigawatt) Forecast, by Application 2019 & 2032
- Table 61: Global Off-Grid Solar Power Systems Industry Revenue Million Forecast, by Country 2019 & 2032
- Table 62: Global Off-Grid Solar Power Systems Industry Volume gigawatt Forecast, by Country 2019 & 2032
- Table 63: Brazil Off-Grid Solar Power Systems Industry Revenue (Million) Forecast, by Application 2019 & 2032
- Table 64: Brazil Off-Grid Solar Power Systems Industry Volume (gigawatt) Forecast, by Application 2019 & 2032
- Table 65: Argentina Off-Grid Solar Power Systems Industry Revenue (Million) Forecast, by Application 2019 & 2032
- Table 66: Argentina Off-Grid Solar Power Systems Industry Volume (gigawatt) Forecast, by Application 2019 & 2032
- Table 67: Peru Off-Grid Solar Power Systems Industry Revenue (Million) Forecast, by Application 2019 & 2032
- Table 68: Peru Off-Grid Solar Power Systems Industry Volume (gigawatt) Forecast, by Application 2019 & 2032
- Table 69: Chile Off-Grid Solar Power Systems Industry Revenue (Million) Forecast, by Application 2019 & 2032
- Table 70: Chile Off-Grid Solar Power Systems Industry Volume (gigawatt) Forecast, by Application 2019 & 2032
- Table 71: Colombia Off-Grid Solar Power Systems Industry Revenue (Million) Forecast, by Application 2019 & 2032
- Table 72: Colombia Off-Grid Solar Power Systems Industry Volume (gigawatt) Forecast, by Application 2019 & 2032
- Table 73: Ecuador Off-Grid Solar Power Systems Industry Revenue (Million) Forecast, by Application 2019 & 2032
- Table 74: Ecuador Off-Grid Solar Power Systems Industry Volume (gigawatt) Forecast, by Application 2019 & 2032
- Table 75: Venezuela Off-Grid Solar Power Systems Industry Revenue (Million) Forecast, by Application 2019 & 2032
- Table 76: Venezuela Off-Grid Solar Power Systems Industry Volume (gigawatt) Forecast, by Application 2019 & 2032
- Table 77: Rest of South America Off-Grid Solar Power Systems Industry Revenue (Million) Forecast, by Application 2019 & 2032
- Table 78: Rest of South America Off-Grid Solar Power Systems Industry Volume (gigawatt) Forecast, by Application 2019 & 2032
- Table 79: Global Off-Grid Solar Power Systems Industry Revenue Million Forecast, by Country 2019 & 2032
- Table 80: Global Off-Grid Solar Power Systems Industry Volume gigawatt Forecast, by Country 2019 & 2032
- Table 81: United States Off-Grid Solar Power Systems Industry Revenue (Million) Forecast, by Application 2019 & 2032
- Table 82: United States Off-Grid Solar Power Systems Industry Volume (gigawatt) Forecast, by Application 2019 & 2032
- Table 83: Canada Off-Grid Solar Power Systems Industry Revenue (Million) Forecast, by Application 2019 & 2032
- Table 84: Canada Off-Grid Solar Power Systems Industry Volume (gigawatt) Forecast, by Application 2019 & 2032
- Table 85: Mexico Off-Grid Solar Power Systems Industry Revenue (Million) Forecast, by Application 2019 & 2032
- Table 86: Mexico Off-Grid Solar Power Systems Industry Volume (gigawatt) Forecast, by Application 2019 & 2032
- Table 87: Global Off-Grid Solar Power Systems Industry Revenue Million Forecast, by Country 2019 & 2032
- Table 88: Global Off-Grid Solar Power Systems Industry Volume gigawatt Forecast, by Country 2019 & 2032
- Table 89: United Arab Emirates Off-Grid Solar Power Systems Industry Revenue (Million) Forecast, by Application 2019 & 2032
- Table 90: United Arab Emirates Off-Grid Solar Power Systems Industry Volume (gigawatt) Forecast, by Application 2019 & 2032
- Table 91: Saudi Arabia Off-Grid Solar Power Systems Industry Revenue (Million) Forecast, by Application 2019 & 2032
- Table 92: Saudi Arabia Off-Grid Solar Power Systems Industry Volume (gigawatt) Forecast, by Application 2019 & 2032
- Table 93: South Africa Off-Grid Solar Power Systems Industry Revenue (Million) Forecast, by Application 2019 & 2032
- Table 94: South Africa Off-Grid Solar Power Systems Industry Volume (gigawatt) Forecast, by Application 2019 & 2032
- Table 95: Rest of Middle East and Africa Off-Grid Solar Power Systems Industry Revenue (Million) Forecast, by Application 2019 & 2032
- Table 96: Rest of Middle East and Africa Off-Grid Solar Power Systems Industry Volume (gigawatt) Forecast, by Application 2019 & 2032
- Table 97: Global Off-Grid Solar Power Systems Industry Revenue Million Forecast, by End-User 2019 & 2032
- Table 98: Global Off-Grid Solar Power Systems Industry Volume gigawatt Forecast, by End-User 2019 & 2032
- Table 99: Global Off-Grid Solar Power Systems Industry Revenue Million Forecast, by Country 2019 & 2032
- Table 100: Global Off-Grid Solar Power Systems Industry Volume gigawatt Forecast, by Country 2019 & 2032
- Table 101: United States Off-Grid Solar Power Systems Industry Revenue (Million) Forecast, by Application 2019 & 2032
- Table 102: United States Off-Grid Solar Power Systems Industry Volume (gigawatt) Forecast, by Application 2019 & 2032
- Table 103: Canada Off-Grid Solar Power Systems Industry Revenue (Million) Forecast, by Application 2019 & 2032
- Table 104: Canada Off-Grid Solar Power Systems Industry Volume (gigawatt) Forecast, by Application 2019 & 2032
- Table 105: Rest of North America Off-Grid Solar Power Systems Industry Revenue (Million) Forecast, by Application 2019 & 2032
- Table 106: Rest of North America Off-Grid Solar Power Systems Industry Volume (gigawatt) Forecast, by Application 2019 & 2032
- Table 107: Global Off-Grid Solar Power Systems Industry Revenue Million Forecast, by End-User 2019 & 2032
- Table 108: Global Off-Grid Solar Power Systems Industry Volume gigawatt Forecast, by End-User 2019 & 2032
- Table 109: Global Off-Grid Solar Power Systems Industry Revenue Million Forecast, by Country 2019 & 2032
- Table 110: Global Off-Grid Solar Power Systems Industry Volume gigawatt Forecast, by Country 2019 & 2032
- Table 111: Germany Off-Grid Solar Power Systems Industry Revenue (Million) Forecast, by Application 2019 & 2032
- Table 112: Germany Off-Grid Solar Power Systems Industry Volume (gigawatt) Forecast, by Application 2019 & 2032
- Table 113: France Off-Grid Solar Power Systems Industry Revenue (Million) Forecast, by Application 2019 & 2032
- Table 114: France Off-Grid Solar Power Systems Industry Volume (gigawatt) Forecast, by Application 2019 & 2032
- Table 115: Italy Off-Grid Solar Power Systems Industry Revenue (Million) Forecast, by Application 2019 & 2032
- Table 116: Italy Off-Grid Solar Power Systems Industry Volume (gigawatt) Forecast, by Application 2019 & 2032
- Table 117: United Kingdom Off-Grid Solar Power Systems Industry Revenue (Million) Forecast, by Application 2019 & 2032
- Table 118: United Kingdom Off-Grid Solar Power Systems Industry Volume (gigawatt) Forecast, by Application 2019 & 2032
- Table 119: Spain Off-Grid Solar Power Systems Industry Revenue (Million) Forecast, by Application 2019 & 2032
- Table 120: Spain Off-Grid Solar Power Systems Industry Volume (gigawatt) Forecast, by Application 2019 & 2032
- Table 121: NORDIC Off-Grid Solar Power Systems Industry Revenue (Million) Forecast, by Application 2019 & 2032
- Table 122: NORDIC Off-Grid Solar Power Systems Industry Volume (gigawatt) Forecast, by Application 2019 & 2032
- Table 123: Turkey Off-Grid Solar Power Systems Industry Revenue (Million) Forecast, by Application 2019 & 2032
- Table 124: Turkey Off-Grid Solar Power Systems Industry Volume (gigawatt) Forecast, by Application 2019 & 2032
- Table 125: Russia Off-Grid Solar Power Systems Industry Revenue (Million) Forecast, by Application 2019 & 2032
- Table 126: Russia Off-Grid Solar Power Systems Industry Volume (gigawatt) Forecast, by Application 2019 & 2032
- Table 127: Rest of Europe Off-Grid Solar Power Systems Industry Revenue (Million) Forecast, by Application 2019 & 2032
- Table 128: Rest of Europe Off-Grid Solar Power Systems Industry Volume (gigawatt) Forecast, by Application 2019 & 2032
- Table 129: Global Off-Grid Solar Power Systems Industry Revenue Million Forecast, by End-User 2019 & 2032
- Table 130: Global Off-Grid Solar Power Systems Industry Volume gigawatt Forecast, by End-User 2019 & 2032
- Table 131: Global Off-Grid Solar Power Systems Industry Revenue Million Forecast, by Country 2019 & 2032
- Table 132: Global Off-Grid Solar Power Systems Industry Volume gigawatt Forecast, by Country 2019 & 2032
- Table 133: China Off-Grid Solar Power Systems Industry Revenue (Million) Forecast, by Application 2019 & 2032
- Table 134: China Off-Grid Solar Power Systems Industry Volume (gigawatt) Forecast, by Application 2019 & 2032
- Table 135: India Off-Grid Solar Power Systems Industry Revenue (Million) Forecast, by Application 2019 & 2032
- Table 136: India Off-Grid Solar Power Systems Industry Volume (gigawatt) Forecast, by Application 2019 & 2032
- Table 137: South Korea Off-Grid Solar Power Systems Industry Revenue (Million) Forecast, by Application 2019 & 2032
- Table 138: South Korea Off-Grid Solar Power Systems Industry Volume (gigawatt) Forecast, by Application 2019 & 2032
- Table 139: Japan Off-Grid Solar Power Systems Industry Revenue (Million) Forecast, by Application 2019 & 2032
- Table 140: Japan Off-Grid Solar Power Systems Industry Volume (gigawatt) Forecast, by Application 2019 & 2032
- Table 141: Malaysia Off-Grid Solar Power Systems Industry Revenue (Million) Forecast, by Application 2019 & 2032
- Table 142: Malaysia Off-Grid Solar Power Systems Industry Volume (gigawatt) Forecast, by Application 2019 & 2032
- Table 143: Thailand Off-Grid Solar Power Systems Industry Revenue (Million) Forecast, by Application 2019 & 2032
- Table 144: Thailand Off-Grid Solar Power Systems Industry Volume (gigawatt) Forecast, by Application 2019 & 2032
- Table 145: Indonesia Off-Grid Solar Power Systems Industry Revenue (Million) Forecast, by Application 2019 & 2032
- Table 146: Indonesia Off-Grid Solar Power Systems Industry Volume (gigawatt) Forecast, by Application 2019 & 2032
- Table 147: Vietnam Off-Grid Solar Power Systems Industry Revenue (Million) Forecast, by Application 2019 & 2032
- Table 148: Vietnam Off-Grid Solar Power Systems Industry Volume (gigawatt) Forecast, by Application 2019 & 2032
- Table 149: Rest of Asia Pacific Off-Grid Solar Power Systems Industry Revenue (Million) Forecast, by Application 2019 & 2032
- Table 150: Rest of Asia Pacific Off-Grid Solar Power Systems Industry Volume (gigawatt) Forecast, by Application 2019 & 2032
- Table 151: Global Off-Grid Solar Power Systems Industry Revenue Million Forecast, by End-User 2019 & 2032
- Table 152: Global Off-Grid Solar Power Systems Industry Volume gigawatt Forecast, by End-User 2019 & 2032
- Table 153: Global Off-Grid Solar Power Systems Industry Revenue Million Forecast, by Country 2019 & 2032
- Table 154: Global Off-Grid Solar Power Systems Industry Volume gigawatt Forecast, by Country 2019 & 2032
- Table 155: Saudi Arabia Off-Grid Solar Power Systems Industry Revenue (Million) Forecast, by Application 2019 & 2032
- Table 156: Saudi Arabia Off-Grid Solar Power Systems Industry Volume (gigawatt) Forecast, by Application 2019 & 2032
- Table 157: Qatar Off-Grid Solar Power Systems Industry Revenue (Million) Forecast, by Application 2019 & 2032
- Table 158: Qatar Off-Grid Solar Power Systems Industry Volume (gigawatt) Forecast, by Application 2019 & 2032
- Table 159: South Africa Off-Grid Solar Power Systems Industry Revenue (Million) Forecast, by Application 2019 & 2032
- Table 160: South Africa Off-Grid Solar Power Systems Industry Volume (gigawatt) Forecast, by Application 2019 & 2032
- Table 161: United Arab Emirates Off-Grid Solar Power Systems Industry Revenue (Million) Forecast, by Application 2019 & 2032
- Table 162: United Arab Emirates Off-Grid Solar Power Systems Industry Volume (gigawatt) Forecast, by Application 2019 & 2032
- Table 163: Nigeria Off-Grid Solar Power Systems Industry Revenue (Million) Forecast, by Application 2019 & 2032
- Table 164: Nigeria Off-Grid Solar Power Systems Industry Volume (gigawatt) Forecast, by Application 2019 & 2032
- Table 165: Oman Off-Grid Solar Power Systems Industry Revenue (Million) Forecast, by Application 2019 & 2032
- Table 166: Oman Off-Grid Solar Power Systems Industry Volume (gigawatt) Forecast, by Application 2019 & 2032
- Table 167: Egypt Off-Grid Solar Power Systems Industry Revenue (Million) Forecast, by Application 2019 & 2032
- Table 168: Egypt Off-Grid Solar Power Systems Industry Volume (gigawatt) Forecast, by Application 2019 & 2032
- Table 169: Algeria Off-Grid Solar Power Systems Industry Revenue (Million) Forecast, by Application 2019 & 2032
- Table 170: Algeria Off-Grid Solar Power Systems Industry Volume (gigawatt) Forecast, by Application 2019 & 2032
- Table 171: Rest of Middle East and Africa Off-Grid Solar Power Systems Industry Revenue (Million) Forecast, by Application 2019 & 2032
- Table 172: Rest of Middle East and Africa Off-Grid Solar Power Systems Industry Volume (gigawatt) Forecast, by Application 2019 & 2032
- Table 173: Global Off-Grid Solar Power Systems Industry Revenue Million Forecast, by End-User 2019 & 2032
- Table 174: Global Off-Grid Solar Power Systems Industry Volume gigawatt Forecast, by End-User 2019 & 2032
- Table 175: Global Off-Grid Solar Power Systems Industry Revenue Million Forecast, by Country 2019 & 2032
- Table 176: Global Off-Grid Solar Power Systems Industry Volume gigawatt Forecast, by Country 2019 & 2032
- Table 177: Brazil Off-Grid Solar Power Systems Industry Revenue (Million) Forecast, by Application 2019 & 2032
- Table 178: Brazil Off-Grid Solar Power Systems Industry Volume (gigawatt) Forecast, by Application 2019 & 2032
- Table 179: Argentina Off-Grid Solar Power Systems Industry Revenue (Million) Forecast, by Application 2019 & 2032
- Table 180: Argentina Off-Grid Solar Power Systems Industry Volume (gigawatt) Forecast, by Application 2019 & 2032
- Table 181: Colombia Off-Grid Solar Power Systems Industry Revenue (Million) Forecast, by Application 2019 & 2032
- Table 182: Colombia Off-Grid Solar Power Systems Industry Volume (gigawatt) Forecast, by Application 2019 & 2032
- Table 183: Rest of South America Off-Grid Solar Power Systems Industry Revenue (Million) Forecast, by Application 2019 & 2032
- Table 184: Rest of South America Off-Grid Solar Power Systems Industry Volume (gigawatt) Forecast, by Application 2019 & 2032
Frequently Asked Questions
1. What is the projected Compound Annual Growth Rate (CAGR) of the Off-Grid Solar Power Systems Industry?
The projected CAGR is approximately 7.51%.
2. Which companies are prominent players in the Off-Grid Solar Power Systems Industry?
Key companies in the market include JinkoSolar Holding Co Ltd, Schneider Electric Infrastructure Ltd, LONGi Green Energy Technology Co Ltd, ABB Ltd, SunPower Corporation, Tesla Inc *List Not Exhaustive, Canadian Solar Inc, Trina Solar Ltd, Sharp Corporation, JA Solar Holding.
3. What are the main segments of the Off-Grid Solar Power Systems Industry?
The market segments include End-User.
4. Can you provide details about the market size?
The market size is estimated to be USD XX Million as of 2022.
5. What are some drivers contributing to market growth?
4.; Growth in Electric Vehicle Sales4.; Companies Investing in Commissioning New Charging Stations.
6. What are the notable trends driving market growth?
Residential Segment Expected to Dominate the Market.
7. Are there any restraints impacting market growth?
4.; The Negative Impact on the Environment.
8. Can you provide examples of recent developments in the market?
In November 2022, LONGi Solar Technology Co., Ltd. announced the delivery completion of 406MW of its bifacial PV panels Hi-MO 5, for the Solar plant developed by PowerChina SEPCO III for Saudi Arabia's Red Sea Solar PV Project. The Red Sea Project includes 400MW of solar PV and is the world's largest off-grid energy storage project.
9. What pricing options are available for accessing the report?
Pricing options include single-user, multi-user, and enterprise licenses priced at USD 4750, USD 5250, and USD 8750 respectively.
10. Is the market size provided in terms of value or volume?
The market size is provided in terms of value, measured in Million and volume, measured in gigawatt.
11. Are there any specific market keywords associated with the report?
Yes, the market keyword associated with the report is "Off-Grid Solar Power Systems Industry," which aids in identifying and referencing the specific market segment covered.
12. How do I determine which pricing option suits my needs best?
The pricing options vary based on user requirements and access needs. Individual users may opt for single-user licenses, while businesses requiring broader access may choose multi-user or enterprise licenses for cost-effective access to the report.
13. Are there any additional resources or data provided in the Off-Grid Solar Power Systems Industry report?
While the report offers comprehensive insights, it's advisable to review the specific contents or supplementary materials provided to ascertain if additional resources or data are available.
14. How can I stay updated on further developments or reports in the Off-Grid Solar Power Systems Industry?
To stay informed about further developments, trends, and reports in the Off-Grid Solar Power Systems Industry, consider subscribing to industry newsletters, following relevant companies and organizations, or regularly checking reputable industry news sources and publications.
Methodology
Step 1 - Identification of Relevant Samples Size from Population Database


Step 2 - Approaches for Defining Global Market Size (Value, Volume* & Price*)

Note*: In applicable scenarios
Step 3 - Data Sources
Primary Research
- Web Analytics
- Survey Reports
- Research Institute
- Latest Research Reports
- Opinion Leaders
Secondary Research
- Annual Reports
- White Paper
- Latest Press Release
- Industry Association
- Paid Database
- Investor Presentations

Step 4 - Data Triangulation
Involves using different sources of information in order to increase the validity of a study
These sources are likely to be stakeholders in a program - participants, other researchers, program staff, other community members, and so on.
Then we put all data in single framework & apply various statistical tools to find out the dynamic on the market.
During the analysis stage, feedback from the stakeholder groups would be compared to determine areas of agreement as well as areas of divergence
