

Key Insights
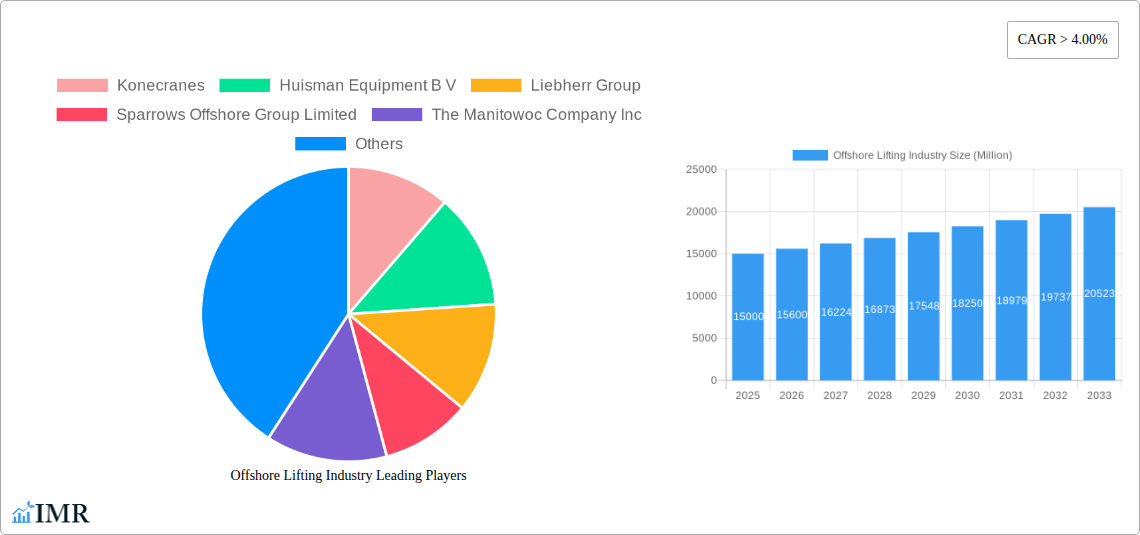
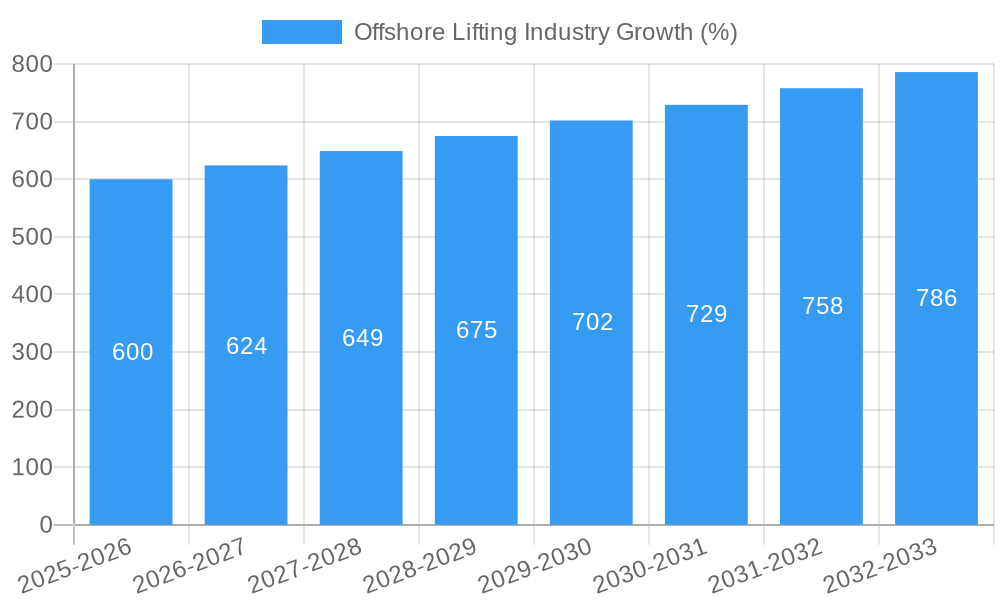
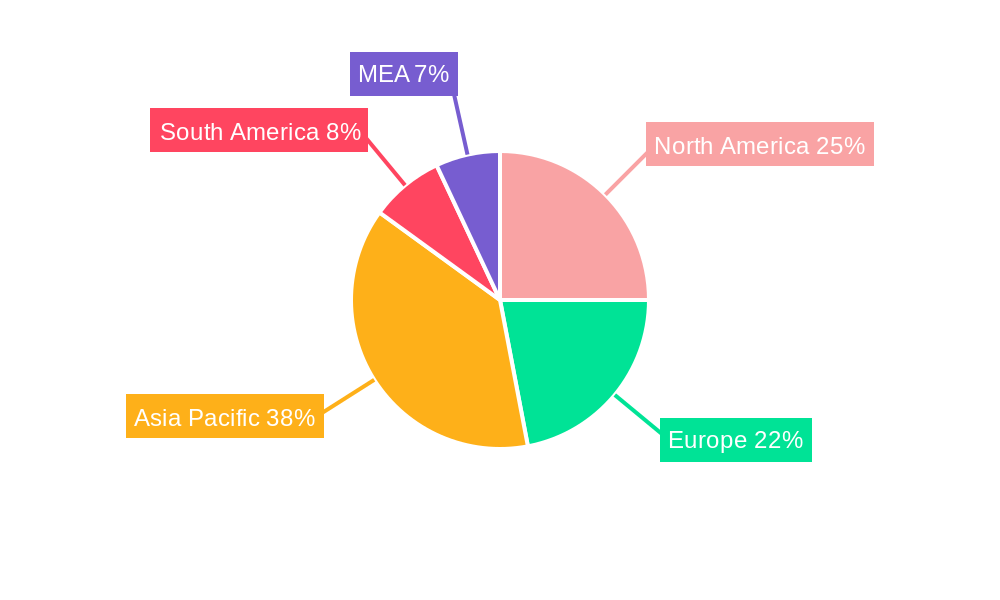
The offshore lifting industry, valued at approximately $XX million in 2025, is experiencing robust growth, projected to expand at a CAGR exceeding 4.00% from 2025 to 2033. This growth is primarily driven by the burgeoning renewable energy sector, particularly offshore wind farm construction, which necessitates heavy-duty lifting equipment for turbine installation and maintenance. The oil and gas industry, while experiencing some cyclical fluctuations, continues to contribute significantly to market demand, especially for specialized cranes capable of handling subsea infrastructure. Technological advancements, such as the development of more efficient and environmentally friendly lifting solutions, further propel market expansion. Key segments driving growth include board offshore cranes, knuckle boom cranes, and telescopic boom cranes, with the highest demand concentrated in the 500-2,000 MT lifting capacity range. Geographic growth is expected to be strongest in Asia-Pacific, fueled by significant investments in offshore wind and ongoing expansion of oil and gas activities in the region.
However, the market faces certain restraints. Fluctuations in oil prices directly impact investment in the oil and gas sector, potentially slowing down demand for offshore lifting equipment. Stringent safety regulations and environmental concerns associated with offshore operations add to the operational costs and complexity. Furthermore, competition among established players like Konecranes, Liebherr Group, and Manitowoc, alongside emerging players, creates a dynamic and potentially price-sensitive market environment. To mitigate these challenges, companies are focusing on innovation, offering customized solutions, and prioritizing cost optimization strategies to maintain profitability and market share. The long-term outlook, however, remains positive, given the sustained growth of renewable energy and the continuing need for offshore infrastructure maintenance and development across various sectors.
Offshore Lifting Industry Market Report: 2019-2033
This comprehensive report provides an in-depth analysis of the offshore lifting industry, encompassing market dynamics, growth trends, regional dominance, product landscape, key players, and future outlook. With a study period spanning 2019-2033, a base year of 2025, and a forecast period of 2025-2033, this report is an essential resource for industry professionals, investors, and strategic decision-makers. The report segments the market by type (Board offshore cranes, Knuckle Boom Crane, Telescopic Boom Crane, Lattice Boom Crane, Luffing Crane, Others), lifting capacity (0-500 MT, 500-2,000 MT, 2,000-5,000 MT, Above 5,000 MT), and application (Oil and Gas, Marine, Renewable Energy, Other Applications). The market size is expected to reach xx Million by 2033.
Offshore Lifting Industry Market Dynamics & Structure
The offshore lifting industry is characterized by moderate market concentration, with a few major players holding significant market share. Technological innovation, particularly in electric and hydraulic systems, is a key driver, alongside stringent safety regulations and environmental concerns. The industry faces competition from alternative lifting solutions and is subject to mergers and acquisitions (M&A) activity. The renewable energy sector, particularly offshore wind, is a significant growth engine.
- Market Concentration: The top 5 players account for approximately xx% of the market share in 2025.
- Technological Innovation: Focus on efficiency, safety, and reduced environmental impact drives R&D efforts. Examples include electric cranes and remote operation capabilities.
- Regulatory Framework: Stringent safety standards and environmental regulations influence design and operation.
- Competitive Product Substitutes: Alternative lifting technologies and methods pose some level of competitive pressure.
- End-User Demographics: The industry serves diverse end-users including oil & gas companies, marine contractors, and renewable energy developers.
- M&A Trends: A moderate number of M&A deals are observed, mostly focused on consolidating market share and acquiring specialized technologies (xx deals in the last 5 years).
Offshore Lifting Industry Growth Trends & Insights
The offshore lifting industry is experiencing steady growth, driven by the expansion of offshore wind energy, the increasing demand for offshore oil and gas extraction, and the growing global maritime sector. Technological advancements, such as the integration of automation and digitalization, further enhance efficiency and safety, fueling market expansion. The market exhibits a compound annual growth rate (CAGR) of xx% during the forecast period (2025-2033). Market penetration in the renewable energy sector is expected to significantly increase, reaching xx% by 2033. Consumer behavior shifts towards sustainable and efficient lifting solutions are also driving growth.
Dominant Regions, Countries, or Segments in Offshore Lifting Industry
The North Sea region holds a dominant position in the offshore lifting industry, driven by significant investments in offshore wind energy projects. Asia-Pacific is also showing robust growth potential due to the expanding offshore oil & gas sector and increasing investments in marine infrastructure. Within the segment breakdown, the 500-2,000 MT lifting capacity segment and the knuckle boom crane type currently dominate, but the demand for higher capacity cranes in the renewable energy sector is driving growth in the 2,000-5,000 MT and above 5,000 MT segments.
- Key Regional Drivers:
- North Sea: High concentration of offshore wind farms and oil & gas platforms.
- Asia-Pacific: Expansion of offshore oil & gas and marine infrastructure.
- Dominant Segments:
- Lifting Capacity: 500-2,000 MT (xx% market share in 2025)
- Type: Knuckle Boom Crane (xx% market share in 2025)
Offshore Lifting Industry Product Landscape
The offshore lifting industry offers a diverse range of cranes, each catering to specific needs and applications. Recent innovations focus on enhanced safety features, improved efficiency, and reduced environmental impact. Electric and hybrid drive systems, advanced control systems, and remote operation capabilities are prominent technological advancements. Unique selling propositions include increased lifting capacity, improved precision, and reduced maintenance requirements.
Key Drivers, Barriers & Challenges in Offshore Lifting Industry
Key Drivers:
- Increasing demand from the renewable energy sector (especially offshore wind).
- Expansion of the offshore oil and gas industry.
- Growing global maritime sector.
- Technological advancements driving efficiency and safety.
Key Challenges:
- High initial investment costs for advanced crane systems.
- Stringent safety and environmental regulations.
- Dependence on global supply chains which may be subject to disruption.
- Intense competition among established players.
Emerging Opportunities in Offshore Lifting Industry
- Growth in the offshore wind energy sector presents significant opportunities for specialized cranes.
- Increasing adoption of automation and digitalization in crane operations.
- Development of sustainable and eco-friendly crane technologies.
- Expansion into emerging markets with growing infrastructure needs.
Growth Accelerators in the Offshore Lifting Industry
Technological advancements, such as the development of electrically powered cranes and autonomous control systems, are key drivers of growth. Strategic partnerships and collaborations among industry players further accelerate innovation and market penetration. Expansion into new geographic regions and diversification into new applications, like subsea construction, are also important growth catalysts.
Key Players Shaping the Offshore Lifting Industry Market
- Konecranes
- Huisman Equipment B V
- Liebherr Group
- Sparrows Offshore Group Limited
- The Manitowoc Company Inc
- Seatrax Inc
- Cargotec Corporation
- Heila Cranes SpA
- NOV Inc
- Kenz Figee Group
Notable Milestones in Offshore Lifting Industry Sector
- November 2021: KenzFigee signs a contract to develop an electric hydraulic ram luffing offshore crane for the Sofia offshore wind farm.
- February 2022: Sparrows Group secures a three-year contract for crane operations and maintenance services on the Bruce platform in the North Sea.
In-Depth Offshore Lifting Industry Market Outlook
The offshore lifting industry is poised for sustained growth, driven by the expanding renewable energy sector and ongoing investments in offshore oil and gas. Strategic partnerships, technological innovation, and expansion into new geographical markets will be crucial for achieving long-term success. The market is expected to witness strong growth across different segments, driven primarily by the rising demand for high-capacity cranes in the offshore wind and marine industries. This will create significant opportunities for market participants to capitalize on the burgeoning industry growth.
Offshore Lifting Industry Segmentation
-
1. Type
- 1.1. Board offshore cranes
- 1.2. Knuckle Boom Crane
- 1.3. Telescopic Boom Crane
- 1.4. Lattice Boom Crane
- 1.5. Luffing Crane
- 1.6. Others
-
2. Lifting Capacity
- 2.1. 0 - 500 MT
- 2.2. 500 - 2,000 MT
- 2.3. 2,000 - 5,000 MT
- 2.4. Above 5,000 MT
-
3. Application
- 3.1. Oil and Gas
- 3.2. Marine
- 3.3. Renewable Energy
- 3.4. Other Applications
Offshore Lifting Industry Segmentation By Geography
- 1. North America
- 2. Europe
- 3. Asia Pacific
- 4. South America
- 5. Middle East and Africa
Offshore Lifting Industry REPORT HIGHLIGHTS
| Aspects | Details |
|---|---|
| Study Period | 2019-2033 |
| Base Year | 2024 |
| Estimated Year | 2025 |
| Forecast Period | 2025-2033 |
| Historical Period | 2019-2024 |
| Growth Rate | CAGR of > 4.00% from 2019-2033 |
| Segmentation |
|
Table of Contents
- 1. Introduction
- 1.1. Research Scope
- 1.2. Market Segmentation
- 1.3. Research Methodology
- 1.4. Definitions and Assumptions
- 2. Executive Summary
- 2.1. Introduction
- 3. Market Dynamics
- 3.1. Introduction
- 3.2. Market Drivers
- 3.2.1. Increased Focus on Renewable Power Generation4.; Rising Need for Efficient Power Generation
- 3.3. Market Restrains
- 3.3.1. High Initial Capital Investment
- 3.4. Market Trends
- 3.4.1. Oil and Gas Segment to Dominate the Market
- 4. Market Factor Analysis
- 4.1. Porters Five Forces
- 4.2. Supply/Value Chain
- 4.3. PESTEL analysis
- 4.4. Market Entropy
- 4.5. Patent/Trademark Analysis
- 5. Global Offshore Lifting Industry Analysis, Insights and Forecast, 2019-2031
- 5.1. Market Analysis, Insights and Forecast - by Type
- 5.1.1. Board offshore cranes
- 5.1.2. Knuckle Boom Crane
- 5.1.3. Telescopic Boom Crane
- 5.1.4. Lattice Boom Crane
- 5.1.5. Luffing Crane
- 5.1.6. Others
- 5.2. Market Analysis, Insights and Forecast - by Lifting Capacity
- 5.2.1. 0 - 500 MT
- 5.2.2. 500 - 2,000 MT
- 5.2.3. 2,000 - 5,000 MT
- 5.2.4. Above 5,000 MT
- 5.3. Market Analysis, Insights and Forecast - by Application
- 5.3.1. Oil and Gas
- 5.3.2. Marine
- 5.3.3. Renewable Energy
- 5.3.4. Other Applications
- 5.4. Market Analysis, Insights and Forecast - by Region
- 5.4.1. North America
- 5.4.2. Europe
- 5.4.3. Asia Pacific
- 5.4.4. South America
- 5.4.5. Middle East and Africa
- 5.1. Market Analysis, Insights and Forecast - by Type
- 6. North America Offshore Lifting Industry Analysis, Insights and Forecast, 2019-2031
- 6.1. Market Analysis, Insights and Forecast - by Type
- 6.1.1. Board offshore cranes
- 6.1.2. Knuckle Boom Crane
- 6.1.3. Telescopic Boom Crane
- 6.1.4. Lattice Boom Crane
- 6.1.5. Luffing Crane
- 6.1.6. Others
- 6.2. Market Analysis, Insights and Forecast - by Lifting Capacity
- 6.2.1. 0 - 500 MT
- 6.2.2. 500 - 2,000 MT
- 6.2.3. 2,000 - 5,000 MT
- 6.2.4. Above 5,000 MT
- 6.3. Market Analysis, Insights and Forecast - by Application
- 6.3.1. Oil and Gas
- 6.3.2. Marine
- 6.3.3. Renewable Energy
- 6.3.4. Other Applications
- 6.1. Market Analysis, Insights and Forecast - by Type
- 7. Europe Offshore Lifting Industry Analysis, Insights and Forecast, 2019-2031
- 7.1. Market Analysis, Insights and Forecast - by Type
- 7.1.1. Board offshore cranes
- 7.1.2. Knuckle Boom Crane
- 7.1.3. Telescopic Boom Crane
- 7.1.4. Lattice Boom Crane
- 7.1.5. Luffing Crane
- 7.1.6. Others
- 7.2. Market Analysis, Insights and Forecast - by Lifting Capacity
- 7.2.1. 0 - 500 MT
- 7.2.2. 500 - 2,000 MT
- 7.2.3. 2,000 - 5,000 MT
- 7.2.4. Above 5,000 MT
- 7.3. Market Analysis, Insights and Forecast - by Application
- 7.3.1. Oil and Gas
- 7.3.2. Marine
- 7.3.3. Renewable Energy
- 7.3.4. Other Applications
- 7.1. Market Analysis, Insights and Forecast - by Type
- 8. Asia Pacific Offshore Lifting Industry Analysis, Insights and Forecast, 2019-2031
- 8.1. Market Analysis, Insights and Forecast - by Type
- 8.1.1. Board offshore cranes
- 8.1.2. Knuckle Boom Crane
- 8.1.3. Telescopic Boom Crane
- 8.1.4. Lattice Boom Crane
- 8.1.5. Luffing Crane
- 8.1.6. Others
- 8.2. Market Analysis, Insights and Forecast - by Lifting Capacity
- 8.2.1. 0 - 500 MT
- 8.2.2. 500 - 2,000 MT
- 8.2.3. 2,000 - 5,000 MT
- 8.2.4. Above 5,000 MT
- 8.3. Market Analysis, Insights and Forecast - by Application
- 8.3.1. Oil and Gas
- 8.3.2. Marine
- 8.3.3. Renewable Energy
- 8.3.4. Other Applications
- 8.1. Market Analysis, Insights and Forecast - by Type
- 9. South America Offshore Lifting Industry Analysis, Insights and Forecast, 2019-2031
- 9.1. Market Analysis, Insights and Forecast - by Type
- 9.1.1. Board offshore cranes
- 9.1.2. Knuckle Boom Crane
- 9.1.3. Telescopic Boom Crane
- 9.1.4. Lattice Boom Crane
- 9.1.5. Luffing Crane
- 9.1.6. Others
- 9.2. Market Analysis, Insights and Forecast - by Lifting Capacity
- 9.2.1. 0 - 500 MT
- 9.2.2. 500 - 2,000 MT
- 9.2.3. 2,000 - 5,000 MT
- 9.2.4. Above 5,000 MT
- 9.3. Market Analysis, Insights and Forecast - by Application
- 9.3.1. Oil and Gas
- 9.3.2. Marine
- 9.3.3. Renewable Energy
- 9.3.4. Other Applications
- 9.1. Market Analysis, Insights and Forecast - by Type
- 10. Middle East and Africa Offshore Lifting Industry Analysis, Insights and Forecast, 2019-2031
- 10.1. Market Analysis, Insights and Forecast - by Type
- 10.1.1. Board offshore cranes
- 10.1.2. Knuckle Boom Crane
- 10.1.3. Telescopic Boom Crane
- 10.1.4. Lattice Boom Crane
- 10.1.5. Luffing Crane
- 10.1.6. Others
- 10.2. Market Analysis, Insights and Forecast - by Lifting Capacity
- 10.2.1. 0 - 500 MT
- 10.2.2. 500 - 2,000 MT
- 10.2.3. 2,000 - 5,000 MT
- 10.2.4. Above 5,000 MT
- 10.3. Market Analysis, Insights and Forecast - by Application
- 10.3.1. Oil and Gas
- 10.3.2. Marine
- 10.3.3. Renewable Energy
- 10.3.4. Other Applications
- 10.1. Market Analysis, Insights and Forecast - by Type
- 11. North America Offshore Lifting Industry Analysis, Insights and Forecast, 2019-2031
- 11.1. Market Analysis, Insights and Forecast - By Country/Sub-region
- 11.1.1 United States
- 11.1.2 Canada
- 11.1.3 Mexico
- 12. Europe Offshore Lifting Industry Analysis, Insights and Forecast, 2019-2031
- 12.1. Market Analysis, Insights and Forecast - By Country/Sub-region
- 12.1.1 Germany
- 12.1.2 United Kingdom
- 12.1.3 France
- 12.1.4 Spain
- 12.1.5 Italy
- 12.1.6 Spain
- 12.1.7 Belgium
- 12.1.8 Netherland
- 12.1.9 Nordics
- 12.1.10 Rest of Europe
- 13. Asia Pacific Offshore Lifting Industry Analysis, Insights and Forecast, 2019-2031
- 13.1. Market Analysis, Insights and Forecast - By Country/Sub-region
- 13.1.1 China
- 13.1.2 Japan
- 13.1.3 India
- 13.1.4 South Korea
- 13.1.5 Southeast Asia
- 13.1.6 Australia
- 13.1.7 Indonesia
- 13.1.8 Phillipes
- 13.1.9 Singapore
- 13.1.10 Thailandc
- 13.1.11 Rest of Asia Pacific
- 14. South America Offshore Lifting Industry Analysis, Insights and Forecast, 2019-2031
- 14.1. Market Analysis, Insights and Forecast - By Country/Sub-region
- 14.1.1 Brazil
- 14.1.2 Argentina
- 14.1.3 Peru
- 14.1.4 Chile
- 14.1.5 Colombia
- 14.1.6 Ecuador
- 14.1.7 Venezuela
- 14.1.8 Rest of South America
- 15. MEA Offshore Lifting Industry Analysis, Insights and Forecast, 2019-2031
- 15.1. Market Analysis, Insights and Forecast - By Country/Sub-region
- 15.1.1 United Arab Emirates
- 15.1.2 Saudi Arabia
- 15.1.3 South Africa
- 15.1.4 Rest of Middle East and Africa
- 16. Competitive Analysis
- 16.1. Global Market Share Analysis 2024
- 16.2. Company Profiles
- 16.2.1 Konecranes
- 16.2.1.1. Overview
- 16.2.1.2. Products
- 16.2.1.3. SWOT Analysis
- 16.2.1.4. Recent Developments
- 16.2.1.5. Financials (Based on Availability)
- 16.2.2 Huisman Equipment B V
- 16.2.2.1. Overview
- 16.2.2.2. Products
- 16.2.2.3. SWOT Analysis
- 16.2.2.4. Recent Developments
- 16.2.2.5. Financials (Based on Availability)
- 16.2.3 Liebherr Group
- 16.2.3.1. Overview
- 16.2.3.2. Products
- 16.2.3.3. SWOT Analysis
- 16.2.3.4. Recent Developments
- 16.2.3.5. Financials (Based on Availability)
- 16.2.4 Sparrows Offshore Group Limited
- 16.2.4.1. Overview
- 16.2.4.2. Products
- 16.2.4.3. SWOT Analysis
- 16.2.4.4. Recent Developments
- 16.2.4.5. Financials (Based on Availability)
- 16.2.5 The Manitowoc Company Inc
- 16.2.5.1. Overview
- 16.2.5.2. Products
- 16.2.5.3. SWOT Analysis
- 16.2.5.4. Recent Developments
- 16.2.5.5. Financials (Based on Availability)
- 16.2.6 Seatrax Inc
- 16.2.6.1. Overview
- 16.2.6.2. Products
- 16.2.6.3. SWOT Analysis
- 16.2.6.4. Recent Developments
- 16.2.6.5. Financials (Based on Availability)
- 16.2.7 Cargotec Corporation
- 16.2.7.1. Overview
- 16.2.7.2. Products
- 16.2.7.3. SWOT Analysis
- 16.2.7.4. Recent Developments
- 16.2.7.5. Financials (Based on Availability)
- 16.2.8 Heila Cranes SpA
- 16.2.8.1. Overview
- 16.2.8.2. Products
- 16.2.8.3. SWOT Analysis
- 16.2.8.4. Recent Developments
- 16.2.8.5. Financials (Based on Availability)
- 16.2.9 NOV Inc
- 16.2.9.1. Overview
- 16.2.9.2. Products
- 16.2.9.3. SWOT Analysis
- 16.2.9.4. Recent Developments
- 16.2.9.5. Financials (Based on Availability)
- 16.2.10 Kenz Figee Group
- 16.2.10.1. Overview
- 16.2.10.2. Products
- 16.2.10.3. SWOT Analysis
- 16.2.10.4. Recent Developments
- 16.2.10.5. Financials (Based on Availability)
- 16.2.1 Konecranes
List of Figures
- Figure 1: Global Offshore Lifting Industry Revenue Breakdown (Million, %) by Region 2024 & 2032
- Figure 2: North America Offshore Lifting Industry Revenue (Million), by Country 2024 & 2032
- Figure 3: North America Offshore Lifting Industry Revenue Share (%), by Country 2024 & 2032
- Figure 4: Europe Offshore Lifting Industry Revenue (Million), by Country 2024 & 2032
- Figure 5: Europe Offshore Lifting Industry Revenue Share (%), by Country 2024 & 2032
- Figure 6: Asia Pacific Offshore Lifting Industry Revenue (Million), by Country 2024 & 2032
- Figure 7: Asia Pacific Offshore Lifting Industry Revenue Share (%), by Country 2024 & 2032
- Figure 8: South America Offshore Lifting Industry Revenue (Million), by Country 2024 & 2032
- Figure 9: South America Offshore Lifting Industry Revenue Share (%), by Country 2024 & 2032
- Figure 10: MEA Offshore Lifting Industry Revenue (Million), by Country 2024 & 2032
- Figure 11: MEA Offshore Lifting Industry Revenue Share (%), by Country 2024 & 2032
- Figure 12: North America Offshore Lifting Industry Revenue (Million), by Type 2024 & 2032
- Figure 13: North America Offshore Lifting Industry Revenue Share (%), by Type 2024 & 2032
- Figure 14: North America Offshore Lifting Industry Revenue (Million), by Lifting Capacity 2024 & 2032
- Figure 15: North America Offshore Lifting Industry Revenue Share (%), by Lifting Capacity 2024 & 2032
- Figure 16: North America Offshore Lifting Industry Revenue (Million), by Application 2024 & 2032
- Figure 17: North America Offshore Lifting Industry Revenue Share (%), by Application 2024 & 2032
- Figure 18: North America Offshore Lifting Industry Revenue (Million), by Country 2024 & 2032
- Figure 19: North America Offshore Lifting Industry Revenue Share (%), by Country 2024 & 2032
- Figure 20: Europe Offshore Lifting Industry Revenue (Million), by Type 2024 & 2032
- Figure 21: Europe Offshore Lifting Industry Revenue Share (%), by Type 2024 & 2032
- Figure 22: Europe Offshore Lifting Industry Revenue (Million), by Lifting Capacity 2024 & 2032
- Figure 23: Europe Offshore Lifting Industry Revenue Share (%), by Lifting Capacity 2024 & 2032
- Figure 24: Europe Offshore Lifting Industry Revenue (Million), by Application 2024 & 2032
- Figure 25: Europe Offshore Lifting Industry Revenue Share (%), by Application 2024 & 2032
- Figure 26: Europe Offshore Lifting Industry Revenue (Million), by Country 2024 & 2032
- Figure 27: Europe Offshore Lifting Industry Revenue Share (%), by Country 2024 & 2032
- Figure 28: Asia Pacific Offshore Lifting Industry Revenue (Million), by Type 2024 & 2032
- Figure 29: Asia Pacific Offshore Lifting Industry Revenue Share (%), by Type 2024 & 2032
- Figure 30: Asia Pacific Offshore Lifting Industry Revenue (Million), by Lifting Capacity 2024 & 2032
- Figure 31: Asia Pacific Offshore Lifting Industry Revenue Share (%), by Lifting Capacity 2024 & 2032
- Figure 32: Asia Pacific Offshore Lifting Industry Revenue (Million), by Application 2024 & 2032
- Figure 33: Asia Pacific Offshore Lifting Industry Revenue Share (%), by Application 2024 & 2032
- Figure 34: Asia Pacific Offshore Lifting Industry Revenue (Million), by Country 2024 & 2032
- Figure 35: Asia Pacific Offshore Lifting Industry Revenue Share (%), by Country 2024 & 2032
- Figure 36: South America Offshore Lifting Industry Revenue (Million), by Type 2024 & 2032
- Figure 37: South America Offshore Lifting Industry Revenue Share (%), by Type 2024 & 2032
- Figure 38: South America Offshore Lifting Industry Revenue (Million), by Lifting Capacity 2024 & 2032
- Figure 39: South America Offshore Lifting Industry Revenue Share (%), by Lifting Capacity 2024 & 2032
- Figure 40: South America Offshore Lifting Industry Revenue (Million), by Application 2024 & 2032
- Figure 41: South America Offshore Lifting Industry Revenue Share (%), by Application 2024 & 2032
- Figure 42: South America Offshore Lifting Industry Revenue (Million), by Country 2024 & 2032
- Figure 43: South America Offshore Lifting Industry Revenue Share (%), by Country 2024 & 2032
- Figure 44: Middle East and Africa Offshore Lifting Industry Revenue (Million), by Type 2024 & 2032
- Figure 45: Middle East and Africa Offshore Lifting Industry Revenue Share (%), by Type 2024 & 2032
- Figure 46: Middle East and Africa Offshore Lifting Industry Revenue (Million), by Lifting Capacity 2024 & 2032
- Figure 47: Middle East and Africa Offshore Lifting Industry Revenue Share (%), by Lifting Capacity 2024 & 2032
- Figure 48: Middle East and Africa Offshore Lifting Industry Revenue (Million), by Application 2024 & 2032
- Figure 49: Middle East and Africa Offshore Lifting Industry Revenue Share (%), by Application 2024 & 2032
- Figure 50: Middle East and Africa Offshore Lifting Industry Revenue (Million), by Country 2024 & 2032
- Figure 51: Middle East and Africa Offshore Lifting Industry Revenue Share (%), by Country 2024 & 2032
List of Tables
- Table 1: Global Offshore Lifting Industry Revenue Million Forecast, by Region 2019 & 2032
- Table 2: Global Offshore Lifting Industry Revenue Million Forecast, by Type 2019 & 2032
- Table 3: Global Offshore Lifting Industry Revenue Million Forecast, by Lifting Capacity 2019 & 2032
- Table 4: Global Offshore Lifting Industry Revenue Million Forecast, by Application 2019 & 2032
- Table 5: Global Offshore Lifting Industry Revenue Million Forecast, by Region 2019 & 2032
- Table 6: Global Offshore Lifting Industry Revenue Million Forecast, by Country 2019 & 2032
- Table 7: United States Offshore Lifting Industry Revenue (Million) Forecast, by Application 2019 & 2032
- Table 8: Canada Offshore Lifting Industry Revenue (Million) Forecast, by Application 2019 & 2032
- Table 9: Mexico Offshore Lifting Industry Revenue (Million) Forecast, by Application 2019 & 2032
- Table 10: Global Offshore Lifting Industry Revenue Million Forecast, by Country 2019 & 2032
- Table 11: Germany Offshore Lifting Industry Revenue (Million) Forecast, by Application 2019 & 2032
- Table 12: United Kingdom Offshore Lifting Industry Revenue (Million) Forecast, by Application 2019 & 2032
- Table 13: France Offshore Lifting Industry Revenue (Million) Forecast, by Application 2019 & 2032
- Table 14: Spain Offshore Lifting Industry Revenue (Million) Forecast, by Application 2019 & 2032
- Table 15: Italy Offshore Lifting Industry Revenue (Million) Forecast, by Application 2019 & 2032
- Table 16: Spain Offshore Lifting Industry Revenue (Million) Forecast, by Application 2019 & 2032
- Table 17: Belgium Offshore Lifting Industry Revenue (Million) Forecast, by Application 2019 & 2032
- Table 18: Netherland Offshore Lifting Industry Revenue (Million) Forecast, by Application 2019 & 2032
- Table 19: Nordics Offshore Lifting Industry Revenue (Million) Forecast, by Application 2019 & 2032
- Table 20: Rest of Europe Offshore Lifting Industry Revenue (Million) Forecast, by Application 2019 & 2032
- Table 21: Global Offshore Lifting Industry Revenue Million Forecast, by Country 2019 & 2032
- Table 22: China Offshore Lifting Industry Revenue (Million) Forecast, by Application 2019 & 2032
- Table 23: Japan Offshore Lifting Industry Revenue (Million) Forecast, by Application 2019 & 2032
- Table 24: India Offshore Lifting Industry Revenue (Million) Forecast, by Application 2019 & 2032
- Table 25: South Korea Offshore Lifting Industry Revenue (Million) Forecast, by Application 2019 & 2032
- Table 26: Southeast Asia Offshore Lifting Industry Revenue (Million) Forecast, by Application 2019 & 2032
- Table 27: Australia Offshore Lifting Industry Revenue (Million) Forecast, by Application 2019 & 2032
- Table 28: Indonesia Offshore Lifting Industry Revenue (Million) Forecast, by Application 2019 & 2032
- Table 29: Phillipes Offshore Lifting Industry Revenue (Million) Forecast, by Application 2019 & 2032
- Table 30: Singapore Offshore Lifting Industry Revenue (Million) Forecast, by Application 2019 & 2032
- Table 31: Thailandc Offshore Lifting Industry Revenue (Million) Forecast, by Application 2019 & 2032
- Table 32: Rest of Asia Pacific Offshore Lifting Industry Revenue (Million) Forecast, by Application 2019 & 2032
- Table 33: Global Offshore Lifting Industry Revenue Million Forecast, by Country 2019 & 2032
- Table 34: Brazil Offshore Lifting Industry Revenue (Million) Forecast, by Application 2019 & 2032
- Table 35: Argentina Offshore Lifting Industry Revenue (Million) Forecast, by Application 2019 & 2032
- Table 36: Peru Offshore Lifting Industry Revenue (Million) Forecast, by Application 2019 & 2032
- Table 37: Chile Offshore Lifting Industry Revenue (Million) Forecast, by Application 2019 & 2032
- Table 38: Colombia Offshore Lifting Industry Revenue (Million) Forecast, by Application 2019 & 2032
- Table 39: Ecuador Offshore Lifting Industry Revenue (Million) Forecast, by Application 2019 & 2032
- Table 40: Venezuela Offshore Lifting Industry Revenue (Million) Forecast, by Application 2019 & 2032
- Table 41: Rest of South America Offshore Lifting Industry Revenue (Million) Forecast, by Application 2019 & 2032
- Table 42: Global Offshore Lifting Industry Revenue Million Forecast, by Country 2019 & 2032
- Table 43: United Arab Emirates Offshore Lifting Industry Revenue (Million) Forecast, by Application 2019 & 2032
- Table 44: Saudi Arabia Offshore Lifting Industry Revenue (Million) Forecast, by Application 2019 & 2032
- Table 45: South Africa Offshore Lifting Industry Revenue (Million) Forecast, by Application 2019 & 2032
- Table 46: Rest of Middle East and Africa Offshore Lifting Industry Revenue (Million) Forecast, by Application 2019 & 2032
- Table 47: Global Offshore Lifting Industry Revenue Million Forecast, by Type 2019 & 2032
- Table 48: Global Offshore Lifting Industry Revenue Million Forecast, by Lifting Capacity 2019 & 2032
- Table 49: Global Offshore Lifting Industry Revenue Million Forecast, by Application 2019 & 2032
- Table 50: Global Offshore Lifting Industry Revenue Million Forecast, by Country 2019 & 2032
- Table 51: Global Offshore Lifting Industry Revenue Million Forecast, by Type 2019 & 2032
- Table 52: Global Offshore Lifting Industry Revenue Million Forecast, by Lifting Capacity 2019 & 2032
- Table 53: Global Offshore Lifting Industry Revenue Million Forecast, by Application 2019 & 2032
- Table 54: Global Offshore Lifting Industry Revenue Million Forecast, by Country 2019 & 2032
- Table 55: Global Offshore Lifting Industry Revenue Million Forecast, by Type 2019 & 2032
- Table 56: Global Offshore Lifting Industry Revenue Million Forecast, by Lifting Capacity 2019 & 2032
- Table 57: Global Offshore Lifting Industry Revenue Million Forecast, by Application 2019 & 2032
- Table 58: Global Offshore Lifting Industry Revenue Million Forecast, by Country 2019 & 2032
- Table 59: Global Offshore Lifting Industry Revenue Million Forecast, by Type 2019 & 2032
- Table 60: Global Offshore Lifting Industry Revenue Million Forecast, by Lifting Capacity 2019 & 2032
- Table 61: Global Offshore Lifting Industry Revenue Million Forecast, by Application 2019 & 2032
- Table 62: Global Offshore Lifting Industry Revenue Million Forecast, by Country 2019 & 2032
- Table 63: Global Offshore Lifting Industry Revenue Million Forecast, by Type 2019 & 2032
- Table 64: Global Offshore Lifting Industry Revenue Million Forecast, by Lifting Capacity 2019 & 2032
- Table 65: Global Offshore Lifting Industry Revenue Million Forecast, by Application 2019 & 2032
- Table 66: Global Offshore Lifting Industry Revenue Million Forecast, by Country 2019 & 2032
Frequently Asked Questions
1. What is the projected Compound Annual Growth Rate (CAGR) of the Offshore Lifting Industry?
The projected CAGR is approximately > 4.00%.
2. Which companies are prominent players in the Offshore Lifting Industry?
Key companies in the market include Konecranes, Huisman Equipment B V, Liebherr Group, Sparrows Offshore Group Limited, The Manitowoc Company Inc, Seatrax Inc, Cargotec Corporation, Heila Cranes SpA, NOV Inc, Kenz Figee Group.
3. What are the main segments of the Offshore Lifting Industry?
The market segments include Type, Lifting Capacity, Application.
4. Can you provide details about the market size?
The market size is estimated to be USD XX Million as of 2022.
5. What are some drivers contributing to market growth?
Increased Focus on Renewable Power Generation4.; Rising Need for Efficient Power Generation.
6. What are the notable trends driving market growth?
Oil and Gas Segment to Dominate the Market.
7. Are there any restraints impacting market growth?
High Initial Capital Investment.
8. Can you provide examples of recent developments in the market?
In November 2021, KenzFigee signed a contract with Iv-Offshore and Energy to develop an electric hydraulic ram luffing offshore crane. The crane will be installed on an HVDC (High Voltage Direct Current) offshore converter platform on a Sofia offshore wind farm situated on Dogger Bank in the North Sea.
9. What pricing options are available for accessing the report?
Pricing options include single-user, multi-user, and enterprise licenses priced at USD 4750, USD 5250, and USD 8750 respectively.
10. Is the market size provided in terms of value or volume?
The market size is provided in terms of value, measured in Million.
11. Are there any specific market keywords associated with the report?
Yes, the market keyword associated with the report is "Offshore Lifting Industry," which aids in identifying and referencing the specific market segment covered.
12. How do I determine which pricing option suits my needs best?
The pricing options vary based on user requirements and access needs. Individual users may opt for single-user licenses, while businesses requiring broader access may choose multi-user or enterprise licenses for cost-effective access to the report.
13. Are there any additional resources or data provided in the Offshore Lifting Industry report?
While the report offers comprehensive insights, it's advisable to review the specific contents or supplementary materials provided to ascertain if additional resources or data are available.
14. How can I stay updated on further developments or reports in the Offshore Lifting Industry?
To stay informed about further developments, trends, and reports in the Offshore Lifting Industry, consider subscribing to industry newsletters, following relevant companies and organizations, or regularly checking reputable industry news sources and publications.
Methodology
Step 1 - Identification of Relevant Samples Size from Population Database


Step 2 - Approaches for Defining Global Market Size (Value, Volume* & Price*)

Note*: In applicable scenarios
Step 3 - Data Sources
Primary Research
- Web Analytics
- Survey Reports
- Research Institute
- Latest Research Reports
- Opinion Leaders
Secondary Research
- Annual Reports
- White Paper
- Latest Press Release
- Industry Association
- Paid Database
- Investor Presentations

Step 4 - Data Triangulation
Involves using different sources of information in order to increase the validity of a study
These sources are likely to be stakeholders in a program - participants, other researchers, program staff, other community members, and so on.
Then we put all data in single framework & apply various statistical tools to find out the dynamic on the market.
During the analysis stage, feedback from the stakeholder groups would be compared to determine areas of agreement as well as areas of divergence
