

Key Insights
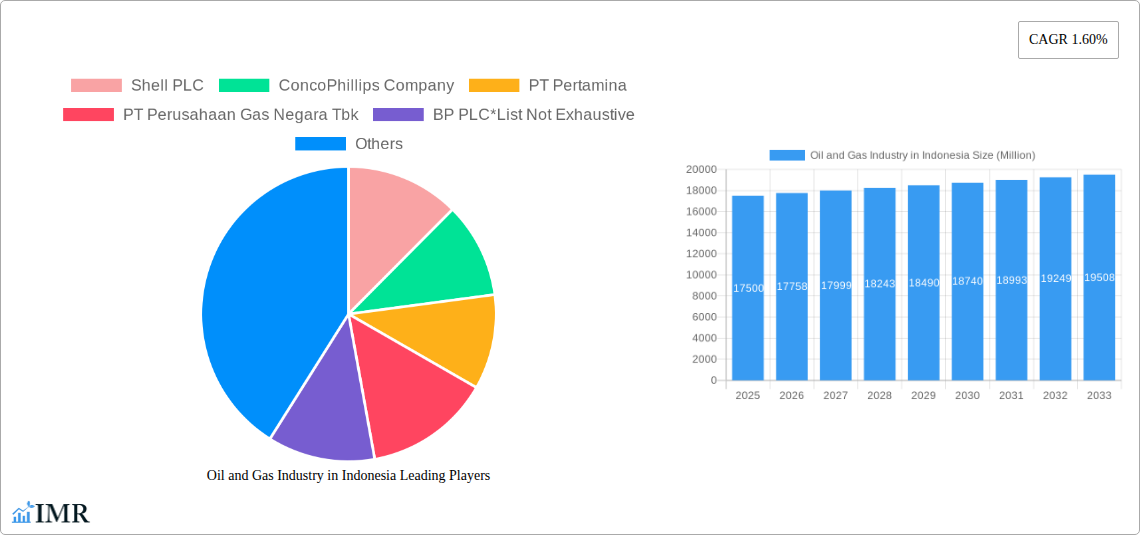
Indonesia's oil and gas industry, valued at $17.5 billion in 2025, is projected to experience moderate growth, driven by increasing energy demand fueled by a growing population and industrial expansion. The 1.60% CAGR suggests a steady, albeit not explosive, expansion over the forecast period (2025-2033). Key drivers include sustained domestic consumption, particularly in power generation and transportation sectors. The transportation sector, encompassing both road and maritime transport, is anticipated to remain a major consumer of refined products like gasoline and diesel. Similarly, the power generation sector’s reliance on natural gas and potentially some crude oil for backup power plants will continue to contribute significantly to market demand. However, the industry faces challenges including depleting reserves in some areas, requiring increased investment in exploration and production activities, and a growing emphasis on renewable energy sources which presents a long-term potential constraint on growth. Regional variations exist, with Sumatra, Java, and Kalimantan expected to be the key contributors due to existing infrastructure and resource concentration. The competitive landscape involves a mix of international players like Shell, ConocoPhillips, and BP alongside significant state-owned enterprises such as Pertamina and Perusahaan Gas Negara. These companies are constantly adapting to shifting global energy dynamics, government regulations, and the imperative for sustainable practices.
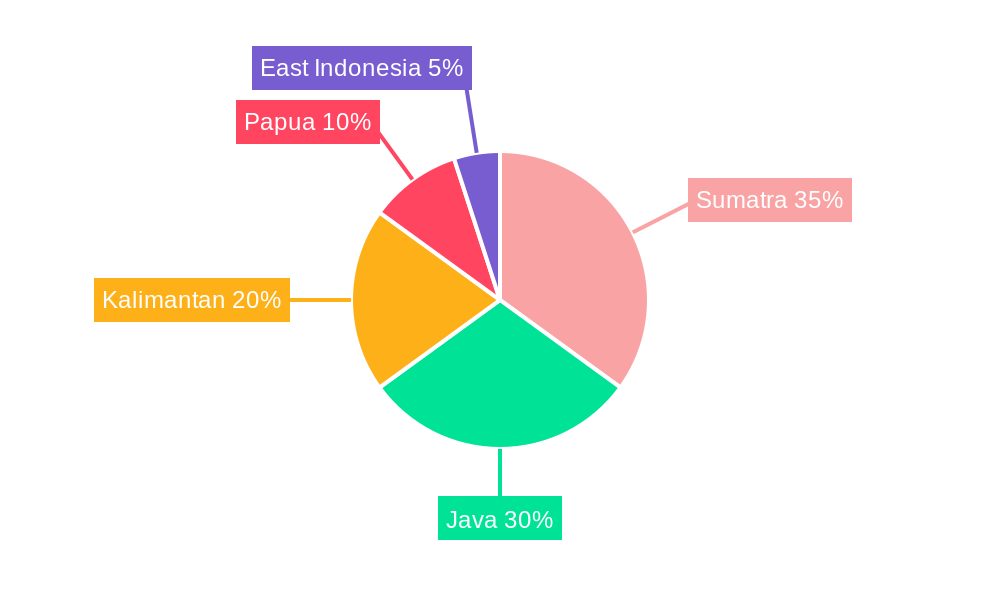
The segmentation of the Indonesian oil and gas market into crude oil, natural gas, and refined products, combined with applications across power generation, transportation, industrial, and residential uses, offers diverse growth opportunities for companies. The regional breakdown into Sumatra, Java, Kalimantan, Papua, and East Indonesia reflects the uneven distribution of resources and infrastructure development. While the industry faces challenges such as environmental concerns and geopolitical uncertainties, the continued domestic energy demand is likely to support a consistent, albeit modest, market expansion throughout the forecast period. Successful navigation of these challenges will hinge on strategic investments in exploration, efficient resource management, and a commitment to environmentally responsible operations.
Oil and Gas Industry in Indonesia: A Comprehensive Market Report (2019-2033)
This comprehensive report provides an in-depth analysis of the Indonesian oil and gas industry, offering invaluable insights for industry professionals, investors, and strategic decision-makers. Covering the period 2019-2033, with a focus on 2025, this report meticulously examines market dynamics, growth trends, dominant segments, and key players shaping this dynamic sector. The report leverages extensive data analysis to provide a robust forecast, highlighting both opportunities and challenges within the Indonesian oil and gas landscape.
Oil and Gas Industry in Indonesia Market Dynamics & Structure
This section analyzes the Indonesian oil and gas market's competitive landscape, technological advancements, regulatory environment, and market trends. We delve into market concentration, examining the market share of key players like Shell PLC, ConocoPhillips Company, PT Pertamina, PT Perusahaan Gas Negara Tbk, BP PLC, Chevron Corporation, Petroliam Nasional Berhad, PT Connusa Energindo, ExxonMobil Corporation, and China National Offshore Oil Corporation (list not exhaustive). The analysis also includes an assessment of M&A activity, identifying significant deals and their impact on market structure. The report considers the influence of government regulations, technological innovation drivers (e.g., enhanced oil recovery techniques), and the presence of competitive substitutes on market dynamics.
- Market Concentration: Analysis of market share held by major players (PT Pertamina holds xx%, Shell xx%, etc.)
- Technological Innovation: Examination of advancements in exploration, production, and refining technologies.
- Regulatory Framework: Assessment of Indonesian government policies impacting the oil and gas sector.
- Competitive Substitutes: Evaluation of alternative energy sources and their impact on market demand.
- End-User Demographics: Analysis of consumption patterns across different sectors (power generation, transportation, industrial, residential).
- M&A Trends: Review of significant mergers and acquisitions, including deal volume (xx Million USD in the last 5 years) and their implications for market consolidation.
Oil and Gas Industry in Indonesia Growth Trends & Insights
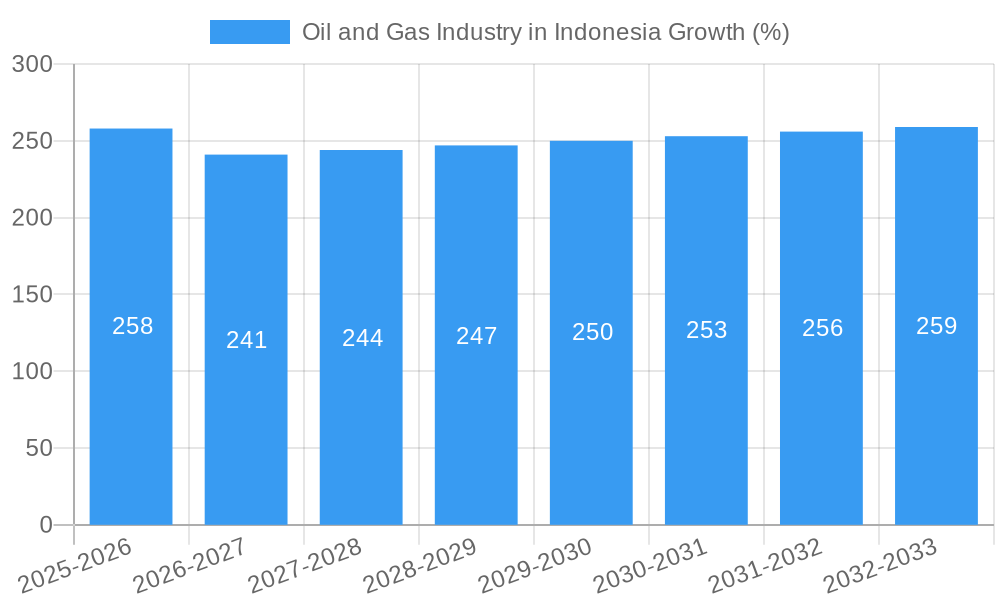
This section provides a detailed analysis of the Indonesian oil and gas market's growth trajectory from 2019 to 2033. Utilizing rigorous data analysis, the report examines the historical period (2019-2024), base year (2025), and forecast period (2025-2033). We present a comprehensive picture of market size evolution (measured in Million USD), adoption rates of new technologies, and the influence of technological disruptions and shifting consumer behavior. Key performance indicators like Compound Annual Growth Rate (CAGR) and market penetration rates are used to provide granular insights into market growth dynamics. The analysis considers factors influencing the demand for crude oil, natural gas, and refined products.
Dominant Regions, Countries, or Segments in Oil and Gas Industry in Indonesia
This section identifies the leading regions (Sumatra, Java, Kalimantan, Papua, East Indonesia), product segments (crude oil, natural gas, refined products), and application segments (power generation, transportation, industrial, residential) driving market growth in Indonesia. We analyze market share, growth potential, and key drivers for each segment, incorporating economic policies, infrastructure development, and resource availability.
- Regional Dominance: Java and Sumatra are currently the leading regions due to existing infrastructure and high energy consumption; however, Kalimantan shows significant growth potential due to untapped reserves.
- Product Segmentation: Natural gas currently holds the largest market share (xx Million USD), followed by crude oil (xx Million USD) and refined products (xx Million USD).
- Application Segmentation: The power generation sector is the largest consumer of natural gas (xx Million USD), followed by the industrial (xx Million USD) and transportation sectors (xx Million USD).
- Growth Drivers: Government initiatives promoting energy security, increasing industrialization, and growing urbanization are key factors driving market growth.
Oil and Gas Industry in Indonesia Product Landscape
This section provides a concise overview of product innovations, applications, and performance metrics within the Indonesian oil and gas industry. It highlights recent advancements in extraction techniques, refining processes, and the development of new fuel types, emphasizing their unique selling propositions and technological advancements that contribute to increased efficiency and reduced environmental impact.
Key Drivers, Barriers & Challenges in Oil and Gas Industry in Indonesia
This section identifies key drivers and challenges impacting the Indonesian oil and gas market. Drivers include growing energy demand, government support for energy sector development, and investment in infrastructure. Challenges include fluctuating global oil prices, environmental concerns, and the need for continuous technological upgrades. Quantifiable impacts of these factors are also included, such as the impact of price volatility on investment decisions (xx% reduction in investment during periods of low prices).
- Key Drivers: Increasing energy demand driven by economic growth, supportive government policies, and foreign direct investment.
- Key Challenges: Fluctuating global oil and gas prices, environmental regulations, and infrastructure limitations.
Emerging Opportunities in Oil and Gas Industry in Indonesia
This section explores potential opportunities for growth in the Indonesian oil and gas sector. This includes exploring untapped reserves in remote areas, developing new applications for natural gas (e.g., petrochemicals), and the potential for increasing energy efficiency.
Growth Accelerators in the Oil and Gas Industry in Indonesia Industry
Long-term growth in the Indonesian oil and gas industry will be driven by investments in exploration and production technologies, strategic partnerships to access new markets and resources, and initiatives focusing on environmental sustainability.
Key Players Shaping the Oil and Gas Industry in Indonesia Market
- Shell PLC
- ConocoPhillips Company
- PT Pertamina
- PT Perusahaan Gas Negara Tbk
- BP PLC
- Chevron Corporation
- Petroliam Nasional Berhad
- PT Connusa Energindo
- ExxonMobil Corporation
- China National Offshore Oil Corporation
Notable Milestones in Oil and Gas Industry in Indonesia Sector
- June 2023: Sembcorp Industries signed a USD 1.41 billion gas sales agreement with Medco Energi International for gas import from West Natuna field to Singapore.
- November 2022: Medco Energy Internasional Tbk signed a five-year gas supply agreement with Singapore.
In-Depth Oil and Gas Industry in Indonesia Market Outlook
The Indonesian oil and gas industry is poised for continued growth, driven by robust domestic demand and strategic investments in exploration and production. Opportunities exist in expanding gas infrastructure, developing renewable energy sources alongside conventional resources, and implementing environmentally sustainable practices. The long-term outlook remains positive, with significant potential for market expansion and strategic partnerships.
Oil and Gas Industry in Indonesia Segmentation
- 1. Upstream
- 2. Midstream
- 3. Downstream
Oil and Gas Industry in Indonesia Segmentation By Geography
-
1. North America
- 1.1. United States
- 1.2. Canada
- 1.3. Mexico
-
2. South America
- 2.1. Brazil
- 2.2. Argentina
- 2.3. Rest of South America
-
3. Europe
- 3.1. United Kingdom
- 3.2. Germany
- 3.3. France
- 3.4. Italy
- 3.5. Spain
- 3.6. Russia
- 3.7. Benelux
- 3.8. Nordics
- 3.9. Rest of Europe
-
4. Middle East & Africa
- 4.1. Turkey
- 4.2. Israel
- 4.3. GCC
- 4.4. North Africa
- 4.5. South Africa
- 4.6. Rest of Middle East & Africa
-
5. Asia Pacific
- 5.1. China
- 5.2. India
- 5.3. Japan
- 5.4. South Korea
- 5.5. ASEAN
- 5.6. Oceania
- 5.7. Rest of Asia Pacific
Oil and Gas Industry in Indonesia REPORT HIGHLIGHTS
| Aspects | Details |
|---|---|
| Study Period | 2019-2033 |
| Base Year | 2024 |
| Estimated Year | 2025 |
| Forecast Period | 2025-2033 |
| Historical Period | 2019-2024 |
| Growth Rate | CAGR of 1.60% from 2019-2033 |
| Segmentation |
|
Table of Contents
- 1. Introduction
- 1.1. Research Scope
- 1.2. Market Segmentation
- 1.3. Research Methodology
- 1.4. Definitions and Assumptions
- 2. Executive Summary
- 2.1. Introduction
- 3. Market Dynamics
- 3.1. Introduction
- 3.2. Market Drivers
- 3.2.1. 4.; Increasing Demand for Petroleum Products Due to the Growth of the Local Economy4.; Government Initiatives to Boost the Production of Crude Oil and Natural Gas
- 3.3. Market Restrains
- 3.3.1. 4.; Increasing Adoption of Renewable Energy
- 3.4. Market Trends
- 3.4.1. Upstream Sector Expected to Witness Significant Growth
- 4. Market Factor Analysis
- 4.1. Porters Five Forces
- 4.2. Supply/Value Chain
- 4.3. PESTEL analysis
- 4.4. Market Entropy
- 4.5. Patent/Trademark Analysis
- 5. Global Oil and Gas Industry in Indonesia Analysis, Insights and Forecast, 2019-2031
- 5.1. Market Analysis, Insights and Forecast - by Upstream
- 5.2. Market Analysis, Insights and Forecast - by Midstream
- 5.3. Market Analysis, Insights and Forecast - by Downstream
- 5.4. Market Analysis, Insights and Forecast - by Region
- 5.4.1. North America
- 5.4.2. South America
- 5.4.3. Europe
- 5.4.4. Middle East & Africa
- 5.4.5. Asia Pacific
- 5.1. Market Analysis, Insights and Forecast - by Upstream
- 6. North America Oil and Gas Industry in Indonesia Analysis, Insights and Forecast, 2019-2031
- 6.1. Market Analysis, Insights and Forecast - by Upstream
- 6.2. Market Analysis, Insights and Forecast - by Midstream
- 6.3. Market Analysis, Insights and Forecast - by Downstream
- 6.1. Market Analysis, Insights and Forecast - by Upstream
- 7. South America Oil and Gas Industry in Indonesia Analysis, Insights and Forecast, 2019-2031
- 7.1. Market Analysis, Insights and Forecast - by Upstream
- 7.2. Market Analysis, Insights and Forecast - by Midstream
- 7.3. Market Analysis, Insights and Forecast - by Downstream
- 7.1. Market Analysis, Insights and Forecast - by Upstream
- 8. Europe Oil and Gas Industry in Indonesia Analysis, Insights and Forecast, 2019-2031
- 8.1. Market Analysis, Insights and Forecast - by Upstream
- 8.2. Market Analysis, Insights and Forecast - by Midstream
- 8.3. Market Analysis, Insights and Forecast - by Downstream
- 8.1. Market Analysis, Insights and Forecast - by Upstream
- 9. Middle East & Africa Oil and Gas Industry in Indonesia Analysis, Insights and Forecast, 2019-2031
- 9.1. Market Analysis, Insights and Forecast - by Upstream
- 9.2. Market Analysis, Insights and Forecast - by Midstream
- 9.3. Market Analysis, Insights and Forecast - by Downstream
- 9.1. Market Analysis, Insights and Forecast - by Upstream
- 10. Asia Pacific Oil and Gas Industry in Indonesia Analysis, Insights and Forecast, 2019-2031
- 10.1. Market Analysis, Insights and Forecast - by Upstream
- 10.2. Market Analysis, Insights and Forecast - by Midstream
- 10.3. Market Analysis, Insights and Forecast - by Downstream
- 10.1. Market Analysis, Insights and Forecast - by Upstream
- 11. Competitive Analysis
- 11.1. Global Market Share Analysis 2024
- 11.2. Company Profiles
- 11.2.1 Shell PLC
- 11.2.1.1. Overview
- 11.2.1.2. Products
- 11.2.1.3. SWOT Analysis
- 11.2.1.4. Recent Developments
- 11.2.1.5. Financials (Based on Availability)
- 11.2.2 ConcoPhillips Company
- 11.2.2.1. Overview
- 11.2.2.2. Products
- 11.2.2.3. SWOT Analysis
- 11.2.2.4. Recent Developments
- 11.2.2.5. Financials (Based on Availability)
- 11.2.3 PT Pertamina
- 11.2.3.1. Overview
- 11.2.3.2. Products
- 11.2.3.3. SWOT Analysis
- 11.2.3.4. Recent Developments
- 11.2.3.5. Financials (Based on Availability)
- 11.2.4 PT Perusahaan Gas Negara Tbk
- 11.2.4.1. Overview
- 11.2.4.2. Products
- 11.2.4.3. SWOT Analysis
- 11.2.4.4. Recent Developments
- 11.2.4.5. Financials (Based on Availability)
- 11.2.5 BP PLC*List Not Exhaustive
- 11.2.5.1. Overview
- 11.2.5.2. Products
- 11.2.5.3. SWOT Analysis
- 11.2.5.4. Recent Developments
- 11.2.5.5. Financials (Based on Availability)
- 11.2.6 Chevron Corporation
- 11.2.6.1. Overview
- 11.2.6.2. Products
- 11.2.6.3. SWOT Analysis
- 11.2.6.4. Recent Developments
- 11.2.6.5. Financials (Based on Availability)
- 11.2.7 Petroliam Nasional Berhad
- 11.2.7.1. Overview
- 11.2.7.2. Products
- 11.2.7.3. SWOT Analysis
- 11.2.7.4. Recent Developments
- 11.2.7.5. Financials (Based on Availability)
- 11.2.8 PT Connusa Energindo
- 11.2.8.1. Overview
- 11.2.8.2. Products
- 11.2.8.3. SWOT Analysis
- 11.2.8.4. Recent Developments
- 11.2.8.5. Financials (Based on Availability)
- 11.2.9 ExxonMobil Corporatoin
- 11.2.9.1. Overview
- 11.2.9.2. Products
- 11.2.9.3. SWOT Analysis
- 11.2.9.4. Recent Developments
- 11.2.9.5. Financials (Based on Availability)
- 11.2.10 China National Offshore Oil Corporation
- 11.2.10.1. Overview
- 11.2.10.2. Products
- 11.2.10.3. SWOT Analysis
- 11.2.10.4. Recent Developments
- 11.2.10.5. Financials (Based on Availability)
- 11.2.1 Shell PLC
List of Figures
- Figure 1: Global Oil and Gas Industry in Indonesia Revenue Breakdown (Million, %) by Region 2024 & 2032
- Figure 2: Global Oil and Gas Industry in Indonesia Volume Breakdown (Thousand, %) by Region 2024 & 2032
- Figure 3: Indonesia Oil and Gas Industry in Indonesia Revenue (Million), by Country 2024 & 2032
- Figure 4: Indonesia Oil and Gas Industry in Indonesia Volume (Thousand), by Country 2024 & 2032
- Figure 5: Indonesia Oil and Gas Industry in Indonesia Revenue Share (%), by Country 2024 & 2032
- Figure 6: Indonesia Oil and Gas Industry in Indonesia Volume Share (%), by Country 2024 & 2032
- Figure 7: North America Oil and Gas Industry in Indonesia Revenue (Million), by Upstream 2024 & 2032
- Figure 8: North America Oil and Gas Industry in Indonesia Volume (Thousand), by Upstream 2024 & 2032
- Figure 9: North America Oil and Gas Industry in Indonesia Revenue Share (%), by Upstream 2024 & 2032
- Figure 10: North America Oil and Gas Industry in Indonesia Volume Share (%), by Upstream 2024 & 2032
- Figure 11: North America Oil and Gas Industry in Indonesia Revenue (Million), by Midstream 2024 & 2032
- Figure 12: North America Oil and Gas Industry in Indonesia Volume (Thousand), by Midstream 2024 & 2032
- Figure 13: North America Oil and Gas Industry in Indonesia Revenue Share (%), by Midstream 2024 & 2032
- Figure 14: North America Oil and Gas Industry in Indonesia Volume Share (%), by Midstream 2024 & 2032
- Figure 15: North America Oil and Gas Industry in Indonesia Revenue (Million), by Downstream 2024 & 2032
- Figure 16: North America Oil and Gas Industry in Indonesia Volume (Thousand), by Downstream 2024 & 2032
- Figure 17: North America Oil and Gas Industry in Indonesia Revenue Share (%), by Downstream 2024 & 2032
- Figure 18: North America Oil and Gas Industry in Indonesia Volume Share (%), by Downstream 2024 & 2032
- Figure 19: North America Oil and Gas Industry in Indonesia Revenue (Million), by Country 2024 & 2032
- Figure 20: North America Oil and Gas Industry in Indonesia Volume (Thousand), by Country 2024 & 2032
- Figure 21: North America Oil and Gas Industry in Indonesia Revenue Share (%), by Country 2024 & 2032
- Figure 22: North America Oil and Gas Industry in Indonesia Volume Share (%), by Country 2024 & 2032
- Figure 23: South America Oil and Gas Industry in Indonesia Revenue (Million), by Upstream 2024 & 2032
- Figure 24: South America Oil and Gas Industry in Indonesia Volume (Thousand), by Upstream 2024 & 2032
- Figure 25: South America Oil and Gas Industry in Indonesia Revenue Share (%), by Upstream 2024 & 2032
- Figure 26: South America Oil and Gas Industry in Indonesia Volume Share (%), by Upstream 2024 & 2032
- Figure 27: South America Oil and Gas Industry in Indonesia Revenue (Million), by Midstream 2024 & 2032
- Figure 28: South America Oil and Gas Industry in Indonesia Volume (Thousand), by Midstream 2024 & 2032
- Figure 29: South America Oil and Gas Industry in Indonesia Revenue Share (%), by Midstream 2024 & 2032
- Figure 30: South America Oil and Gas Industry in Indonesia Volume Share (%), by Midstream 2024 & 2032
- Figure 31: South America Oil and Gas Industry in Indonesia Revenue (Million), by Downstream 2024 & 2032
- Figure 32: South America Oil and Gas Industry in Indonesia Volume (Thousand), by Downstream 2024 & 2032
- Figure 33: South America Oil and Gas Industry in Indonesia Revenue Share (%), by Downstream 2024 & 2032
- Figure 34: South America Oil and Gas Industry in Indonesia Volume Share (%), by Downstream 2024 & 2032
- Figure 35: South America Oil and Gas Industry in Indonesia Revenue (Million), by Country 2024 & 2032
- Figure 36: South America Oil and Gas Industry in Indonesia Volume (Thousand), by Country 2024 & 2032
- Figure 37: South America Oil and Gas Industry in Indonesia Revenue Share (%), by Country 2024 & 2032
- Figure 38: South America Oil and Gas Industry in Indonesia Volume Share (%), by Country 2024 & 2032
- Figure 39: Europe Oil and Gas Industry in Indonesia Revenue (Million), by Upstream 2024 & 2032
- Figure 40: Europe Oil and Gas Industry in Indonesia Volume (Thousand), by Upstream 2024 & 2032
- Figure 41: Europe Oil and Gas Industry in Indonesia Revenue Share (%), by Upstream 2024 & 2032
- Figure 42: Europe Oil and Gas Industry in Indonesia Volume Share (%), by Upstream 2024 & 2032
- Figure 43: Europe Oil and Gas Industry in Indonesia Revenue (Million), by Midstream 2024 & 2032
- Figure 44: Europe Oil and Gas Industry in Indonesia Volume (Thousand), by Midstream 2024 & 2032
- Figure 45: Europe Oil and Gas Industry in Indonesia Revenue Share (%), by Midstream 2024 & 2032
- Figure 46: Europe Oil and Gas Industry in Indonesia Volume Share (%), by Midstream 2024 & 2032
- Figure 47: Europe Oil and Gas Industry in Indonesia Revenue (Million), by Downstream 2024 & 2032
- Figure 48: Europe Oil and Gas Industry in Indonesia Volume (Thousand), by Downstream 2024 & 2032
- Figure 49: Europe Oil and Gas Industry in Indonesia Revenue Share (%), by Downstream 2024 & 2032
- Figure 50: Europe Oil and Gas Industry in Indonesia Volume Share (%), by Downstream 2024 & 2032
- Figure 51: Europe Oil and Gas Industry in Indonesia Revenue (Million), by Country 2024 & 2032
- Figure 52: Europe Oil and Gas Industry in Indonesia Volume (Thousand), by Country 2024 & 2032
- Figure 53: Europe Oil and Gas Industry in Indonesia Revenue Share (%), by Country 2024 & 2032
- Figure 54: Europe Oil and Gas Industry in Indonesia Volume Share (%), by Country 2024 & 2032
- Figure 55: Middle East & Africa Oil and Gas Industry in Indonesia Revenue (Million), by Upstream 2024 & 2032
- Figure 56: Middle East & Africa Oil and Gas Industry in Indonesia Volume (Thousand), by Upstream 2024 & 2032
- Figure 57: Middle East & Africa Oil and Gas Industry in Indonesia Revenue Share (%), by Upstream 2024 & 2032
- Figure 58: Middle East & Africa Oil and Gas Industry in Indonesia Volume Share (%), by Upstream 2024 & 2032
- Figure 59: Middle East & Africa Oil and Gas Industry in Indonesia Revenue (Million), by Midstream 2024 & 2032
- Figure 60: Middle East & Africa Oil and Gas Industry in Indonesia Volume (Thousand), by Midstream 2024 & 2032
- Figure 61: Middle East & Africa Oil and Gas Industry in Indonesia Revenue Share (%), by Midstream 2024 & 2032
- Figure 62: Middle East & Africa Oil and Gas Industry in Indonesia Volume Share (%), by Midstream 2024 & 2032
- Figure 63: Middle East & Africa Oil and Gas Industry in Indonesia Revenue (Million), by Downstream 2024 & 2032
- Figure 64: Middle East & Africa Oil and Gas Industry in Indonesia Volume (Thousand), by Downstream 2024 & 2032
- Figure 65: Middle East & Africa Oil and Gas Industry in Indonesia Revenue Share (%), by Downstream 2024 & 2032
- Figure 66: Middle East & Africa Oil and Gas Industry in Indonesia Volume Share (%), by Downstream 2024 & 2032
- Figure 67: Middle East & Africa Oil and Gas Industry in Indonesia Revenue (Million), by Country 2024 & 2032
- Figure 68: Middle East & Africa Oil and Gas Industry in Indonesia Volume (Thousand), by Country 2024 & 2032
- Figure 69: Middle East & Africa Oil and Gas Industry in Indonesia Revenue Share (%), by Country 2024 & 2032
- Figure 70: Middle East & Africa Oil and Gas Industry in Indonesia Volume Share (%), by Country 2024 & 2032
- Figure 71: Asia Pacific Oil and Gas Industry in Indonesia Revenue (Million), by Upstream 2024 & 2032
- Figure 72: Asia Pacific Oil and Gas Industry in Indonesia Volume (Thousand), by Upstream 2024 & 2032
- Figure 73: Asia Pacific Oil and Gas Industry in Indonesia Revenue Share (%), by Upstream 2024 & 2032
- Figure 74: Asia Pacific Oil and Gas Industry in Indonesia Volume Share (%), by Upstream 2024 & 2032
- Figure 75: Asia Pacific Oil and Gas Industry in Indonesia Revenue (Million), by Midstream 2024 & 2032
- Figure 76: Asia Pacific Oil and Gas Industry in Indonesia Volume (Thousand), by Midstream 2024 & 2032
- Figure 77: Asia Pacific Oil and Gas Industry in Indonesia Revenue Share (%), by Midstream 2024 & 2032
- Figure 78: Asia Pacific Oil and Gas Industry in Indonesia Volume Share (%), by Midstream 2024 & 2032
- Figure 79: Asia Pacific Oil and Gas Industry in Indonesia Revenue (Million), by Downstream 2024 & 2032
- Figure 80: Asia Pacific Oil and Gas Industry in Indonesia Volume (Thousand), by Downstream 2024 & 2032
- Figure 81: Asia Pacific Oil and Gas Industry in Indonesia Revenue Share (%), by Downstream 2024 & 2032
- Figure 82: Asia Pacific Oil and Gas Industry in Indonesia Volume Share (%), by Downstream 2024 & 2032
- Figure 83: Asia Pacific Oil and Gas Industry in Indonesia Revenue (Million), by Country 2024 & 2032
- Figure 84: Asia Pacific Oil and Gas Industry in Indonesia Volume (Thousand), by Country 2024 & 2032
- Figure 85: Asia Pacific Oil and Gas Industry in Indonesia Revenue Share (%), by Country 2024 & 2032
- Figure 86: Asia Pacific Oil and Gas Industry in Indonesia Volume Share (%), by Country 2024 & 2032
List of Tables
- Table 1: Global Oil and Gas Industry in Indonesia Revenue Million Forecast, by Region 2019 & 2032
- Table 2: Global Oil and Gas Industry in Indonesia Volume Thousand Forecast, by Region 2019 & 2032
- Table 3: Global Oil and Gas Industry in Indonesia Revenue Million Forecast, by Upstream 2019 & 2032
- Table 4: Global Oil and Gas Industry in Indonesia Volume Thousand Forecast, by Upstream 2019 & 2032
- Table 5: Global Oil and Gas Industry in Indonesia Revenue Million Forecast, by Midstream 2019 & 2032
- Table 6: Global Oil and Gas Industry in Indonesia Volume Thousand Forecast, by Midstream 2019 & 2032
- Table 7: Global Oil and Gas Industry in Indonesia Revenue Million Forecast, by Downstream 2019 & 2032
- Table 8: Global Oil and Gas Industry in Indonesia Volume Thousand Forecast, by Downstream 2019 & 2032
- Table 9: Global Oil and Gas Industry in Indonesia Revenue Million Forecast, by Region 2019 & 2032
- Table 10: Global Oil and Gas Industry in Indonesia Volume Thousand Forecast, by Region 2019 & 2032
- Table 11: Global Oil and Gas Industry in Indonesia Revenue Million Forecast, by Country 2019 & 2032
- Table 12: Global Oil and Gas Industry in Indonesia Volume Thousand Forecast, by Country 2019 & 2032
- Table 13: Global Oil and Gas Industry in Indonesia Revenue Million Forecast, by Upstream 2019 & 2032
- Table 14: Global Oil and Gas Industry in Indonesia Volume Thousand Forecast, by Upstream 2019 & 2032
- Table 15: Global Oil and Gas Industry in Indonesia Revenue Million Forecast, by Midstream 2019 & 2032
- Table 16: Global Oil and Gas Industry in Indonesia Volume Thousand Forecast, by Midstream 2019 & 2032
- Table 17: Global Oil and Gas Industry in Indonesia Revenue Million Forecast, by Downstream 2019 & 2032
- Table 18: Global Oil and Gas Industry in Indonesia Volume Thousand Forecast, by Downstream 2019 & 2032
- Table 19: Global Oil and Gas Industry in Indonesia Revenue Million Forecast, by Country 2019 & 2032
- Table 20: Global Oil and Gas Industry in Indonesia Volume Thousand Forecast, by Country 2019 & 2032
- Table 21: United States Oil and Gas Industry in Indonesia Revenue (Million) Forecast, by Application 2019 & 2032
- Table 22: United States Oil and Gas Industry in Indonesia Volume (Thousand) Forecast, by Application 2019 & 2032
- Table 23: Canada Oil and Gas Industry in Indonesia Revenue (Million) Forecast, by Application 2019 & 2032
- Table 24: Canada Oil and Gas Industry in Indonesia Volume (Thousand) Forecast, by Application 2019 & 2032
- Table 25: Mexico Oil and Gas Industry in Indonesia Revenue (Million) Forecast, by Application 2019 & 2032
- Table 26: Mexico Oil and Gas Industry in Indonesia Volume (Thousand) Forecast, by Application 2019 & 2032
- Table 27: Global Oil and Gas Industry in Indonesia Revenue Million Forecast, by Upstream 2019 & 2032
- Table 28: Global Oil and Gas Industry in Indonesia Volume Thousand Forecast, by Upstream 2019 & 2032
- Table 29: Global Oil and Gas Industry in Indonesia Revenue Million Forecast, by Midstream 2019 & 2032
- Table 30: Global Oil and Gas Industry in Indonesia Volume Thousand Forecast, by Midstream 2019 & 2032
- Table 31: Global Oil and Gas Industry in Indonesia Revenue Million Forecast, by Downstream 2019 & 2032
- Table 32: Global Oil and Gas Industry in Indonesia Volume Thousand Forecast, by Downstream 2019 & 2032
- Table 33: Global Oil and Gas Industry in Indonesia Revenue Million Forecast, by Country 2019 & 2032
- Table 34: Global Oil and Gas Industry in Indonesia Volume Thousand Forecast, by Country 2019 & 2032
- Table 35: Brazil Oil and Gas Industry in Indonesia Revenue (Million) Forecast, by Application 2019 & 2032
- Table 36: Brazil Oil and Gas Industry in Indonesia Volume (Thousand) Forecast, by Application 2019 & 2032
- Table 37: Argentina Oil and Gas Industry in Indonesia Revenue (Million) Forecast, by Application 2019 & 2032
- Table 38: Argentina Oil and Gas Industry in Indonesia Volume (Thousand) Forecast, by Application 2019 & 2032
- Table 39: Rest of South America Oil and Gas Industry in Indonesia Revenue (Million) Forecast, by Application 2019 & 2032
- Table 40: Rest of South America Oil and Gas Industry in Indonesia Volume (Thousand) Forecast, by Application 2019 & 2032
- Table 41: Global Oil and Gas Industry in Indonesia Revenue Million Forecast, by Upstream 2019 & 2032
- Table 42: Global Oil and Gas Industry in Indonesia Volume Thousand Forecast, by Upstream 2019 & 2032
- Table 43: Global Oil and Gas Industry in Indonesia Revenue Million Forecast, by Midstream 2019 & 2032
- Table 44: Global Oil and Gas Industry in Indonesia Volume Thousand Forecast, by Midstream 2019 & 2032
- Table 45: Global Oil and Gas Industry in Indonesia Revenue Million Forecast, by Downstream 2019 & 2032
- Table 46: Global Oil and Gas Industry in Indonesia Volume Thousand Forecast, by Downstream 2019 & 2032
- Table 47: Global Oil and Gas Industry in Indonesia Revenue Million Forecast, by Country 2019 & 2032
- Table 48: Global Oil and Gas Industry in Indonesia Volume Thousand Forecast, by Country 2019 & 2032
- Table 49: United Kingdom Oil and Gas Industry in Indonesia Revenue (Million) Forecast, by Application 2019 & 2032
- Table 50: United Kingdom Oil and Gas Industry in Indonesia Volume (Thousand) Forecast, by Application 2019 & 2032
- Table 51: Germany Oil and Gas Industry in Indonesia Revenue (Million) Forecast, by Application 2019 & 2032
- Table 52: Germany Oil and Gas Industry in Indonesia Volume (Thousand) Forecast, by Application 2019 & 2032
- Table 53: France Oil and Gas Industry in Indonesia Revenue (Million) Forecast, by Application 2019 & 2032
- Table 54: France Oil and Gas Industry in Indonesia Volume (Thousand) Forecast, by Application 2019 & 2032
- Table 55: Italy Oil and Gas Industry in Indonesia Revenue (Million) Forecast, by Application 2019 & 2032
- Table 56: Italy Oil and Gas Industry in Indonesia Volume (Thousand) Forecast, by Application 2019 & 2032
- Table 57: Spain Oil and Gas Industry in Indonesia Revenue (Million) Forecast, by Application 2019 & 2032
- Table 58: Spain Oil and Gas Industry in Indonesia Volume (Thousand) Forecast, by Application 2019 & 2032
- Table 59: Russia Oil and Gas Industry in Indonesia Revenue (Million) Forecast, by Application 2019 & 2032
- Table 60: Russia Oil and Gas Industry in Indonesia Volume (Thousand) Forecast, by Application 2019 & 2032
- Table 61: Benelux Oil and Gas Industry in Indonesia Revenue (Million) Forecast, by Application 2019 & 2032
- Table 62: Benelux Oil and Gas Industry in Indonesia Volume (Thousand) Forecast, by Application 2019 & 2032
- Table 63: Nordics Oil and Gas Industry in Indonesia Revenue (Million) Forecast, by Application 2019 & 2032
- Table 64: Nordics Oil and Gas Industry in Indonesia Volume (Thousand) Forecast, by Application 2019 & 2032
- Table 65: Rest of Europe Oil and Gas Industry in Indonesia Revenue (Million) Forecast, by Application 2019 & 2032
- Table 66: Rest of Europe Oil and Gas Industry in Indonesia Volume (Thousand) Forecast, by Application 2019 & 2032
- Table 67: Global Oil and Gas Industry in Indonesia Revenue Million Forecast, by Upstream 2019 & 2032
- Table 68: Global Oil and Gas Industry in Indonesia Volume Thousand Forecast, by Upstream 2019 & 2032
- Table 69: Global Oil and Gas Industry in Indonesia Revenue Million Forecast, by Midstream 2019 & 2032
- Table 70: Global Oil and Gas Industry in Indonesia Volume Thousand Forecast, by Midstream 2019 & 2032
- Table 71: Global Oil and Gas Industry in Indonesia Revenue Million Forecast, by Downstream 2019 & 2032
- Table 72: Global Oil and Gas Industry in Indonesia Volume Thousand Forecast, by Downstream 2019 & 2032
- Table 73: Global Oil and Gas Industry in Indonesia Revenue Million Forecast, by Country 2019 & 2032
- Table 74: Global Oil and Gas Industry in Indonesia Volume Thousand Forecast, by Country 2019 & 2032
- Table 75: Turkey Oil and Gas Industry in Indonesia Revenue (Million) Forecast, by Application 2019 & 2032
- Table 76: Turkey Oil and Gas Industry in Indonesia Volume (Thousand) Forecast, by Application 2019 & 2032
- Table 77: Israel Oil and Gas Industry in Indonesia Revenue (Million) Forecast, by Application 2019 & 2032
- Table 78: Israel Oil and Gas Industry in Indonesia Volume (Thousand) Forecast, by Application 2019 & 2032
- Table 79: GCC Oil and Gas Industry in Indonesia Revenue (Million) Forecast, by Application 2019 & 2032
- Table 80: GCC Oil and Gas Industry in Indonesia Volume (Thousand) Forecast, by Application 2019 & 2032
- Table 81: North Africa Oil and Gas Industry in Indonesia Revenue (Million) Forecast, by Application 2019 & 2032
- Table 82: North Africa Oil and Gas Industry in Indonesia Volume (Thousand) Forecast, by Application 2019 & 2032
- Table 83: South Africa Oil and Gas Industry in Indonesia Revenue (Million) Forecast, by Application 2019 & 2032
- Table 84: South Africa Oil and Gas Industry in Indonesia Volume (Thousand) Forecast, by Application 2019 & 2032
- Table 85: Rest of Middle East & Africa Oil and Gas Industry in Indonesia Revenue (Million) Forecast, by Application 2019 & 2032
- Table 86: Rest of Middle East & Africa Oil and Gas Industry in Indonesia Volume (Thousand) Forecast, by Application 2019 & 2032
- Table 87: Global Oil and Gas Industry in Indonesia Revenue Million Forecast, by Upstream 2019 & 2032
- Table 88: Global Oil and Gas Industry in Indonesia Volume Thousand Forecast, by Upstream 2019 & 2032
- Table 89: Global Oil and Gas Industry in Indonesia Revenue Million Forecast, by Midstream 2019 & 2032
- Table 90: Global Oil and Gas Industry in Indonesia Volume Thousand Forecast, by Midstream 2019 & 2032
- Table 91: Global Oil and Gas Industry in Indonesia Revenue Million Forecast, by Downstream 2019 & 2032
- Table 92: Global Oil and Gas Industry in Indonesia Volume Thousand Forecast, by Downstream 2019 & 2032
- Table 93: Global Oil and Gas Industry in Indonesia Revenue Million Forecast, by Country 2019 & 2032
- Table 94: Global Oil and Gas Industry in Indonesia Volume Thousand Forecast, by Country 2019 & 2032
- Table 95: China Oil and Gas Industry in Indonesia Revenue (Million) Forecast, by Application 2019 & 2032
- Table 96: China Oil and Gas Industry in Indonesia Volume (Thousand) Forecast, by Application 2019 & 2032
- Table 97: India Oil and Gas Industry in Indonesia Revenue (Million) Forecast, by Application 2019 & 2032
- Table 98: India Oil and Gas Industry in Indonesia Volume (Thousand) Forecast, by Application 2019 & 2032
- Table 99: Japan Oil and Gas Industry in Indonesia Revenue (Million) Forecast, by Application 2019 & 2032
- Table 100: Japan Oil and Gas Industry in Indonesia Volume (Thousand) Forecast, by Application 2019 & 2032
- Table 101: South Korea Oil and Gas Industry in Indonesia Revenue (Million) Forecast, by Application 2019 & 2032
- Table 102: South Korea Oil and Gas Industry in Indonesia Volume (Thousand) Forecast, by Application 2019 & 2032
- Table 103: ASEAN Oil and Gas Industry in Indonesia Revenue (Million) Forecast, by Application 2019 & 2032
- Table 104: ASEAN Oil and Gas Industry in Indonesia Volume (Thousand) Forecast, by Application 2019 & 2032
- Table 105: Oceania Oil and Gas Industry in Indonesia Revenue (Million) Forecast, by Application 2019 & 2032
- Table 106: Oceania Oil and Gas Industry in Indonesia Volume (Thousand) Forecast, by Application 2019 & 2032
- Table 107: Rest of Asia Pacific Oil and Gas Industry in Indonesia Revenue (Million) Forecast, by Application 2019 & 2032
- Table 108: Rest of Asia Pacific Oil and Gas Industry in Indonesia Volume (Thousand) Forecast, by Application 2019 & 2032
Frequently Asked Questions
1. What is the projected Compound Annual Growth Rate (CAGR) of the Oil and Gas Industry in Indonesia?
The projected CAGR is approximately 1.60%.
2. Which companies are prominent players in the Oil and Gas Industry in Indonesia?
Key companies in the market include Shell PLC, ConcoPhillips Company, PT Pertamina, PT Perusahaan Gas Negara Tbk, BP PLC*List Not Exhaustive, Chevron Corporation, Petroliam Nasional Berhad, PT Connusa Energindo, ExxonMobil Corporatoin, China National Offshore Oil Corporation.
3. What are the main segments of the Oil and Gas Industry in Indonesia?
The market segments include Upstream, Midstream, Downstream.
4. Can you provide details about the market size?
The market size is estimated to be USD 17500 Million as of 2022.
5. What are some drivers contributing to market growth?
4.; Increasing Demand for Petroleum Products Due to the Growth of the Local Economy4.; Government Initiatives to Boost the Production of Crude Oil and Natural Gas.
6. What are the notable trends driving market growth?
Upstream Sector Expected to Witness Significant Growth.
7. Are there any restraints impacting market growth?
4.; Increasing Adoption of Renewable Energy.
8. Can you provide examples of recent developments in the market?
June 2023: Sembcorp Industries signed a USD 1.41 billion gas sales agreement with Medco Energi International to import gas from an offshore play in Indonesia to Singapore. Gas will be obtained from the West Natuna gas field and dispatched to Singapore through the West Natuna-Singapore gas pipeline.
9. What pricing options are available for accessing the report?
Pricing options include single-user, multi-user, and enterprise licenses priced at USD 3800, USD 4500, and USD 5800 respectively.
10. Is the market size provided in terms of value or volume?
The market size is provided in terms of value, measured in Million and volume, measured in Thousand.
11. Are there any specific market keywords associated with the report?
Yes, the market keyword associated with the report is "Oil and Gas Industry in Indonesia," which aids in identifying and referencing the specific market segment covered.
12. How do I determine which pricing option suits my needs best?
The pricing options vary based on user requirements and access needs. Individual users may opt for single-user licenses, while businesses requiring broader access may choose multi-user or enterprise licenses for cost-effective access to the report.
13. Are there any additional resources or data provided in the Oil and Gas Industry in Indonesia report?
While the report offers comprehensive insights, it's advisable to review the specific contents or supplementary materials provided to ascertain if additional resources or data are available.
14. How can I stay updated on further developments or reports in the Oil and Gas Industry in Indonesia?
To stay informed about further developments, trends, and reports in the Oil and Gas Industry in Indonesia, consider subscribing to industry newsletters, following relevant companies and organizations, or regularly checking reputable industry news sources and publications.
Methodology
Step 1 - Identification of Relevant Samples Size from Population Database


Step 2 - Approaches for Defining Global Market Size (Value, Volume* & Price*)

Note*: In applicable scenarios
Step 3 - Data Sources
Primary Research
- Web Analytics
- Survey Reports
- Research Institute
- Latest Research Reports
- Opinion Leaders
Secondary Research
- Annual Reports
- White Paper
- Latest Press Release
- Industry Association
- Paid Database
- Investor Presentations

Step 4 - Data Triangulation
Involves using different sources of information in order to increase the validity of a study
These sources are likely to be stakeholders in a program - participants, other researchers, program staff, other community members, and so on.
Then we put all data in single framework & apply various statistical tools to find out the dynamic on the market.
During the analysis stage, feedback from the stakeholder groups would be compared to determine areas of agreement as well as areas of divergence
