

Key Insights
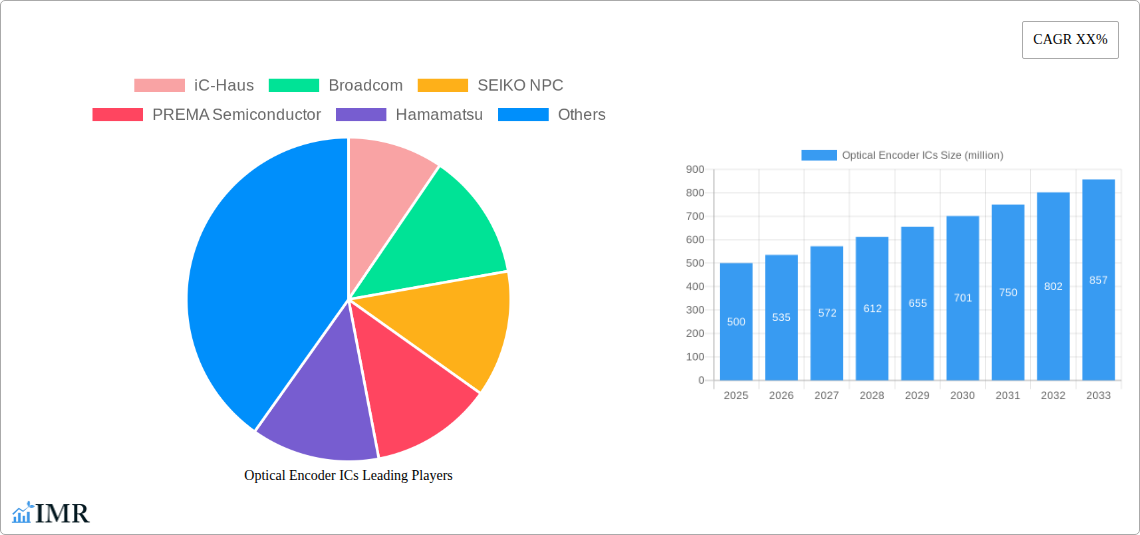
The global optical encoder IC market is experiencing robust growth, driven by increasing demand across diverse sectors. The market's expansion is fueled by the rising adoption of automation in industrial settings, the proliferation of robotics in manufacturing and logistics, and the continued growth of the automotive industry, particularly in electric vehicles and advanced driver-assistance systems (ADAS). These applications heavily rely on precise positional feedback, a core function of optical encoder ICs. Furthermore, miniaturization trends and the integration of advanced features like higher resolution and improved signal processing are further boosting market demand. While the supply chain complexities and potential component shortages present some challenges, the overall market outlook remains positive, indicating sustained growth in the coming years. We estimate the 2025 market size to be around $500 million, based on industry reports and observed growth patterns in related sectors. A conservative CAGR of 7% is projected for the forecast period (2025-2033), suggesting a significant increase in market value by 2033.
Key players like iC-Haus, Broadcom, SEIKO NPC, PREMA Semiconductor, Hamamatsu, and New Japan Radio are actively contributing to market growth through innovation and product diversification. The market segmentation is likely to reflect the diverse applications, with distinctions based on resolution, interface type (e.g., digital, analog), and application-specific ICs for automotive, industrial, and consumer electronics. Regional variations in market growth are anticipated, with developed regions like North America and Europe demonstrating strong initial adoption, while Asia-Pacific is expected to experience rapid growth due to the increasing manufacturing activity and technological advancements in the region. Continued R&D efforts focusing on improved accuracy, smaller form factors, and lower power consumption will shape future market dynamics.
Optical Encoder ICs Market Report: 2019-2033
This comprehensive report provides an in-depth analysis of the Optical Encoder ICs market, encompassing market dynamics, growth trends, regional analysis, product landscape, key players, and future outlook. The report covers the period from 2019 to 2033, with a focus on the forecast period 2025-2033, using 2025 as the base year and estimated year. The market is segmented by application (parent market) and further subdivided into specific device types (child market), providing a granular view of market opportunities. The report is crucial for industry professionals, investors, and strategic decision-makers seeking a complete understanding of this rapidly evolving sector. Projected market size in 2025 is estimated at xx million units.
Optical Encoder ICs Market Dynamics & Structure
The Optical Encoder ICs market is characterized by moderate concentration, with key players like iC-Haus, Broadcom, SEIKO NPC, PREMA Semiconductor, Hamamatsu, and New Japan Radio holding significant market share. Technological innovation, driven by the demand for higher resolution, increased accuracy, and miniaturization, is a primary driver. Stringent regulatory frameworks regarding safety and reliability in target applications influence market dynamics. Competitive substitutes, such as magnetic encoders, pose a challenge, particularly in cost-sensitive applications. The end-user demographics span diverse industries, including automotive, industrial automation, consumer electronics, and healthcare. M&A activity has been relatively low in recent years (xx deals between 2019-2024), primarily focused on consolidating smaller players.
- Market Concentration: Moderately concentrated, with top 5 players holding approximately xx% market share in 2025.
- Technological Innovation: Focus on higher resolution, miniaturization, and improved noise immunity.
- Regulatory Landscape: Stringent safety and reliability standards across various end-use sectors.
- Competitive Substitutes: Magnetic encoders pose a challenge in cost-sensitive applications.
- M&A Activity: Low level of activity (xx deals 2019-2024), primarily for consolidation.
- Innovation Barriers: High R&D investment needed for advanced features and miniaturization.
Optical Encoder ICs Growth Trends & Insights
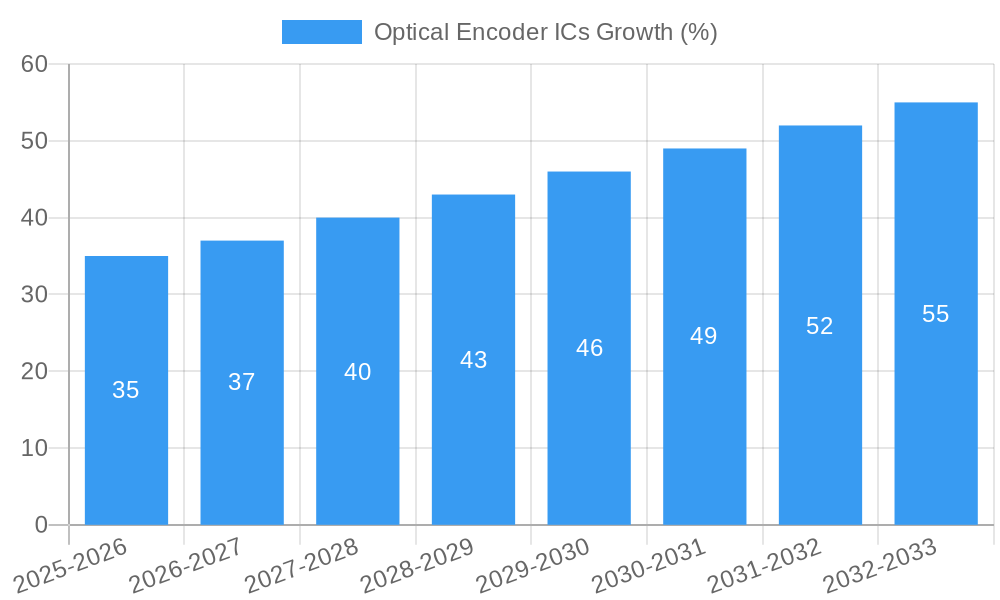
The Optical Encoder ICs market experienced a Compound Annual Growth Rate (CAGR) of xx% during the historical period (2019-2024), driven by the increasing demand for automation in diverse sectors and the growing adoption of sophisticated electronic devices. This growth is projected to continue, with a forecasted CAGR of xx% from 2025 to 2033. Technological advancements such as the integration of advanced signal processing capabilities and the development of smaller form factor devices are key drivers. Shifting consumer preferences towards higher precision and reliability in end-products further fuel market expansion. Market penetration is expected to increase from xx% in 2025 to xx% by 2033, primarily due to expanding applications in the automotive and industrial automation sectors.
Dominant Regions, Countries, or Segments in Optical Encoder ICs
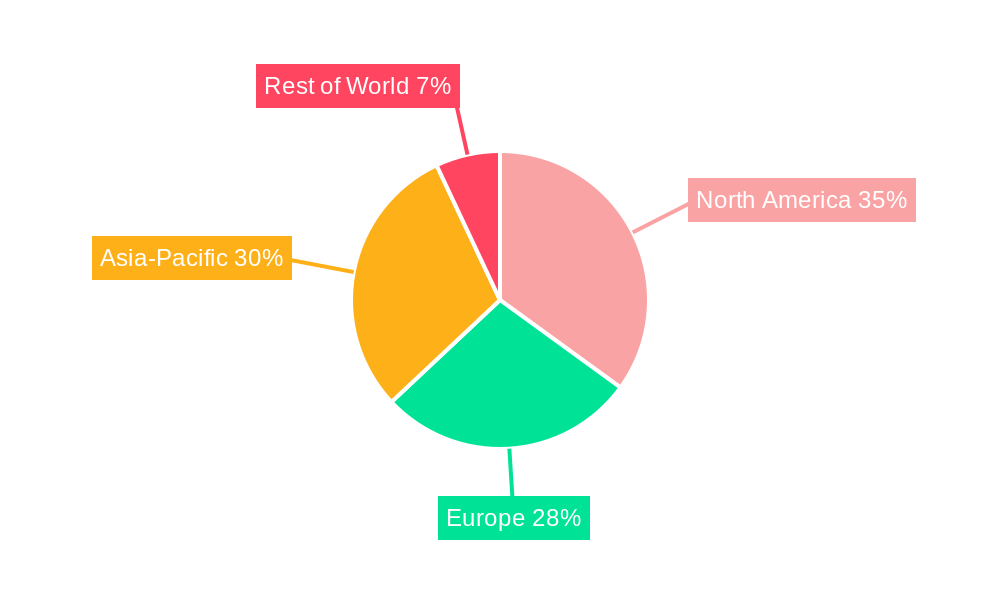
The Asia-Pacific region is currently the dominant market for Optical Encoder ICs, driven by significant growth in industrial automation, consumer electronics, and automotive manufacturing in countries like China, Japan, and South Korea. This dominance is attributed to a robust manufacturing base, a growing middle class, and supportive government policies promoting technological advancements. Europe and North America also hold significant market shares, driven by strong demand from the automotive and industrial sectors.
- Key Drivers in Asia-Pacific: Rapid industrialization, expanding electronics manufacturing, and government support for technological advancement.
- Key Drivers in Europe: High adoption rates in automotive and industrial automation sectors; stringent quality standards.
- Key Drivers in North America: Growing demand for precision and automation in various industries.
- Market Share: Asia-Pacific holds approximately xx% market share in 2025.
Optical Encoder ICs Product Landscape
Optical Encoder ICs encompass a range of products with varying resolutions, interface options (e.g., SPI, I2C), and packaging types. Recent innovations focus on integrating advanced signal processing capabilities to enhance accuracy and reduce noise. Miniaturization is another key trend, enabling the use of Optical Encoder ICs in space-constrained applications. Unique selling propositions include high accuracy, low power consumption, and robustness in harsh environments.
Key Drivers, Barriers & Challenges in Optical Encoder ICs
Key Drivers: Increased automation across various industries, growing demand for high-precision motion control, miniaturization of electronic devices, and advancements in sensor technology. The rising adoption of robotics and autonomous systems fuels further demand.
Key Challenges: Supply chain disruptions, particularly concerning semiconductor components, can impact production capacity and lead times. Intense competition from established players and emerging competitors necessitates continuous innovation and cost optimization. Stringent regulatory compliance requirements add to the complexity of product development and market entry.
Emerging Opportunities in Optical Encoder ICs
Emerging opportunities lie in untapped markets, such as smart home appliances, wearables, and medical devices, which require miniaturized, low-power, and high-accuracy sensors. The development of innovative applications in robotics, drones, and autonomous vehicles presents significant growth potential. Furthermore, evolving consumer preferences for enhanced precision and reliability in diverse end-products create new demand.
Growth Accelerators in the Optical Encoder ICs Industry
Technological breakthroughs in sensor technology, advanced signal processing, and miniaturization are driving long-term growth. Strategic partnerships and collaborations among manufacturers, component suppliers, and system integrators facilitate innovation and market penetration. Expanding into new geographical markets and targeting specific niche applications offers significant growth potential.
Key Players Shaping the Optical Encoder ICs Market
- iC-Haus
- Broadcom
- SEIKO NPC
- PREMA Semiconductor
- Hamamatsu
- New Japan Radio
Notable Milestones in Optical Encoder ICs Sector
- 2021: iC-Haus launches a new high-resolution optical encoder IC with integrated signal processing.
- 2022: Broadcom acquires a smaller encoder manufacturer, expanding its product portfolio.
- 2023: New Japan Radio introduces a low-power optical encoder IC targeting the wearables market.
In-Depth Optical Encoder ICs Market Outlook
The Optical Encoder ICs market is poised for robust growth in the coming years, driven by technological advancements, expanding applications across various industries, and the rising demand for automation. Strategic partnerships and investments in R&D will play a critical role in shaping the future landscape. The market will witness increasing competition, necessitating continuous innovation and cost optimization strategies for sustained success. The focus on miniaturization, high precision, and integration of advanced features will remain crucial for market leadership.
Optical Encoder ICs Segmentation
-
1. Application
- 1.1. Industrial Automation
- 1.2. Motors
- 1.3. Medical
- 1.4. Office Automation
- 1.5. Consumer Electronics
- 1.6. Semiconductor Equipment
- 1.7. Measurement Equipment
- 1.8. Others
-
2. Types
- 2.1. Transmissive Type
- 2.2. Reflective Type
Optical Encoder ICs Segmentation By Geography
-
1. North America
- 1.1. United States
- 1.2. Canada
- 1.3. Mexico
-
2. South America
- 2.1. Brazil
- 2.2. Argentina
- 2.3. Rest of South America
-
3. Europe
- 3.1. United Kingdom
- 3.2. Germany
- 3.3. France
- 3.4. Italy
- 3.5. Spain
- 3.6. Russia
- 3.7. Benelux
- 3.8. Nordics
- 3.9. Rest of Europe
-
4. Middle East & Africa
- 4.1. Turkey
- 4.2. Israel
- 4.3. GCC
- 4.4. North Africa
- 4.5. South Africa
- 4.6. Rest of Middle East & Africa
-
5. Asia Pacific
- 5.1. China
- 5.2. India
- 5.3. Japan
- 5.4. South Korea
- 5.5. ASEAN
- 5.6. Oceania
- 5.7. Rest of Asia Pacific
Optical Encoder ICs REPORT HIGHLIGHTS
| Aspects | Details |
|---|---|
| Study Period | 2019-2033 |
| Base Year | 2024 |
| Estimated Year | 2025 |
| Forecast Period | 2025-2033 |
| Historical Period | 2019-2024 |
| Growth Rate | CAGR of XX% from 2019-2033 |
| Segmentation |
|
Table of Contents
- 1. Introduction
- 1.1. Research Scope
- 1.2. Market Segmentation
- 1.3. Research Methodology
- 1.4. Definitions and Assumptions
- 2. Executive Summary
- 2.1. Introduction
- 3. Market Dynamics
- 3.1. Introduction
- 3.2. Market Drivers
- 3.3. Market Restrains
- 3.4. Market Trends
- 4. Market Factor Analysis
- 4.1. Porters Five Forces
- 4.2. Supply/Value Chain
- 4.3. PESTEL analysis
- 4.4. Market Entropy
- 4.5. Patent/Trademark Analysis
- 5. Global Optical Encoder ICs Analysis, Insights and Forecast, 2019-2031
- 5.1. Market Analysis, Insights and Forecast - by Application
- 5.1.1. Industrial Automation
- 5.1.2. Motors
- 5.1.3. Medical
- 5.1.4. Office Automation
- 5.1.5. Consumer Electronics
- 5.1.6. Semiconductor Equipment
- 5.1.7. Measurement Equipment
- 5.1.8. Others
- 5.2. Market Analysis, Insights and Forecast - by Types
- 5.2.1. Transmissive Type
- 5.2.2. Reflective Type
- 5.3. Market Analysis, Insights and Forecast - by Region
- 5.3.1. North America
- 5.3.2. South America
- 5.3.3. Europe
- 5.3.4. Middle East & Africa
- 5.3.5. Asia Pacific
- 5.1. Market Analysis, Insights and Forecast - by Application
- 6. North America Optical Encoder ICs Analysis, Insights and Forecast, 2019-2031
- 6.1. Market Analysis, Insights and Forecast - by Application
- 6.1.1. Industrial Automation
- 6.1.2. Motors
- 6.1.3. Medical
- 6.1.4. Office Automation
- 6.1.5. Consumer Electronics
- 6.1.6. Semiconductor Equipment
- 6.1.7. Measurement Equipment
- 6.1.8. Others
- 6.2. Market Analysis, Insights and Forecast - by Types
- 6.2.1. Transmissive Type
- 6.2.2. Reflective Type
- 6.1. Market Analysis, Insights and Forecast - by Application
- 7. South America Optical Encoder ICs Analysis, Insights and Forecast, 2019-2031
- 7.1. Market Analysis, Insights and Forecast - by Application
- 7.1.1. Industrial Automation
- 7.1.2. Motors
- 7.1.3. Medical
- 7.1.4. Office Automation
- 7.1.5. Consumer Electronics
- 7.1.6. Semiconductor Equipment
- 7.1.7. Measurement Equipment
- 7.1.8. Others
- 7.2. Market Analysis, Insights and Forecast - by Types
- 7.2.1. Transmissive Type
- 7.2.2. Reflective Type
- 7.1. Market Analysis, Insights and Forecast - by Application
- 8. Europe Optical Encoder ICs Analysis, Insights and Forecast, 2019-2031
- 8.1. Market Analysis, Insights and Forecast - by Application
- 8.1.1. Industrial Automation
- 8.1.2. Motors
- 8.1.3. Medical
- 8.1.4. Office Automation
- 8.1.5. Consumer Electronics
- 8.1.6. Semiconductor Equipment
- 8.1.7. Measurement Equipment
- 8.1.8. Others
- 8.2. Market Analysis, Insights and Forecast - by Types
- 8.2.1. Transmissive Type
- 8.2.2. Reflective Type
- 8.1. Market Analysis, Insights and Forecast - by Application
- 9. Middle East & Africa Optical Encoder ICs Analysis, Insights and Forecast, 2019-2031
- 9.1. Market Analysis, Insights and Forecast - by Application
- 9.1.1. Industrial Automation
- 9.1.2. Motors
- 9.1.3. Medical
- 9.1.4. Office Automation
- 9.1.5. Consumer Electronics
- 9.1.6. Semiconductor Equipment
- 9.1.7. Measurement Equipment
- 9.1.8. Others
- 9.2. Market Analysis, Insights and Forecast - by Types
- 9.2.1. Transmissive Type
- 9.2.2. Reflective Type
- 9.1. Market Analysis, Insights and Forecast - by Application
- 10. Asia Pacific Optical Encoder ICs Analysis, Insights and Forecast, 2019-2031
- 10.1. Market Analysis, Insights and Forecast - by Application
- 10.1.1. Industrial Automation
- 10.1.2. Motors
- 10.1.3. Medical
- 10.1.4. Office Automation
- 10.1.5. Consumer Electronics
- 10.1.6. Semiconductor Equipment
- 10.1.7. Measurement Equipment
- 10.1.8. Others
- 10.2. Market Analysis, Insights and Forecast - by Types
- 10.2.1. Transmissive Type
- 10.2.2. Reflective Type
- 10.1. Market Analysis, Insights and Forecast - by Application
- 11. Competitive Analysis
- 11.1. Global Market Share Analysis 2024
- 11.2. Company Profiles
- 11.2.1 iC-Haus
- 11.2.1.1. Overview
- 11.2.1.2. Products
- 11.2.1.3. SWOT Analysis
- 11.2.1.4. Recent Developments
- 11.2.1.5. Financials (Based on Availability)
- 11.2.2 Broadcom
- 11.2.2.1. Overview
- 11.2.2.2. Products
- 11.2.2.3. SWOT Analysis
- 11.2.2.4. Recent Developments
- 11.2.2.5. Financials (Based on Availability)
- 11.2.3 SEIKO NPC
- 11.2.3.1. Overview
- 11.2.3.2. Products
- 11.2.3.3. SWOT Analysis
- 11.2.3.4. Recent Developments
- 11.2.3.5. Financials (Based on Availability)
- 11.2.4 PREMA Semiconductor
- 11.2.4.1. Overview
- 11.2.4.2. Products
- 11.2.4.3. SWOT Analysis
- 11.2.4.4. Recent Developments
- 11.2.4.5. Financials (Based on Availability)
- 11.2.5 Hamamatsu
- 11.2.5.1. Overview
- 11.2.5.2. Products
- 11.2.5.3. SWOT Analysis
- 11.2.5.4. Recent Developments
- 11.2.5.5. Financials (Based on Availability)
- 11.2.6 New Japan Radio
- 11.2.6.1. Overview
- 11.2.6.2. Products
- 11.2.6.3. SWOT Analysis
- 11.2.6.4. Recent Developments
- 11.2.6.5. Financials (Based on Availability)
- 11.2.1 iC-Haus
List of Figures
- Figure 1: Global Optical Encoder ICs Revenue Breakdown (million, %) by Region 2024 & 2032
- Figure 2: Global Optical Encoder ICs Volume Breakdown (K, %) by Region 2024 & 2032
- Figure 3: North America Optical Encoder ICs Revenue (million), by Application 2024 & 2032
- Figure 4: North America Optical Encoder ICs Volume (K), by Application 2024 & 2032
- Figure 5: North America Optical Encoder ICs Revenue Share (%), by Application 2024 & 2032
- Figure 6: North America Optical Encoder ICs Volume Share (%), by Application 2024 & 2032
- Figure 7: North America Optical Encoder ICs Revenue (million), by Types 2024 & 2032
- Figure 8: North America Optical Encoder ICs Volume (K), by Types 2024 & 2032
- Figure 9: North America Optical Encoder ICs Revenue Share (%), by Types 2024 & 2032
- Figure 10: North America Optical Encoder ICs Volume Share (%), by Types 2024 & 2032
- Figure 11: North America Optical Encoder ICs Revenue (million), by Country 2024 & 2032
- Figure 12: North America Optical Encoder ICs Volume (K), by Country 2024 & 2032
- Figure 13: North America Optical Encoder ICs Revenue Share (%), by Country 2024 & 2032
- Figure 14: North America Optical Encoder ICs Volume Share (%), by Country 2024 & 2032
- Figure 15: South America Optical Encoder ICs Revenue (million), by Application 2024 & 2032
- Figure 16: South America Optical Encoder ICs Volume (K), by Application 2024 & 2032
- Figure 17: South America Optical Encoder ICs Revenue Share (%), by Application 2024 & 2032
- Figure 18: South America Optical Encoder ICs Volume Share (%), by Application 2024 & 2032
- Figure 19: South America Optical Encoder ICs Revenue (million), by Types 2024 & 2032
- Figure 20: South America Optical Encoder ICs Volume (K), by Types 2024 & 2032
- Figure 21: South America Optical Encoder ICs Revenue Share (%), by Types 2024 & 2032
- Figure 22: South America Optical Encoder ICs Volume Share (%), by Types 2024 & 2032
- Figure 23: South America Optical Encoder ICs Revenue (million), by Country 2024 & 2032
- Figure 24: South America Optical Encoder ICs Volume (K), by Country 2024 & 2032
- Figure 25: South America Optical Encoder ICs Revenue Share (%), by Country 2024 & 2032
- Figure 26: South America Optical Encoder ICs Volume Share (%), by Country 2024 & 2032
- Figure 27: Europe Optical Encoder ICs Revenue (million), by Application 2024 & 2032
- Figure 28: Europe Optical Encoder ICs Volume (K), by Application 2024 & 2032
- Figure 29: Europe Optical Encoder ICs Revenue Share (%), by Application 2024 & 2032
- Figure 30: Europe Optical Encoder ICs Volume Share (%), by Application 2024 & 2032
- Figure 31: Europe Optical Encoder ICs Revenue (million), by Types 2024 & 2032
- Figure 32: Europe Optical Encoder ICs Volume (K), by Types 2024 & 2032
- Figure 33: Europe Optical Encoder ICs Revenue Share (%), by Types 2024 & 2032
- Figure 34: Europe Optical Encoder ICs Volume Share (%), by Types 2024 & 2032
- Figure 35: Europe Optical Encoder ICs Revenue (million), by Country 2024 & 2032
- Figure 36: Europe Optical Encoder ICs Volume (K), by Country 2024 & 2032
- Figure 37: Europe Optical Encoder ICs Revenue Share (%), by Country 2024 & 2032
- Figure 38: Europe Optical Encoder ICs Volume Share (%), by Country 2024 & 2032
- Figure 39: Middle East & Africa Optical Encoder ICs Revenue (million), by Application 2024 & 2032
- Figure 40: Middle East & Africa Optical Encoder ICs Volume (K), by Application 2024 & 2032
- Figure 41: Middle East & Africa Optical Encoder ICs Revenue Share (%), by Application 2024 & 2032
- Figure 42: Middle East & Africa Optical Encoder ICs Volume Share (%), by Application 2024 & 2032
- Figure 43: Middle East & Africa Optical Encoder ICs Revenue (million), by Types 2024 & 2032
- Figure 44: Middle East & Africa Optical Encoder ICs Volume (K), by Types 2024 & 2032
- Figure 45: Middle East & Africa Optical Encoder ICs Revenue Share (%), by Types 2024 & 2032
- Figure 46: Middle East & Africa Optical Encoder ICs Volume Share (%), by Types 2024 & 2032
- Figure 47: Middle East & Africa Optical Encoder ICs Revenue (million), by Country 2024 & 2032
- Figure 48: Middle East & Africa Optical Encoder ICs Volume (K), by Country 2024 & 2032
- Figure 49: Middle East & Africa Optical Encoder ICs Revenue Share (%), by Country 2024 & 2032
- Figure 50: Middle East & Africa Optical Encoder ICs Volume Share (%), by Country 2024 & 2032
- Figure 51: Asia Pacific Optical Encoder ICs Revenue (million), by Application 2024 & 2032
- Figure 52: Asia Pacific Optical Encoder ICs Volume (K), by Application 2024 & 2032
- Figure 53: Asia Pacific Optical Encoder ICs Revenue Share (%), by Application 2024 & 2032
- Figure 54: Asia Pacific Optical Encoder ICs Volume Share (%), by Application 2024 & 2032
- Figure 55: Asia Pacific Optical Encoder ICs Revenue (million), by Types 2024 & 2032
- Figure 56: Asia Pacific Optical Encoder ICs Volume (K), by Types 2024 & 2032
- Figure 57: Asia Pacific Optical Encoder ICs Revenue Share (%), by Types 2024 & 2032
- Figure 58: Asia Pacific Optical Encoder ICs Volume Share (%), by Types 2024 & 2032
- Figure 59: Asia Pacific Optical Encoder ICs Revenue (million), by Country 2024 & 2032
- Figure 60: Asia Pacific Optical Encoder ICs Volume (K), by Country 2024 & 2032
- Figure 61: Asia Pacific Optical Encoder ICs Revenue Share (%), by Country 2024 & 2032
- Figure 62: Asia Pacific Optical Encoder ICs Volume Share (%), by Country 2024 & 2032
List of Tables
- Table 1: Global Optical Encoder ICs Revenue million Forecast, by Region 2019 & 2032
- Table 2: Global Optical Encoder ICs Volume K Forecast, by Region 2019 & 2032
- Table 3: Global Optical Encoder ICs Revenue million Forecast, by Application 2019 & 2032
- Table 4: Global Optical Encoder ICs Volume K Forecast, by Application 2019 & 2032
- Table 5: Global Optical Encoder ICs Revenue million Forecast, by Types 2019 & 2032
- Table 6: Global Optical Encoder ICs Volume K Forecast, by Types 2019 & 2032
- Table 7: Global Optical Encoder ICs Revenue million Forecast, by Region 2019 & 2032
- Table 8: Global Optical Encoder ICs Volume K Forecast, by Region 2019 & 2032
- Table 9: Global Optical Encoder ICs Revenue million Forecast, by Application 2019 & 2032
- Table 10: Global Optical Encoder ICs Volume K Forecast, by Application 2019 & 2032
- Table 11: Global Optical Encoder ICs Revenue million Forecast, by Types 2019 & 2032
- Table 12: Global Optical Encoder ICs Volume K Forecast, by Types 2019 & 2032
- Table 13: Global Optical Encoder ICs Revenue million Forecast, by Country 2019 & 2032
- Table 14: Global Optical Encoder ICs Volume K Forecast, by Country 2019 & 2032
- Table 15: United States Optical Encoder ICs Revenue (million) Forecast, by Application 2019 & 2032
- Table 16: United States Optical Encoder ICs Volume (K) Forecast, by Application 2019 & 2032
- Table 17: Canada Optical Encoder ICs Revenue (million) Forecast, by Application 2019 & 2032
- Table 18: Canada Optical Encoder ICs Volume (K) Forecast, by Application 2019 & 2032
- Table 19: Mexico Optical Encoder ICs Revenue (million) Forecast, by Application 2019 & 2032
- Table 20: Mexico Optical Encoder ICs Volume (K) Forecast, by Application 2019 & 2032
- Table 21: Global Optical Encoder ICs Revenue million Forecast, by Application 2019 & 2032
- Table 22: Global Optical Encoder ICs Volume K Forecast, by Application 2019 & 2032
- Table 23: Global Optical Encoder ICs Revenue million Forecast, by Types 2019 & 2032
- Table 24: Global Optical Encoder ICs Volume K Forecast, by Types 2019 & 2032
- Table 25: Global Optical Encoder ICs Revenue million Forecast, by Country 2019 & 2032
- Table 26: Global Optical Encoder ICs Volume K Forecast, by Country 2019 & 2032
- Table 27: Brazil Optical Encoder ICs Revenue (million) Forecast, by Application 2019 & 2032
- Table 28: Brazil Optical Encoder ICs Volume (K) Forecast, by Application 2019 & 2032
- Table 29: Argentina Optical Encoder ICs Revenue (million) Forecast, by Application 2019 & 2032
- Table 30: Argentina Optical Encoder ICs Volume (K) Forecast, by Application 2019 & 2032
- Table 31: Rest of South America Optical Encoder ICs Revenue (million) Forecast, by Application 2019 & 2032
- Table 32: Rest of South America Optical Encoder ICs Volume (K) Forecast, by Application 2019 & 2032
- Table 33: Global Optical Encoder ICs Revenue million Forecast, by Application 2019 & 2032
- Table 34: Global Optical Encoder ICs Volume K Forecast, by Application 2019 & 2032
- Table 35: Global Optical Encoder ICs Revenue million Forecast, by Types 2019 & 2032
- Table 36: Global Optical Encoder ICs Volume K Forecast, by Types 2019 & 2032
- Table 37: Global Optical Encoder ICs Revenue million Forecast, by Country 2019 & 2032
- Table 38: Global Optical Encoder ICs Volume K Forecast, by Country 2019 & 2032
- Table 39: United Kingdom Optical Encoder ICs Revenue (million) Forecast, by Application 2019 & 2032
- Table 40: United Kingdom Optical Encoder ICs Volume (K) Forecast, by Application 2019 & 2032
- Table 41: Germany Optical Encoder ICs Revenue (million) Forecast, by Application 2019 & 2032
- Table 42: Germany Optical Encoder ICs Volume (K) Forecast, by Application 2019 & 2032
- Table 43: France Optical Encoder ICs Revenue (million) Forecast, by Application 2019 & 2032
- Table 44: France Optical Encoder ICs Volume (K) Forecast, by Application 2019 & 2032
- Table 45: Italy Optical Encoder ICs Revenue (million) Forecast, by Application 2019 & 2032
- Table 46: Italy Optical Encoder ICs Volume (K) Forecast, by Application 2019 & 2032
- Table 47: Spain Optical Encoder ICs Revenue (million) Forecast, by Application 2019 & 2032
- Table 48: Spain Optical Encoder ICs Volume (K) Forecast, by Application 2019 & 2032
- Table 49: Russia Optical Encoder ICs Revenue (million) Forecast, by Application 2019 & 2032
- Table 50: Russia Optical Encoder ICs Volume (K) Forecast, by Application 2019 & 2032
- Table 51: Benelux Optical Encoder ICs Revenue (million) Forecast, by Application 2019 & 2032
- Table 52: Benelux Optical Encoder ICs Volume (K) Forecast, by Application 2019 & 2032
- Table 53: Nordics Optical Encoder ICs Revenue (million) Forecast, by Application 2019 & 2032
- Table 54: Nordics Optical Encoder ICs Volume (K) Forecast, by Application 2019 & 2032
- Table 55: Rest of Europe Optical Encoder ICs Revenue (million) Forecast, by Application 2019 & 2032
- Table 56: Rest of Europe Optical Encoder ICs Volume (K) Forecast, by Application 2019 & 2032
- Table 57: Global Optical Encoder ICs Revenue million Forecast, by Application 2019 & 2032
- Table 58: Global Optical Encoder ICs Volume K Forecast, by Application 2019 & 2032
- Table 59: Global Optical Encoder ICs Revenue million Forecast, by Types 2019 & 2032
- Table 60: Global Optical Encoder ICs Volume K Forecast, by Types 2019 & 2032
- Table 61: Global Optical Encoder ICs Revenue million Forecast, by Country 2019 & 2032
- Table 62: Global Optical Encoder ICs Volume K Forecast, by Country 2019 & 2032
- Table 63: Turkey Optical Encoder ICs Revenue (million) Forecast, by Application 2019 & 2032
- Table 64: Turkey Optical Encoder ICs Volume (K) Forecast, by Application 2019 & 2032
- Table 65: Israel Optical Encoder ICs Revenue (million) Forecast, by Application 2019 & 2032
- Table 66: Israel Optical Encoder ICs Volume (K) Forecast, by Application 2019 & 2032
- Table 67: GCC Optical Encoder ICs Revenue (million) Forecast, by Application 2019 & 2032
- Table 68: GCC Optical Encoder ICs Volume (K) Forecast, by Application 2019 & 2032
- Table 69: North Africa Optical Encoder ICs Revenue (million) Forecast, by Application 2019 & 2032
- Table 70: North Africa Optical Encoder ICs Volume (K) Forecast, by Application 2019 & 2032
- Table 71: South Africa Optical Encoder ICs Revenue (million) Forecast, by Application 2019 & 2032
- Table 72: South Africa Optical Encoder ICs Volume (K) Forecast, by Application 2019 & 2032
- Table 73: Rest of Middle East & Africa Optical Encoder ICs Revenue (million) Forecast, by Application 2019 & 2032
- Table 74: Rest of Middle East & Africa Optical Encoder ICs Volume (K) Forecast, by Application 2019 & 2032
- Table 75: Global Optical Encoder ICs Revenue million Forecast, by Application 2019 & 2032
- Table 76: Global Optical Encoder ICs Volume K Forecast, by Application 2019 & 2032
- Table 77: Global Optical Encoder ICs Revenue million Forecast, by Types 2019 & 2032
- Table 78: Global Optical Encoder ICs Volume K Forecast, by Types 2019 & 2032
- Table 79: Global Optical Encoder ICs Revenue million Forecast, by Country 2019 & 2032
- Table 80: Global Optical Encoder ICs Volume K Forecast, by Country 2019 & 2032
- Table 81: China Optical Encoder ICs Revenue (million) Forecast, by Application 2019 & 2032
- Table 82: China Optical Encoder ICs Volume (K) Forecast, by Application 2019 & 2032
- Table 83: India Optical Encoder ICs Revenue (million) Forecast, by Application 2019 & 2032
- Table 84: India Optical Encoder ICs Volume (K) Forecast, by Application 2019 & 2032
- Table 85: Japan Optical Encoder ICs Revenue (million) Forecast, by Application 2019 & 2032
- Table 86: Japan Optical Encoder ICs Volume (K) Forecast, by Application 2019 & 2032
- Table 87: South Korea Optical Encoder ICs Revenue (million) Forecast, by Application 2019 & 2032
- Table 88: South Korea Optical Encoder ICs Volume (K) Forecast, by Application 2019 & 2032
- Table 89: ASEAN Optical Encoder ICs Revenue (million) Forecast, by Application 2019 & 2032
- Table 90: ASEAN Optical Encoder ICs Volume (K) Forecast, by Application 2019 & 2032
- Table 91: Oceania Optical Encoder ICs Revenue (million) Forecast, by Application 2019 & 2032
- Table 92: Oceania Optical Encoder ICs Volume (K) Forecast, by Application 2019 & 2032
- Table 93: Rest of Asia Pacific Optical Encoder ICs Revenue (million) Forecast, by Application 2019 & 2032
- Table 94: Rest of Asia Pacific Optical Encoder ICs Volume (K) Forecast, by Application 2019 & 2032
Frequently Asked Questions
1. What is the projected Compound Annual Growth Rate (CAGR) of the Optical Encoder ICs?
The projected CAGR is approximately XX%.
2. Which companies are prominent players in the Optical Encoder ICs?
Key companies in the market include iC-Haus, Broadcom, SEIKO NPC, PREMA Semiconductor, Hamamatsu, New Japan Radio.
3. What are the main segments of the Optical Encoder ICs?
The market segments include Application, Types.
4. Can you provide details about the market size?
The market size is estimated to be USD XXX million as of 2022.
5. What are some drivers contributing to market growth?
N/A
6. What are the notable trends driving market growth?
N/A
7. Are there any restraints impacting market growth?
N/A
8. Can you provide examples of recent developments in the market?
N/A
9. What pricing options are available for accessing the report?
Pricing options include single-user, multi-user, and enterprise licenses priced at USD 3350.00, USD 5025.00, and USD 6700.00 respectively.
10. Is the market size provided in terms of value or volume?
The market size is provided in terms of value, measured in million and volume, measured in K.
11. Are there any specific market keywords associated with the report?
Yes, the market keyword associated with the report is "Optical Encoder ICs," which aids in identifying and referencing the specific market segment covered.
12. How do I determine which pricing option suits my needs best?
The pricing options vary based on user requirements and access needs. Individual users may opt for single-user licenses, while businesses requiring broader access may choose multi-user or enterprise licenses for cost-effective access to the report.
13. Are there any additional resources or data provided in the Optical Encoder ICs report?
While the report offers comprehensive insights, it's advisable to review the specific contents or supplementary materials provided to ascertain if additional resources or data are available.
14. How can I stay updated on further developments or reports in the Optical Encoder ICs?
To stay informed about further developments, trends, and reports in the Optical Encoder ICs, consider subscribing to industry newsletters, following relevant companies and organizations, or regularly checking reputable industry news sources and publications.
Methodology
Step 1 - Identification of Relevant Samples Size from Population Database


Step 2 - Approaches for Defining Global Market Size (Value, Volume* & Price*)

Note*: In applicable scenarios
Step 3 - Data Sources
Primary Research
- Web Analytics
- Survey Reports
- Research Institute
- Latest Research Reports
- Opinion Leaders
Secondary Research
- Annual Reports
- White Paper
- Latest Press Release
- Industry Association
- Paid Database
- Investor Presentations

Step 4 - Data Triangulation
Involves using different sources of information in order to increase the validity of a study
These sources are likely to be stakeholders in a program - participants, other researchers, program staff, other community members, and so on.
Then we put all data in single framework & apply various statistical tools to find out the dynamic on the market.
During the analysis stage, feedback from the stakeholder groups would be compared to determine areas of agreement as well as areas of divergence
