

Key Insights
The physisorption analysis market is experiencing robust growth, driven by increasing demand across diverse sectors like materials science, catalysis research, and environmental monitoring. The market's expansion is fueled by advancements in instrumentation technology, offering higher sensitivity, automation, and data analysis capabilities. This, coupled with the rising need for precise characterization of porous materials in applications ranging from drug delivery systems to energy storage, is significantly contributing to market expansion. While precise market sizing requires proprietary data, a reasonable estimate suggests a current market value in the hundreds of millions of dollars, based on the presence of several established players and the high-value nature of the equipment and associated services. A conservative compound annual growth rate (CAGR) of 6-8% is projected for the forecast period (2025-2033), driven by ongoing research activities in nanotechnology and the expanding adoption of physisorption techniques for quality control and research and development in various industries.
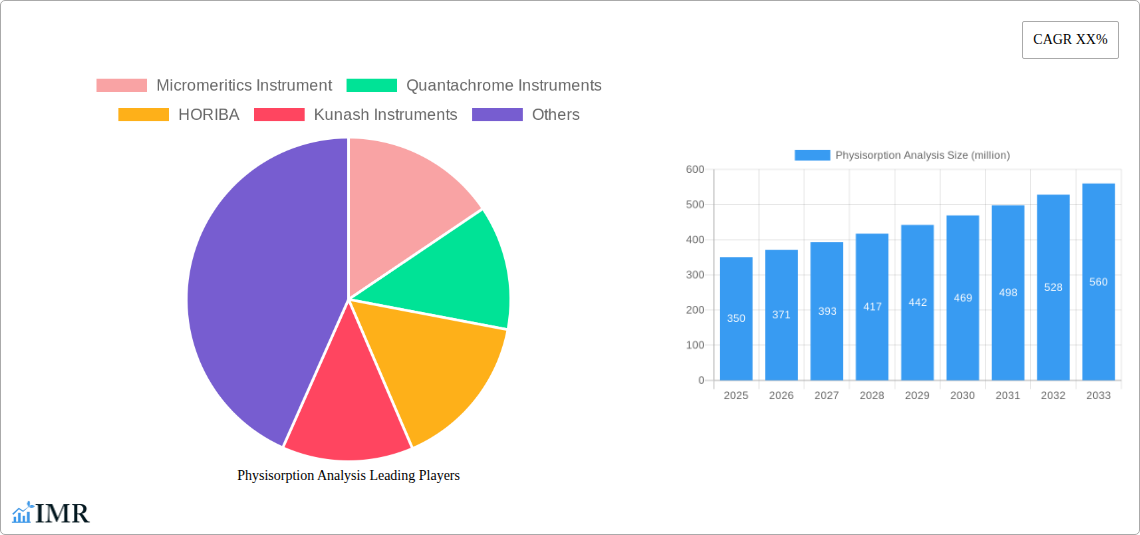
Growth is further bolstered by ongoing developments in isotherm modeling and data analysis software, enabling more sophisticated interpretations of surface area, pore size distribution, and other crucial material properties. However, the market faces certain restraints, including the high cost of advanced instrumentation and the specialized skillset required for data interpretation and analysis. Competitive landscape is relatively consolidated, with key players like Micromeritics Instrument, Quantachrome Instruments, HORIBA, and Kunash Instruments vying for market share through continuous innovation and strategic partnerships. Regional distribution is expected to be skewed towards developed economies initially, with North America and Europe holding significant market share due to advanced research infrastructure and higher adoption rates. However, emerging economies in Asia-Pacific are expected to witness a faster rate of growth in the coming years due to increasing industrialization and government initiatives supporting scientific research.
Physisorption Analysis Market Report: 2019-2033
This comprehensive report provides a detailed analysis of the Physisorption Analysis market, offering invaluable insights for industry professionals, investors, and researchers. Covering the period 2019-2033, with a focus on 2025, this report leverages extensive primary and secondary research to deliver a 360° view of this dynamic sector. The global Physisorption Analysis market is projected to reach xx million by 2033, exhibiting a CAGR of xx% during the forecast period (2025-2033). Parent market segments include Materials Characterization and the child market is Gas Adsorption Analysis.
Physisorption Analysis Market Dynamics & Structure
The Physisorption Analysis market is moderately concentrated, with key players such as Micromeritics Instrument, Quantachrome Instruments, HORIBA, and Kunash Instruments holding significant market share. The market structure is characterized by intense competition driven by technological innovation and continuous product improvement. Regulatory frameworks, particularly concerning environmental regulations and safety standards, significantly impact market growth. Competitive substitutes, such as other surface area analysis techniques, pose a challenge. End-user demographics are diverse, encompassing academic research institutions, industrial laboratories, and various manufacturing sectors. The M&A landscape has witnessed xx deals in the past five years, indicating a moderate level of consolidation.
- Market Concentration: Moderately concentrated, with top four players holding approximately xx% market share in 2025.
- Technological Innovation: Significant R&D investments in improving instrument sensitivity, automation, and data analysis capabilities.
- Regulatory Landscape: Stringent environmental regulations driving demand for precise and reliable analysis.
- Competitive Substitutes: Other surface area analysis methods, such as BET, represent a competitive pressure.
- End-User Demographics: Diverse, including academic, industrial, and manufacturing sectors.
- M&A Activity: xx deals in the historical period (2019-2024), indicating moderate consolidation.
Physisorption Analysis Growth Trends & Insights
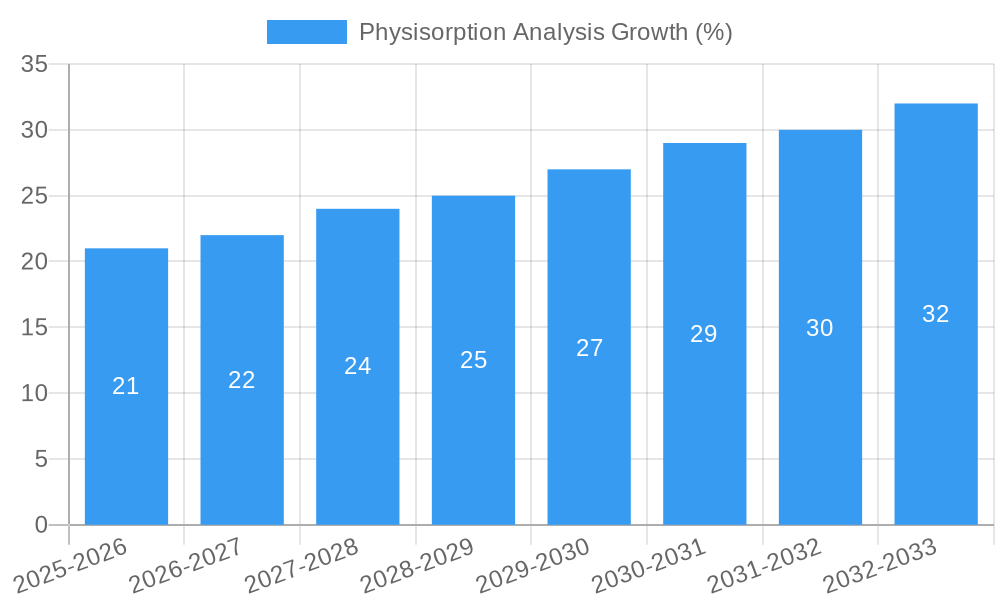
The Physisorption Analysis market experienced robust growth during the historical period (2019-2024), driven by increasing demand for advanced materials characterization in various industries. Market size expanded from xx million in 2019 to xx million in 2024. Adoption rates have increased steadily, particularly in the pharmaceutical and materials science sectors. Technological disruptions, including the development of high-throughput systems and improved data analysis software, have accelerated market expansion. Shifting consumer behavior toward demanding more precise and rapid analytical solutions has further fueled market growth. The market is projected to continue its growth trajectory, with a CAGR of xx% from 2025 to 2033.
- Market Size Evolution: Significant growth from xx million in 2019 to xx million in 2024.
- Adoption Rates: Steady increase across various industries, particularly pharmaceuticals and materials science.
- Technological Disruptions: High-throughput systems and advanced software are driving adoption.
- Consumer Behavior Shifts: Demand for precise, rapid analysis is a major growth driver.
Dominant Regions, Countries, or Segments in Physisorption Analysis
North America currently dominates the Physisorption Analysis market, owing to the presence of major instrument manufacturers, strong R&D investment, and a robust pharmaceutical industry. Europe follows as a significant market, driven by stringent environmental regulations and a large academic research sector. Asia-Pacific is witnessing substantial growth, fueled by rapid industrialization and increasing demand for advanced materials.
- North America: Dominant due to strong R&D, manufacturing presence, and pharmaceutical industry.
- Europe: Significant market driven by regulations and research.
- Asia-Pacific: Rapid growth due to industrialization and demand for advanced materials.
- Key Drivers: Government funding for research, stringent environmental regulations, and technological advancements.
Physisorption Analysis Product Landscape
The Physisorption Analysis product landscape is characterized by a range of instruments offering varying levels of automation, sensitivity, and analytical capabilities. Innovations focus on improving data accuracy, reducing analysis time, and enhancing user-friendliness. Applications span various industries, including pharmaceuticals, catalysis, energy storage, and environmental science. Key performance metrics include surface area, pore size distribution, and pore volume. Unique selling propositions often center on high precision, ease of use, and advanced software capabilities.
Key Drivers, Barriers & Challenges in Physisorption Analysis
Key Drivers: Increasing demand for advanced materials characterization across various industries, stringent environmental regulations, advancements in instrumentation technology, and government funding for research and development.
Challenges: High instrument costs can limit accessibility, particularly for smaller research groups or developing countries. Competition from alternative analytical techniques and the need for skilled operators can also pose challenges. Supply chain disruptions related to specialized components can impact instrument availability.
Emerging Opportunities in Physisorption Analysis
Emerging opportunities lie in the growing demand for characterization of novel materials, such as nanomaterials and porous materials for energy storage applications. Expanding into emerging markets, especially in developing economies with growing industrial sectors, presents significant opportunities. The development of miniaturized and portable devices will also open up new applications and markets.
Growth Accelerators in the Physisorption Analysis Industry
Technological breakthroughs, including the development of high-throughput systems and improved data analysis software, are major growth catalysts. Strategic partnerships between instrument manufacturers and research institutions are facilitating innovation and market expansion. Government initiatives to promote research in materials science are also fueling market growth.
Key Players Shaping the Physisorption Analysis Market
- Micromeritics Instrument
- Quantachrome Instruments
- HORIBA
- Kunash Instruments
Notable Milestones in Physisorption Analysis Sector
- 2020: Micromeritics launches a new high-throughput physisorption analyzer.
- 2022: Quantachrome introduces advanced data analysis software.
- 2023: HORIBA acquires a smaller physisorption analysis company, expanding its product portfolio.
In-Depth Physisorption Analysis Market Outlook
The Physisorption Analysis market is poised for sustained growth, driven by ongoing technological advancements, expanding applications across various industries, and increasing regulatory scrutiny. Strategic opportunities exist in developing innovative products, expanding into new geographical markets, and forging strategic collaborations to enhance market reach and penetration. The long-term outlook for the market is extremely positive.
Physisorption Analysis Segmentation
-
1. Application
- 1.1. Pharmaceutical
- 1.2. Nanotechnology
- 1.3. Metallurgy
- 1.4. Materials Science
-
2. Types
- 2.1. Surface Area Analysis
- 2.2. Porosity Determination
Physisorption Analysis Segmentation By Geography
-
1. North America
- 1.1. United States
- 1.2. Canada
- 1.3. Mexico
-
2. South America
- 2.1. Brazil
- 2.2. Argentina
- 2.3. Rest of South America
-
3. Europe
- 3.1. United Kingdom
- 3.2. Germany
- 3.3. France
- 3.4. Italy
- 3.5. Spain
- 3.6. Russia
- 3.7. Benelux
- 3.8. Nordics
- 3.9. Rest of Europe
-
4. Middle East & Africa
- 4.1. Turkey
- 4.2. Israel
- 4.3. GCC
- 4.4. North Africa
- 4.5. South Africa
- 4.6. Rest of Middle East & Africa
-
5. Asia Pacific
- 5.1. China
- 5.2. India
- 5.3. Japan
- 5.4. South Korea
- 5.5. ASEAN
- 5.6. Oceania
- 5.7. Rest of Asia Pacific

Physisorption Analysis REPORT HIGHLIGHTS
| Aspects | Details |
|---|---|
| Study Period | 2019-2033 |
| Base Year | 2024 |
| Estimated Year | 2025 |
| Forecast Period | 2025-2033 |
| Historical Period | 2019-2024 |
| Growth Rate | CAGR of XX% from 2019-2033 |
| Segmentation |
|
Table of Contents
- 1. Introduction
- 1.1. Research Scope
- 1.2. Market Segmentation
- 1.3. Research Methodology
- 1.4. Definitions and Assumptions
- 2. Executive Summary
- 2.1. Introduction
- 3. Market Dynamics
- 3.1. Introduction
- 3.2. Market Drivers
- 3.3. Market Restrains
- 3.4. Market Trends
- 4. Market Factor Analysis
- 4.1. Porters Five Forces
- 4.2. Supply/Value Chain
- 4.3. PESTEL analysis
- 4.4. Market Entropy
- 4.5. Patent/Trademark Analysis
- 5. Global Physisorption Analysis Analysis, Insights and Forecast, 2019-2031
- 5.1. Market Analysis, Insights and Forecast - by Application
- 5.1.1. Pharmaceutical
- 5.1.2. Nanotechnology
- 5.1.3. Metallurgy
- 5.1.4. Materials Science
- 5.2. Market Analysis, Insights and Forecast - by Types
- 5.2.1. Surface Area Analysis
- 5.2.2. Porosity Determination
- 5.3. Market Analysis, Insights and Forecast - by Region
- 5.3.1. North America
- 5.3.2. South America
- 5.3.3. Europe
- 5.3.4. Middle East & Africa
- 5.3.5. Asia Pacific
- 5.1. Market Analysis, Insights and Forecast - by Application
- 6. North America Physisorption Analysis Analysis, Insights and Forecast, 2019-2031
- 6.1. Market Analysis, Insights and Forecast - by Application
- 6.1.1. Pharmaceutical
- 6.1.2. Nanotechnology
- 6.1.3. Metallurgy
- 6.1.4. Materials Science
- 6.2. Market Analysis, Insights and Forecast - by Types
- 6.2.1. Surface Area Analysis
- 6.2.2. Porosity Determination
- 6.1. Market Analysis, Insights and Forecast - by Application
- 7. South America Physisorption Analysis Analysis, Insights and Forecast, 2019-2031
- 7.1. Market Analysis, Insights and Forecast - by Application
- 7.1.1. Pharmaceutical
- 7.1.2. Nanotechnology
- 7.1.3. Metallurgy
- 7.1.4. Materials Science
- 7.2. Market Analysis, Insights and Forecast - by Types
- 7.2.1. Surface Area Analysis
- 7.2.2. Porosity Determination
- 7.1. Market Analysis, Insights and Forecast - by Application
- 8. Europe Physisorption Analysis Analysis, Insights and Forecast, 2019-2031
- 8.1. Market Analysis, Insights and Forecast - by Application
- 8.1.1. Pharmaceutical
- 8.1.2. Nanotechnology
- 8.1.3. Metallurgy
- 8.1.4. Materials Science
- 8.2. Market Analysis, Insights and Forecast - by Types
- 8.2.1. Surface Area Analysis
- 8.2.2. Porosity Determination
- 8.1. Market Analysis, Insights and Forecast - by Application
- 9. Middle East & Africa Physisorption Analysis Analysis, Insights and Forecast, 2019-2031
- 9.1. Market Analysis, Insights and Forecast - by Application
- 9.1.1. Pharmaceutical
- 9.1.2. Nanotechnology
- 9.1.3. Metallurgy
- 9.1.4. Materials Science
- 9.2. Market Analysis, Insights and Forecast - by Types
- 9.2.1. Surface Area Analysis
- 9.2.2. Porosity Determination
- 9.1. Market Analysis, Insights and Forecast - by Application
- 10. Asia Pacific Physisorption Analysis Analysis, Insights and Forecast, 2019-2031
- 10.1. Market Analysis, Insights and Forecast - by Application
- 10.1.1. Pharmaceutical
- 10.1.2. Nanotechnology
- 10.1.3. Metallurgy
- 10.1.4. Materials Science
- 10.2. Market Analysis, Insights and Forecast - by Types
- 10.2.1. Surface Area Analysis
- 10.2.2. Porosity Determination
- 10.1. Market Analysis, Insights and Forecast - by Application
- 11. Competitive Analysis
- 11.1. Global Market Share Analysis 2024
- 11.2. Company Profiles
- 11.2.1 Micromeritics Instrument
- 11.2.1.1. Overview
- 11.2.1.2. Products
- 11.2.1.3. SWOT Analysis
- 11.2.1.4. Recent Developments
- 11.2.1.5. Financials (Based on Availability)
- 11.2.2 Quantachrome Instruments
- 11.2.2.1. Overview
- 11.2.2.2. Products
- 11.2.2.3. SWOT Analysis
- 11.2.2.4. Recent Developments
- 11.2.2.5. Financials (Based on Availability)
- 11.2.3 HORIBA
- 11.2.3.1. Overview
- 11.2.3.2. Products
- 11.2.3.3. SWOT Analysis
- 11.2.3.4. Recent Developments
- 11.2.3.5. Financials (Based on Availability)
- 11.2.4 Kunash Instruments
- 11.2.4.1. Overview
- 11.2.4.2. Products
- 11.2.4.3. SWOT Analysis
- 11.2.4.4. Recent Developments
- 11.2.4.5. Financials (Based on Availability)
- 11.2.1 Micromeritics Instrument
List of Figures
- Figure 1: Global Physisorption Analysis Revenue Breakdown (million, %) by Region 2024 & 2032
- Figure 2: North America Physisorption Analysis Revenue (million), by Application 2024 & 2032
- Figure 3: North America Physisorption Analysis Revenue Share (%), by Application 2024 & 2032
- Figure 4: North America Physisorption Analysis Revenue (million), by Types 2024 & 2032
- Figure 5: North America Physisorption Analysis Revenue Share (%), by Types 2024 & 2032
- Figure 6: North America Physisorption Analysis Revenue (million), by Country 2024 & 2032
- Figure 7: North America Physisorption Analysis Revenue Share (%), by Country 2024 & 2032
- Figure 8: South America Physisorption Analysis Revenue (million), by Application 2024 & 2032
- Figure 9: South America Physisorption Analysis Revenue Share (%), by Application 2024 & 2032
- Figure 10: South America Physisorption Analysis Revenue (million), by Types 2024 & 2032
- Figure 11: South America Physisorption Analysis Revenue Share (%), by Types 2024 & 2032
- Figure 12: South America Physisorption Analysis Revenue (million), by Country 2024 & 2032
- Figure 13: South America Physisorption Analysis Revenue Share (%), by Country 2024 & 2032
- Figure 14: Europe Physisorption Analysis Revenue (million), by Application 2024 & 2032
- Figure 15: Europe Physisorption Analysis Revenue Share (%), by Application 2024 & 2032
- Figure 16: Europe Physisorption Analysis Revenue (million), by Types 2024 & 2032
- Figure 17: Europe Physisorption Analysis Revenue Share (%), by Types 2024 & 2032
- Figure 18: Europe Physisorption Analysis Revenue (million), by Country 2024 & 2032
- Figure 19: Europe Physisorption Analysis Revenue Share (%), by Country 2024 & 2032
- Figure 20: Middle East & Africa Physisorption Analysis Revenue (million), by Application 2024 & 2032
- Figure 21: Middle East & Africa Physisorption Analysis Revenue Share (%), by Application 2024 & 2032
- Figure 22: Middle East & Africa Physisorption Analysis Revenue (million), by Types 2024 & 2032
- Figure 23: Middle East & Africa Physisorption Analysis Revenue Share (%), by Types 2024 & 2032
- Figure 24: Middle East & Africa Physisorption Analysis Revenue (million), by Country 2024 & 2032
- Figure 25: Middle East & Africa Physisorption Analysis Revenue Share (%), by Country 2024 & 2032
- Figure 26: Asia Pacific Physisorption Analysis Revenue (million), by Application 2024 & 2032
- Figure 27: Asia Pacific Physisorption Analysis Revenue Share (%), by Application 2024 & 2032
- Figure 28: Asia Pacific Physisorption Analysis Revenue (million), by Types 2024 & 2032
- Figure 29: Asia Pacific Physisorption Analysis Revenue Share (%), by Types 2024 & 2032
- Figure 30: Asia Pacific Physisorption Analysis Revenue (million), by Country 2024 & 2032
- Figure 31: Asia Pacific Physisorption Analysis Revenue Share (%), by Country 2024 & 2032
List of Tables
- Table 1: Global Physisorption Analysis Revenue million Forecast, by Region 2019 & 2032
- Table 2: Global Physisorption Analysis Revenue million Forecast, by Application 2019 & 2032
- Table 3: Global Physisorption Analysis Revenue million Forecast, by Types 2019 & 2032
- Table 4: Global Physisorption Analysis Revenue million Forecast, by Region 2019 & 2032
- Table 5: Global Physisorption Analysis Revenue million Forecast, by Application 2019 & 2032
- Table 6: Global Physisorption Analysis Revenue million Forecast, by Types 2019 & 2032
- Table 7: Global Physisorption Analysis Revenue million Forecast, by Country 2019 & 2032
- Table 8: United States Physisorption Analysis Revenue (million) Forecast, by Application 2019 & 2032
- Table 9: Canada Physisorption Analysis Revenue (million) Forecast, by Application 2019 & 2032
- Table 10: Mexico Physisorption Analysis Revenue (million) Forecast, by Application 2019 & 2032
- Table 11: Global Physisorption Analysis Revenue million Forecast, by Application 2019 & 2032
- Table 12: Global Physisorption Analysis Revenue million Forecast, by Types 2019 & 2032
- Table 13: Global Physisorption Analysis Revenue million Forecast, by Country 2019 & 2032
- Table 14: Brazil Physisorption Analysis Revenue (million) Forecast, by Application 2019 & 2032
- Table 15: Argentina Physisorption Analysis Revenue (million) Forecast, by Application 2019 & 2032
- Table 16: Rest of South America Physisorption Analysis Revenue (million) Forecast, by Application 2019 & 2032
- Table 17: Global Physisorption Analysis Revenue million Forecast, by Application 2019 & 2032
- Table 18: Global Physisorption Analysis Revenue million Forecast, by Types 2019 & 2032
- Table 19: Global Physisorption Analysis Revenue million Forecast, by Country 2019 & 2032
- Table 20: United Kingdom Physisorption Analysis Revenue (million) Forecast, by Application 2019 & 2032
- Table 21: Germany Physisorption Analysis Revenue (million) Forecast, by Application 2019 & 2032
- Table 22: France Physisorption Analysis Revenue (million) Forecast, by Application 2019 & 2032
- Table 23: Italy Physisorption Analysis Revenue (million) Forecast, by Application 2019 & 2032
- Table 24: Spain Physisorption Analysis Revenue (million) Forecast, by Application 2019 & 2032
- Table 25: Russia Physisorption Analysis Revenue (million) Forecast, by Application 2019 & 2032
- Table 26: Benelux Physisorption Analysis Revenue (million) Forecast, by Application 2019 & 2032
- Table 27: Nordics Physisorption Analysis Revenue (million) Forecast, by Application 2019 & 2032
- Table 28: Rest of Europe Physisorption Analysis Revenue (million) Forecast, by Application 2019 & 2032
- Table 29: Global Physisorption Analysis Revenue million Forecast, by Application 2019 & 2032
- Table 30: Global Physisorption Analysis Revenue million Forecast, by Types 2019 & 2032
- Table 31: Global Physisorption Analysis Revenue million Forecast, by Country 2019 & 2032
- Table 32: Turkey Physisorption Analysis Revenue (million) Forecast, by Application 2019 & 2032
- Table 33: Israel Physisorption Analysis Revenue (million) Forecast, by Application 2019 & 2032
- Table 34: GCC Physisorption Analysis Revenue (million) Forecast, by Application 2019 & 2032
- Table 35: North Africa Physisorption Analysis Revenue (million) Forecast, by Application 2019 & 2032
- Table 36: South Africa Physisorption Analysis Revenue (million) Forecast, by Application 2019 & 2032
- Table 37: Rest of Middle East & Africa Physisorption Analysis Revenue (million) Forecast, by Application 2019 & 2032
- Table 38: Global Physisorption Analysis Revenue million Forecast, by Application 2019 & 2032
- Table 39: Global Physisorption Analysis Revenue million Forecast, by Types 2019 & 2032
- Table 40: Global Physisorption Analysis Revenue million Forecast, by Country 2019 & 2032
- Table 41: China Physisorption Analysis Revenue (million) Forecast, by Application 2019 & 2032
- Table 42: India Physisorption Analysis Revenue (million) Forecast, by Application 2019 & 2032
- Table 43: Japan Physisorption Analysis Revenue (million) Forecast, by Application 2019 & 2032
- Table 44: South Korea Physisorption Analysis Revenue (million) Forecast, by Application 2019 & 2032
- Table 45: ASEAN Physisorption Analysis Revenue (million) Forecast, by Application 2019 & 2032
- Table 46: Oceania Physisorption Analysis Revenue (million) Forecast, by Application 2019 & 2032
- Table 47: Rest of Asia Pacific Physisorption Analysis Revenue (million) Forecast, by Application 2019 & 2032
Frequently Asked Questions
1. What is the projected Compound Annual Growth Rate (CAGR) of the Physisorption Analysis?
The projected CAGR is approximately XX%.
2. Which companies are prominent players in the Physisorption Analysis?
Key companies in the market include Micromeritics Instrument, Quantachrome Instruments, HORIBA, Kunash Instruments.
3. What are the main segments of the Physisorption Analysis?
The market segments include Application, Types.
4. Can you provide details about the market size?
The market size is estimated to be USD XXX million as of 2022.
5. What are some drivers contributing to market growth?
N/A
6. What are the notable trends driving market growth?
N/A
7. Are there any restraints impacting market growth?
N/A
8. Can you provide examples of recent developments in the market?
N/A
9. What pricing options are available for accessing the report?
Pricing options include single-user, multi-user, and enterprise licenses priced at USD 4900.00, USD 7350.00, and USD 9800.00 respectively.
10. Is the market size provided in terms of value or volume?
The market size is provided in terms of value, measured in million.
11. Are there any specific market keywords associated with the report?
Yes, the market keyword associated with the report is "Physisorption Analysis," which aids in identifying and referencing the specific market segment covered.
12. How do I determine which pricing option suits my needs best?
The pricing options vary based on user requirements and access needs. Individual users may opt for single-user licenses, while businesses requiring broader access may choose multi-user or enterprise licenses for cost-effective access to the report.
13. Are there any additional resources or data provided in the Physisorption Analysis report?
While the report offers comprehensive insights, it's advisable to review the specific contents or supplementary materials provided to ascertain if additional resources or data are available.
14. How can I stay updated on further developments or reports in the Physisorption Analysis?
To stay informed about further developments, trends, and reports in the Physisorption Analysis, consider subscribing to industry newsletters, following relevant companies and organizations, or regularly checking reputable industry news sources and publications.
Methodology
Step 1 - Identification of Relevant Samples Size from Population Database


Step 2 - Approaches for Defining Global Market Size (Value, Volume* & Price*)

Note*: In applicable scenarios
Step 3 - Data Sources
Primary Research
- Web Analytics
- Survey Reports
- Research Institute
- Latest Research Reports
- Opinion Leaders
Secondary Research
- Annual Reports
- White Paper
- Latest Press Release
- Industry Association
- Paid Database
- Investor Presentations

Step 4 - Data Triangulation
Involves using different sources of information in order to increase the validity of a study
These sources are likely to be stakeholders in a program - participants, other researchers, program staff, other community members, and so on.
Then we put all data in single framework & apply various statistical tools to find out the dynamic on the market.
During the analysis stage, feedback from the stakeholder groups would be compared to determine areas of agreement as well as areas of divergence
