

Key Insights
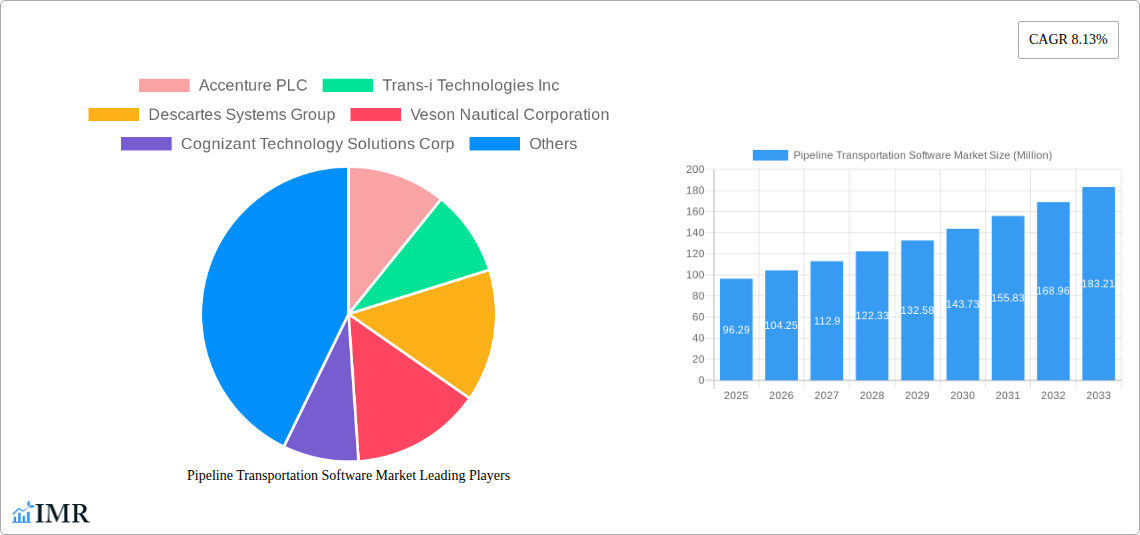
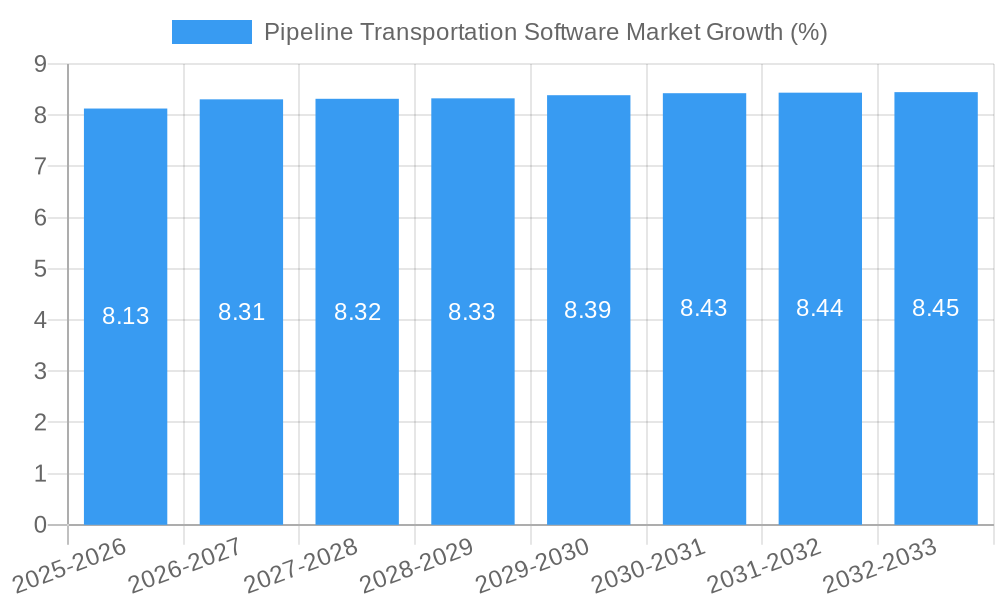
The Pipeline Transportation Software market, valued at $96.29 million in 2025, is projected to experience robust growth, driven by increasing demand for efficient and safe pipeline operations across various sectors. The compound annual growth rate (CAGR) of 8.13% from 2025 to 2033 indicates a significant expansion in market size over the forecast period. Key drivers include the need for enhanced real-time monitoring and control of pipeline assets, stringent regulatory compliance requirements emphasizing safety and environmental protection, and the growing adoption of digitalization and automation technologies within the energy, chemical, and manufacturing industries. The market segmentation reveals a strong preference for cloud-based solutions, offering scalability and accessibility, although on-premise and hybrid deployments continue to maintain significant market share, catering to specific security and data management needs. Major end-user verticals, including oil and gas, chemicals, and manufacturing, represent substantial market segments, fueling growth due to their extensive pipeline networks and reliance on efficient transportation management. The competitive landscape is dynamic, featuring established players like Accenture, Descartes Systems Group, and SAP, alongside specialized software providers catering to niche market segments. Continued technological advancements, such as the integration of artificial intelligence (AI) and machine learning (ML) for predictive maintenance and risk assessment, are expected to further accelerate market growth in the coming years.
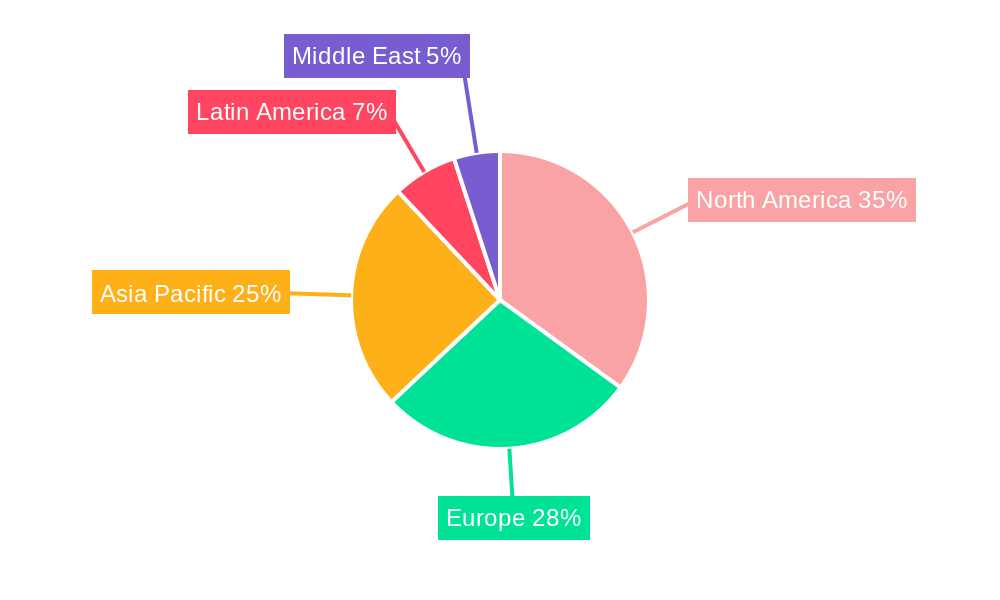
The market's growth trajectory is significantly influenced by several trends. The increasing focus on improving operational efficiency through data analytics and optimization software is a key factor. Furthermore, the integration of IoT (Internet of Things) devices within pipeline infrastructure enables real-time data collection, contributing to improved monitoring and control capabilities. However, the market also faces certain restraints, such as the high initial investment costs associated with implementing new software solutions and the potential challenges associated with integrating legacy systems. Despite these challenges, the long-term growth prospects remain positive, driven by the ongoing need for safer, more efficient, and environmentally sustainable pipeline transportation management. Geographic distribution likely shows strong performance in North America and Europe, mirroring the established pipeline infrastructure and technological adoption rates in these regions. However, Asia Pacific is anticipated to showcase strong growth potential due to rapid industrialization and infrastructure development.
Pipeline Transportation Software Market: A Comprehensive Report (2019-2033)
This in-depth report provides a comprehensive analysis of the Pipeline Transportation Software Market, encompassing market dynamics, growth trends, regional dominance, product landscape, key players, and future outlook. The study period covers 2019-2033, with a base year of 2025 and a forecast period of 2025-2033. The report segments the market by deployment (On-premise, Cloud, Hybrid) and end-user vertical (Retail, Oil and Gas, Manufacturing and Industrial, Aerospace and Defense, Chemical, Construction, Healthcare, Food and Beverage, Other End-user Verticals), offering granular insights for informed decision-making. The total market value is projected to reach xx Million by 2033.
Pipeline Transportation Software Market Dynamics & Structure
The Pipeline Transportation Software market is characterized by moderate concentration, with key players vying for market share. Technological innovation, particularly in areas like AI-driven predictive maintenance and IoT integration, is a significant growth driver. Stringent regulatory frameworks concerning data security and operational safety influence market practices. The market witnesses competition from alternative solutions, including manual tracking systems, but the advantages of enhanced efficiency and data-driven insights offered by software solutions are driving adoption. M&A activities are relatively frequent, with companies consolidating to expand their product portfolios and geographical reach. The historical period (2019-2024) saw xx M&A deals, with a projected increase to xx deals during the forecast period (2025-2033).
- Market Concentration: Moderately concentrated, with top 5 players holding approximately xx% market share in 2024.
- Technological Innovation: AI, IoT, and cloud computing are key drivers, leading to improved efficiency and reduced operational costs.
- Regulatory Landscape: Compliance with data privacy regulations (e.g., GDPR) and operational safety standards significantly impacts market dynamics.
- Competitive Substitutes: Manual systems and legacy solutions pose some competitive pressure, but software solutions’ advantages are increasingly apparent.
- End-User Demographics: Oil and Gas, and Manufacturing and Industrial segments are the primary adopters, with growth expected in other sectors.
- M&A Trends: Consolidation is expected to continue, driven by companies seeking to expand their capabilities and market reach.
Pipeline Transportation Software Market Growth Trends & Insights
The Pipeline Transportation Software market exhibits robust growth, driven by increasing demand for enhanced operational efficiency, improved safety measures, and real-time data visibility. The market size experienced a CAGR of xx% during the historical period (2019-2024) and is projected to maintain a CAGR of xx% from 2025 to 2033, reaching a value of xx Million by 2033. This growth is fueled by technological advancements, rising adoption rates across various industries, and the increasing need for data-driven decision-making in pipeline management. The adoption rate has increased from xx% in 2019 to xx% in 2024, and it is projected to reach xx% by 2033. Shifts in consumer behavior toward digitalization and the preference for cloud-based solutions are also significant factors contributing to market expansion. Specific advancements in areas like predictive analytics and blockchain technology are expected to further accelerate adoption.
Dominant Regions, Countries, or Segments in Pipeline Transportation Software Market
The North American region currently holds the largest market share, driven by robust infrastructure investments, early adoption of advanced technologies, and the presence of major industry players. However, the Asia-Pacific region is projected to witness the fastest growth during the forecast period due to rapid industrialization and rising demand for efficient pipeline management solutions in countries like India and China. Within the market segments, the Oil and Gas sector is the largest contributor, but the Manufacturing and Industrial sector shows promising growth potential. The Cloud deployment segment is projected to dominate due to its scalability and cost-effectiveness, surpassing the On-premise segment in market share by 2030.
- North America: Strong presence of major players, high technological adoption, and significant infrastructure investments.
- Asia-Pacific: Rapid industrialization, rising demand for efficiency, and substantial investments in infrastructure are key drivers.
- Europe: Steady growth, driven by regulatory compliance and investments in pipeline modernization.
- Oil and Gas: Highest market share due to the critical need for efficient pipeline monitoring and management.
- Manufacturing and Industrial: Significant growth potential, driven by increasing automation and the need for data-driven insights.
- Cloud Deployment: Projected to become the dominant deployment model due to scalability and cost-effectiveness.
Pipeline Transportation Software Market Product Landscape
Pipeline transportation software solutions are evolving rapidly, incorporating advanced functionalities like real-time monitoring, predictive maintenance capabilities, and data analytics dashboards. These solutions offer unique selling propositions such as enhanced operational efficiency, reduced downtime, and improved safety measures. Technological advancements, including the integration of AI and IoT, are leading to more sophisticated and insightful software solutions. These advancements allow for better predictive modeling of potential issues, enabling proactive intervention and minimizing costly disruptions.
Key Drivers, Barriers & Challenges in Pipeline Transportation Software Market
Key Drivers:
- Increased demand for operational efficiency and cost reduction.
- Stringent regulatory requirements for safety and data security.
- Growing adoption of advanced technologies, such as AI and IoT.
- Expanding global pipeline infrastructure.
Challenges & Restraints:
- High initial investment costs for implementation and maintenance.
- Complexity of integrating with existing systems and legacy infrastructure.
- Cybersecurity risks associated with data breaches and system vulnerabilities.
- Dependence on reliable internet connectivity for cloud-based solutions. A xx% increase in cyber-attacks in 2024 resulted in a xx million USD loss for the industry.
Emerging Opportunities in Pipeline Transportation Software Market
- Expansion into untapped markets in developing economies.
- Development of specialized solutions for specific pipeline types and applications.
- Integration with blockchain technology for enhanced security and transparency.
- Growing demand for predictive maintenance solutions based on AI and machine learning.
Growth Accelerators in the Pipeline Transportation Software Market Industry
The long-term growth of the Pipeline Transportation Software market is fueled by several factors, including the continuous development of innovative technologies, strategic partnerships between software providers and pipeline operators, and the ongoing expansion of global pipeline infrastructure. Government initiatives aimed at improving infrastructure and promoting digitalization are also contributing to market expansion. The increasing adoption of cloud-based solutions and the growing emphasis on sustainability are further accelerating market growth.
Key Players Shaping the Pipeline Transportation Software Market Market
- Accenture PLC
- Trans-i Technologies Inc
- Descartes Systems Group
- Veson Nautical Corporation
- Cognizant Technology Solutions Corp
- HighJump Software Inc
- Bass Software Ltd
- SAP SE
- DNV GL (GL Maritime Software GmbH)
- Aljex Software Inc
Notable Milestones in Pipeline Transportation Software Market Sector
- April 2023: Serbia's government announced a EUR 28 million (USD 30.6 million) investment in river transport infrastructure development under the "Sail Through Serbia" initiative. This is expected to stimulate growth in the river transport segment of the pipeline transportation software market.
- January 2023: The USD 131 million loan agreement between NSFTPL and ADB for upgrading the Jawaharlal Nehru Port Container Terminal will improve logistics infrastructure in India, creating opportunities for pipeline transportation software providers.
In-Depth Pipeline Transportation Software Market Market Outlook
The Pipeline Transportation Software market is poised for sustained growth, driven by the ongoing need for enhanced efficiency, improved safety, and data-driven decision-making in pipeline operations. Strategic partnerships, technological advancements, and expanding global infrastructure will continue to be key growth drivers. The market presents significant opportunities for innovative software providers to capitalize on the increasing demand for advanced solutions that leverage AI, IoT, and other emerging technologies. This market is expected to show strong resilience and continued expansion over the forecast period.
Pipeline Transportation Software Market Segmentation
-
1. Deployment
- 1.1. On-premise
- 1.2. Cloud
- 1.3. Hybrid
-
2. End-user Vertical
- 2.1. Retail
- 2.2. Oil and Gas
- 2.3. Manufacturing and Industrial
- 2.4. Aerospace and Defense
- 2.5. Chemical
- 2.6. Construction
- 2.7. Healthcare
- 2.8. Food and Beverage
- 2.9. Other End-user Verticals
Pipeline Transportation Software Market Segmentation By Geography
- 1. North America
- 2. Europe
- 3. Asia Pacific
- 4. Latin America
- 5. Middle East
Pipeline Transportation Software Market REPORT HIGHLIGHTS
| Aspects | Details |
|---|---|
| Study Period | 2019-2033 |
| Base Year | 2024 |
| Estimated Year | 2025 |
| Forecast Period | 2025-2033 |
| Historical Period | 2019-2024 |
| Growth Rate | CAGR of 8.13% from 2019-2033 |
| Segmentation |
|
Table of Contents
- 1. Introduction
- 1.1. Research Scope
- 1.2. Market Segmentation
- 1.3. Research Methodology
- 1.4. Definitions and Assumptions
- 2. Executive Summary
- 2.1. Introduction
- 3. Market Dynamics
- 3.1. Introduction
- 3.2. Market Drivers
- 3.2.1. Increasing Volume of Cargo; Establishment of New Ports in Developing Countries
- 3.3. Market Restrains
- 3.3.1. Stringent Emission Laws and Policies
- 3.4. Market Trends
- 3.4.1. Establishment of New Ports in Developing Countries is Expected to Drive the Market
- 4. Market Factor Analysis
- 4.1. Porters Five Forces
- 4.2. Supply/Value Chain
- 4.3. PESTEL analysis
- 4.4. Market Entropy
- 4.5. Patent/Trademark Analysis
- 5. Global Pipeline Transportation Software Market Analysis, Insights and Forecast, 2019-2031
- 5.1. Market Analysis, Insights and Forecast - by Deployment
- 5.1.1. On-premise
- 5.1.2. Cloud
- 5.1.3. Hybrid
- 5.2. Market Analysis, Insights and Forecast - by End-user Vertical
- 5.2.1. Retail
- 5.2.2. Oil and Gas
- 5.2.3. Manufacturing and Industrial
- 5.2.4. Aerospace and Defense
- 5.2.5. Chemical
- 5.2.6. Construction
- 5.2.7. Healthcare
- 5.2.8. Food and Beverage
- 5.2.9. Other End-user Verticals
- 5.3. Market Analysis, Insights and Forecast - by Region
- 5.3.1. North America
- 5.3.2. Europe
- 5.3.3. Asia Pacific
- 5.3.4. Latin America
- 5.3.5. Middle East
- 5.1. Market Analysis, Insights and Forecast - by Deployment
- 6. North America Pipeline Transportation Software Market Analysis, Insights and Forecast, 2019-2031
- 6.1. Market Analysis, Insights and Forecast - by Deployment
- 6.1.1. On-premise
- 6.1.2. Cloud
- 6.1.3. Hybrid
- 6.2. Market Analysis, Insights and Forecast - by End-user Vertical
- 6.2.1. Retail
- 6.2.2. Oil and Gas
- 6.2.3. Manufacturing and Industrial
- 6.2.4. Aerospace and Defense
- 6.2.5. Chemical
- 6.2.6. Construction
- 6.2.7. Healthcare
- 6.2.8. Food and Beverage
- 6.2.9. Other End-user Verticals
- 6.1. Market Analysis, Insights and Forecast - by Deployment
- 7. Europe Pipeline Transportation Software Market Analysis, Insights and Forecast, 2019-2031
- 7.1. Market Analysis, Insights and Forecast - by Deployment
- 7.1.1. On-premise
- 7.1.2. Cloud
- 7.1.3. Hybrid
- 7.2. Market Analysis, Insights and Forecast - by End-user Vertical
- 7.2.1. Retail
- 7.2.2. Oil and Gas
- 7.2.3. Manufacturing and Industrial
- 7.2.4. Aerospace and Defense
- 7.2.5. Chemical
- 7.2.6. Construction
- 7.2.7. Healthcare
- 7.2.8. Food and Beverage
- 7.2.9. Other End-user Verticals
- 7.1. Market Analysis, Insights and Forecast - by Deployment
- 8. Asia Pacific Pipeline Transportation Software Market Analysis, Insights and Forecast, 2019-2031
- 8.1. Market Analysis, Insights and Forecast - by Deployment
- 8.1.1. On-premise
- 8.1.2. Cloud
- 8.1.3. Hybrid
- 8.2. Market Analysis, Insights and Forecast - by End-user Vertical
- 8.2.1. Retail
- 8.2.2. Oil and Gas
- 8.2.3. Manufacturing and Industrial
- 8.2.4. Aerospace and Defense
- 8.2.5. Chemical
- 8.2.6. Construction
- 8.2.7. Healthcare
- 8.2.8. Food and Beverage
- 8.2.9. Other End-user Verticals
- 8.1. Market Analysis, Insights and Forecast - by Deployment
- 9. Latin America Pipeline Transportation Software Market Analysis, Insights and Forecast, 2019-2031
- 9.1. Market Analysis, Insights and Forecast - by Deployment
- 9.1.1. On-premise
- 9.1.2. Cloud
- 9.1.3. Hybrid
- 9.2. Market Analysis, Insights and Forecast - by End-user Vertical
- 9.2.1. Retail
- 9.2.2. Oil and Gas
- 9.2.3. Manufacturing and Industrial
- 9.2.4. Aerospace and Defense
- 9.2.5. Chemical
- 9.2.6. Construction
- 9.2.7. Healthcare
- 9.2.8. Food and Beverage
- 9.2.9. Other End-user Verticals
- 9.1. Market Analysis, Insights and Forecast - by Deployment
- 10. Middle East Pipeline Transportation Software Market Analysis, Insights and Forecast, 2019-2031
- 10.1. Market Analysis, Insights and Forecast - by Deployment
- 10.1.1. On-premise
- 10.1.2. Cloud
- 10.1.3. Hybrid
- 10.2. Market Analysis, Insights and Forecast - by End-user Vertical
- 10.2.1. Retail
- 10.2.2. Oil and Gas
- 10.2.3. Manufacturing and Industrial
- 10.2.4. Aerospace and Defense
- 10.2.5. Chemical
- 10.2.6. Construction
- 10.2.7. Healthcare
- 10.2.8. Food and Beverage
- 10.2.9. Other End-user Verticals
- 10.1. Market Analysis, Insights and Forecast - by Deployment
- 11. North America Pipeline Transportation Software Market Analysis, Insights and Forecast, 2019-2031
- 11.1. Market Analysis, Insights and Forecast - By Country/Sub-region
- 11.1.1.
- 12. Europe Pipeline Transportation Software Market Analysis, Insights and Forecast, 2019-2031
- 12.1. Market Analysis, Insights and Forecast - By Country/Sub-region
- 12.1.1.
- 13. Asia Pacific Pipeline Transportation Software Market Analysis, Insights and Forecast, 2019-2031
- 13.1. Market Analysis, Insights and Forecast - By Country/Sub-region
- 13.1.1.
- 14. Latin America Pipeline Transportation Software Market Analysis, Insights and Forecast, 2019-2031
- 14.1. Market Analysis, Insights and Forecast - By Country/Sub-region
- 14.1.1.
- 15. Middle East Pipeline Transportation Software Market Analysis, Insights and Forecast, 2019-2031
- 15.1. Market Analysis, Insights and Forecast - By Country/Sub-region
- 15.1.1.
- 16. Competitive Analysis
- 16.1. Global Market Share Analysis 2024
- 16.2. Company Profiles
- 16.2.1 Accenture PLC
- 16.2.1.1. Overview
- 16.2.1.2. Products
- 16.2.1.3. SWOT Analysis
- 16.2.1.4. Recent Developments
- 16.2.1.5. Financials (Based on Availability)
- 16.2.2 Trans-i Technologies Inc
- 16.2.2.1. Overview
- 16.2.2.2. Products
- 16.2.2.3. SWOT Analysis
- 16.2.2.4. Recent Developments
- 16.2.2.5. Financials (Based on Availability)
- 16.2.3 Descartes Systems Group
- 16.2.3.1. Overview
- 16.2.3.2. Products
- 16.2.3.3. SWOT Analysis
- 16.2.3.4. Recent Developments
- 16.2.3.5. Financials (Based on Availability)
- 16.2.4 Veson Nautical Corporation
- 16.2.4.1. Overview
- 16.2.4.2. Products
- 16.2.4.3. SWOT Analysis
- 16.2.4.4. Recent Developments
- 16.2.4.5. Financials (Based on Availability)
- 16.2.5 Cognizant Technology Solutions Corp
- 16.2.5.1. Overview
- 16.2.5.2. Products
- 16.2.5.3. SWOT Analysis
- 16.2.5.4. Recent Developments
- 16.2.5.5. Financials (Based on Availability)
- 16.2.6 HighJump Software Inc
- 16.2.6.1. Overview
- 16.2.6.2. Products
- 16.2.6.3. SWOT Analysis
- 16.2.6.4. Recent Developments
- 16.2.6.5. Financials (Based on Availability)
- 16.2.7 Bass Software Ltd *List Not Exhaustive
- 16.2.7.1. Overview
- 16.2.7.2. Products
- 16.2.7.3. SWOT Analysis
- 16.2.7.4. Recent Developments
- 16.2.7.5. Financials (Based on Availability)
- 16.2.8 SAP SE
- 16.2.8.1. Overview
- 16.2.8.2. Products
- 16.2.8.3. SWOT Analysis
- 16.2.8.4. Recent Developments
- 16.2.8.5. Financials (Based on Availability)
- 16.2.9 DNV GL (GL Maritime Software GmbH
- 16.2.9.1. Overview
- 16.2.9.2. Products
- 16.2.9.3. SWOT Analysis
- 16.2.9.4. Recent Developments
- 16.2.9.5. Financials (Based on Availability)
- 16.2.10 Aljex Software Inc
- 16.2.10.1. Overview
- 16.2.10.2. Products
- 16.2.10.3. SWOT Analysis
- 16.2.10.4. Recent Developments
- 16.2.10.5. Financials (Based on Availability)
- 16.2.1 Accenture PLC
List of Figures
- Figure 1: Global Pipeline Transportation Software Market Revenue Breakdown (Million, %) by Region 2024 & 2032
- Figure 2: North America Pipeline Transportation Software Market Revenue (Million), by Country 2024 & 2032
- Figure 3: North America Pipeline Transportation Software Market Revenue Share (%), by Country 2024 & 2032
- Figure 4: Europe Pipeline Transportation Software Market Revenue (Million), by Country 2024 & 2032
- Figure 5: Europe Pipeline Transportation Software Market Revenue Share (%), by Country 2024 & 2032
- Figure 6: Asia Pacific Pipeline Transportation Software Market Revenue (Million), by Country 2024 & 2032
- Figure 7: Asia Pacific Pipeline Transportation Software Market Revenue Share (%), by Country 2024 & 2032
- Figure 8: Latin America Pipeline Transportation Software Market Revenue (Million), by Country 2024 & 2032
- Figure 9: Latin America Pipeline Transportation Software Market Revenue Share (%), by Country 2024 & 2032
- Figure 10: Middle East Pipeline Transportation Software Market Revenue (Million), by Country 2024 & 2032
- Figure 11: Middle East Pipeline Transportation Software Market Revenue Share (%), by Country 2024 & 2032
- Figure 12: North America Pipeline Transportation Software Market Revenue (Million), by Deployment 2024 & 2032
- Figure 13: North America Pipeline Transportation Software Market Revenue Share (%), by Deployment 2024 & 2032
- Figure 14: North America Pipeline Transportation Software Market Revenue (Million), by End-user Vertical 2024 & 2032
- Figure 15: North America Pipeline Transportation Software Market Revenue Share (%), by End-user Vertical 2024 & 2032
- Figure 16: North America Pipeline Transportation Software Market Revenue (Million), by Country 2024 & 2032
- Figure 17: North America Pipeline Transportation Software Market Revenue Share (%), by Country 2024 & 2032
- Figure 18: Europe Pipeline Transportation Software Market Revenue (Million), by Deployment 2024 & 2032
- Figure 19: Europe Pipeline Transportation Software Market Revenue Share (%), by Deployment 2024 & 2032
- Figure 20: Europe Pipeline Transportation Software Market Revenue (Million), by End-user Vertical 2024 & 2032
- Figure 21: Europe Pipeline Transportation Software Market Revenue Share (%), by End-user Vertical 2024 & 2032
- Figure 22: Europe Pipeline Transportation Software Market Revenue (Million), by Country 2024 & 2032
- Figure 23: Europe Pipeline Transportation Software Market Revenue Share (%), by Country 2024 & 2032
- Figure 24: Asia Pacific Pipeline Transportation Software Market Revenue (Million), by Deployment 2024 & 2032
- Figure 25: Asia Pacific Pipeline Transportation Software Market Revenue Share (%), by Deployment 2024 & 2032
- Figure 26: Asia Pacific Pipeline Transportation Software Market Revenue (Million), by End-user Vertical 2024 & 2032
- Figure 27: Asia Pacific Pipeline Transportation Software Market Revenue Share (%), by End-user Vertical 2024 & 2032
- Figure 28: Asia Pacific Pipeline Transportation Software Market Revenue (Million), by Country 2024 & 2032
- Figure 29: Asia Pacific Pipeline Transportation Software Market Revenue Share (%), by Country 2024 & 2032
- Figure 30: Latin America Pipeline Transportation Software Market Revenue (Million), by Deployment 2024 & 2032
- Figure 31: Latin America Pipeline Transportation Software Market Revenue Share (%), by Deployment 2024 & 2032
- Figure 32: Latin America Pipeline Transportation Software Market Revenue (Million), by End-user Vertical 2024 & 2032
- Figure 33: Latin America Pipeline Transportation Software Market Revenue Share (%), by End-user Vertical 2024 & 2032
- Figure 34: Latin America Pipeline Transportation Software Market Revenue (Million), by Country 2024 & 2032
- Figure 35: Latin America Pipeline Transportation Software Market Revenue Share (%), by Country 2024 & 2032
- Figure 36: Middle East Pipeline Transportation Software Market Revenue (Million), by Deployment 2024 & 2032
- Figure 37: Middle East Pipeline Transportation Software Market Revenue Share (%), by Deployment 2024 & 2032
- Figure 38: Middle East Pipeline Transportation Software Market Revenue (Million), by End-user Vertical 2024 & 2032
- Figure 39: Middle East Pipeline Transportation Software Market Revenue Share (%), by End-user Vertical 2024 & 2032
- Figure 40: Middle East Pipeline Transportation Software Market Revenue (Million), by Country 2024 & 2032
- Figure 41: Middle East Pipeline Transportation Software Market Revenue Share (%), by Country 2024 & 2032
List of Tables
- Table 1: Global Pipeline Transportation Software Market Revenue Million Forecast, by Region 2019 & 2032
- Table 2: Global Pipeline Transportation Software Market Revenue Million Forecast, by Deployment 2019 & 2032
- Table 3: Global Pipeline Transportation Software Market Revenue Million Forecast, by End-user Vertical 2019 & 2032
- Table 4: Global Pipeline Transportation Software Market Revenue Million Forecast, by Region 2019 & 2032
- Table 5: Global Pipeline Transportation Software Market Revenue Million Forecast, by Country 2019 & 2032
- Table 6: Pipeline Transportation Software Market Revenue (Million) Forecast, by Application 2019 & 2032
- Table 7: Global Pipeline Transportation Software Market Revenue Million Forecast, by Country 2019 & 2032
- Table 8: Pipeline Transportation Software Market Revenue (Million) Forecast, by Application 2019 & 2032
- Table 9: Global Pipeline Transportation Software Market Revenue Million Forecast, by Country 2019 & 2032
- Table 10: Pipeline Transportation Software Market Revenue (Million) Forecast, by Application 2019 & 2032
- Table 11: Global Pipeline Transportation Software Market Revenue Million Forecast, by Country 2019 & 2032
- Table 12: Pipeline Transportation Software Market Revenue (Million) Forecast, by Application 2019 & 2032
- Table 13: Global Pipeline Transportation Software Market Revenue Million Forecast, by Country 2019 & 2032
- Table 14: Pipeline Transportation Software Market Revenue (Million) Forecast, by Application 2019 & 2032
- Table 15: Global Pipeline Transportation Software Market Revenue Million Forecast, by Deployment 2019 & 2032
- Table 16: Global Pipeline Transportation Software Market Revenue Million Forecast, by End-user Vertical 2019 & 2032
- Table 17: Global Pipeline Transportation Software Market Revenue Million Forecast, by Country 2019 & 2032
- Table 18: Global Pipeline Transportation Software Market Revenue Million Forecast, by Deployment 2019 & 2032
- Table 19: Global Pipeline Transportation Software Market Revenue Million Forecast, by End-user Vertical 2019 & 2032
- Table 20: Global Pipeline Transportation Software Market Revenue Million Forecast, by Country 2019 & 2032
- Table 21: Global Pipeline Transportation Software Market Revenue Million Forecast, by Deployment 2019 & 2032
- Table 22: Global Pipeline Transportation Software Market Revenue Million Forecast, by End-user Vertical 2019 & 2032
- Table 23: Global Pipeline Transportation Software Market Revenue Million Forecast, by Country 2019 & 2032
- Table 24: Global Pipeline Transportation Software Market Revenue Million Forecast, by Deployment 2019 & 2032
- Table 25: Global Pipeline Transportation Software Market Revenue Million Forecast, by End-user Vertical 2019 & 2032
- Table 26: Global Pipeline Transportation Software Market Revenue Million Forecast, by Country 2019 & 2032
- Table 27: Global Pipeline Transportation Software Market Revenue Million Forecast, by Deployment 2019 & 2032
- Table 28: Global Pipeline Transportation Software Market Revenue Million Forecast, by End-user Vertical 2019 & 2032
- Table 29: Global Pipeline Transportation Software Market Revenue Million Forecast, by Country 2019 & 2032
Frequently Asked Questions
1. What is the projected Compound Annual Growth Rate (CAGR) of the Pipeline Transportation Software Market?
The projected CAGR is approximately 8.13%.
2. Which companies are prominent players in the Pipeline Transportation Software Market?
Key companies in the market include Accenture PLC, Trans-i Technologies Inc, Descartes Systems Group, Veson Nautical Corporation, Cognizant Technology Solutions Corp, HighJump Software Inc, Bass Software Ltd *List Not Exhaustive, SAP SE, DNV GL (GL Maritime Software GmbH, Aljex Software Inc.
3. What are the main segments of the Pipeline Transportation Software Market?
The market segments include Deployment, End-user Vertical.
4. Can you provide details about the market size?
The market size is estimated to be USD 96.29 Million as of 2022.
5. What are some drivers contributing to market growth?
Increasing Volume of Cargo; Establishment of New Ports in Developing Countries.
6. What are the notable trends driving market growth?
Establishment of New Ports in Developing Countries is Expected to Drive the Market.
7. Are there any restraints impacting market growth?
Stringent Emission Laws and Policies.
8. Can you provide examples of recent developments in the market?
April 2023: Serbia's government announced to invest EUR 28 million (USD 30.6 million) in the overall development of river transport infrastructure all over the country as a crucial part of the Sail Through Serbia government initiative. The Sail Through Serbia initiative envisages the construction of new piers, marinas, and the increasing volume of river traffic throughout the country, thereby facilitating the market's growth opportunities.
9. What pricing options are available for accessing the report?
Pricing options include single-user, multi-user, and enterprise licenses priced at USD 4750, USD 5250, and USD 8750 respectively.
10. Is the market size provided in terms of value or volume?
The market size is provided in terms of value, measured in Million.
11. Are there any specific market keywords associated with the report?
Yes, the market keyword associated with the report is "Pipeline Transportation Software Market," which aids in identifying and referencing the specific market segment covered.
12. How do I determine which pricing option suits my needs best?
The pricing options vary based on user requirements and access needs. Individual users may opt for single-user licenses, while businesses requiring broader access may choose multi-user or enterprise licenses for cost-effective access to the report.
13. Are there any additional resources or data provided in the Pipeline Transportation Software Market report?
While the report offers comprehensive insights, it's advisable to review the specific contents or supplementary materials provided to ascertain if additional resources or data are available.
14. How can I stay updated on further developments or reports in the Pipeline Transportation Software Market?
To stay informed about further developments, trends, and reports in the Pipeline Transportation Software Market, consider subscribing to industry newsletters, following relevant companies and organizations, or regularly checking reputable industry news sources and publications.
Methodology
Step 1 - Identification of Relevant Samples Size from Population Database


Step 2 - Approaches for Defining Global Market Size (Value, Volume* & Price*)

Note*: In applicable scenarios
Step 3 - Data Sources
Primary Research
- Web Analytics
- Survey Reports
- Research Institute
- Latest Research Reports
- Opinion Leaders
Secondary Research
- Annual Reports
- White Paper
- Latest Press Release
- Industry Association
- Paid Database
- Investor Presentations

Step 4 - Data Triangulation
Involves using different sources of information in order to increase the validity of a study
These sources are likely to be stakeholders in a program - participants, other researchers, program staff, other community members, and so on.
Then we put all data in single framework & apply various statistical tools to find out the dynamic on the market.
During the analysis stage, feedback from the stakeholder groups would be compared to determine areas of agreement as well as areas of divergence
