

Key Insights
The global pool cartridge filter market is experiencing robust growth, driven by the increasing popularity of swimming pools for both residential and commercial use. The market's expansion is fueled by several key factors, including rising disposable incomes in developing economies leading to increased spending on leisure and recreational activities, a growing preference for easy-to-maintain pool filtration systems, and a surge in the construction of new residential and commercial swimming pools globally. Technological advancements in filter design, resulting in improved filtration efficiency and longer lifespan, further contribute to market expansion. Furthermore, the rising awareness of water quality and hygiene is driving demand for efficient and reliable pool filtration solutions. While challenges such as fluctuating raw material prices and intense competition among established players exist, the overall market outlook remains positive.
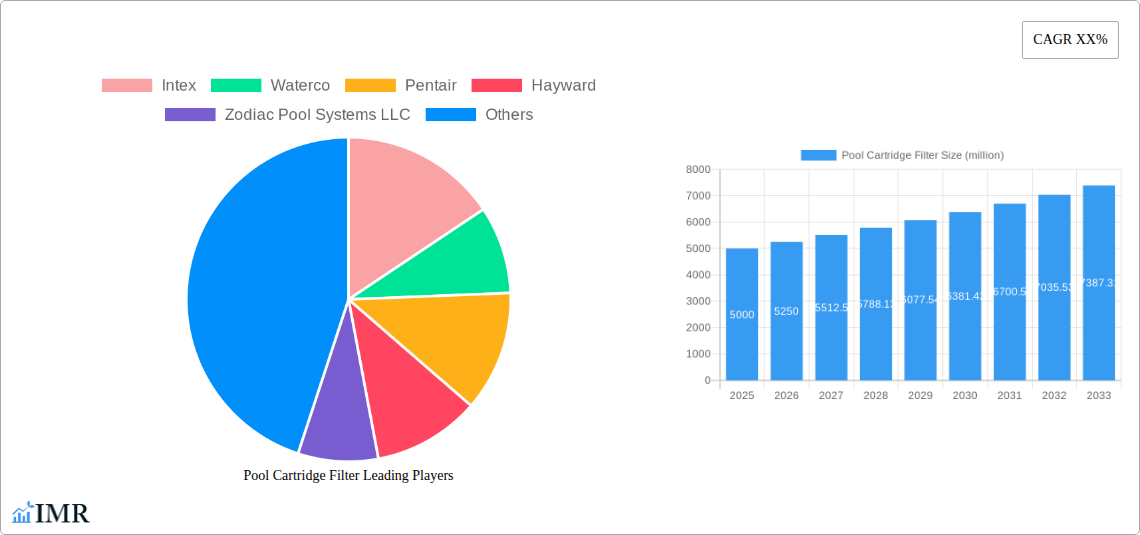
The competitive landscape is characterized by a mix of established multinational corporations and regional players. Companies like Pentair, Hayward, and Zodiac Pool Systems LLC dominate the market with their extensive product portfolios and strong global presence. However, regional players and innovative startups are also emerging, focusing on niche segments and offering competitive pricing. Future growth will likely be influenced by several factors, including sustainable and energy-efficient filter technologies, the integration of smart home technology into pool filtration systems, and the increasing demand for customized filtration solutions. Growth will also be geographically diverse, with emerging markets in Asia and Latin America exhibiting particularly strong potential. Strategic partnerships, product innovation, and effective marketing strategies will be crucial for success in this dynamic market.
Pool Cartridge Filter Market Report: 2019-2033
This comprehensive report provides an in-depth analysis of the global pool cartridge filter market, projecting robust growth from 2019 to 2033. The study covers market dynamics, growth trends, regional segmentation, competitive landscape, and future outlook, offering valuable insights for industry professionals, investors, and stakeholders. The report leverages extensive data analysis and expert insights to present a clear and actionable picture of this thriving market segment. Our analysis encompasses the parent market (Swimming Pool and Spa Equipment) and the child market (Pool Filtration Systems), enabling a granular understanding of market dynamics. The base year for this report is 2025, with data covering the historical period (2019-2024), the estimated year (2025), and the forecast period (2025-2033). Market values are presented in millions of units.
Pool Cartridge Filter Market Dynamics & Structure
The pool cartridge filter market is characterized by moderate concentration, with key players like Pentair, Hayward, and Zodiac Pool Systems LLC holding significant market share (xx%). Technological innovation, particularly in filter media and design, is a major driver, alongside increasing consumer demand for efficient and easy-to-maintain pool filtration systems. Regulatory frameworks concerning water conservation and chemical usage also influence market trends. Competitive substitutes include sand filters and diatomaceous earth filters, but cartridge filters maintain a strong position due to their ease of use and maintenance. The market also witnesses considerable M&A activity, with xx major deals recorded between 2019 and 2024, reflecting consolidation within the industry. End-user demographics are shifting towards younger, tech-savvy consumers seeking convenient and eco-friendly pool maintenance solutions.
- Market Concentration: Moderately concentrated, with top 5 players holding xx% market share in 2024.
- Technological Innovation: Focus on improved filter media, automated cleaning systems, and energy efficiency.
- Regulatory Landscape: Stringent water quality standards driving demand for efficient filtration.
- Competitive Substitutes: Sand filters, DE filters; cartridge filters compete on ease of use and maintenance.
- M&A Activity: xx major mergers and acquisitions between 2019 and 2024, driving industry consolidation.
- End-User Demographics: Growing adoption among younger, environmentally conscious consumers.
Pool Cartridge Filter Growth Trends & Insights
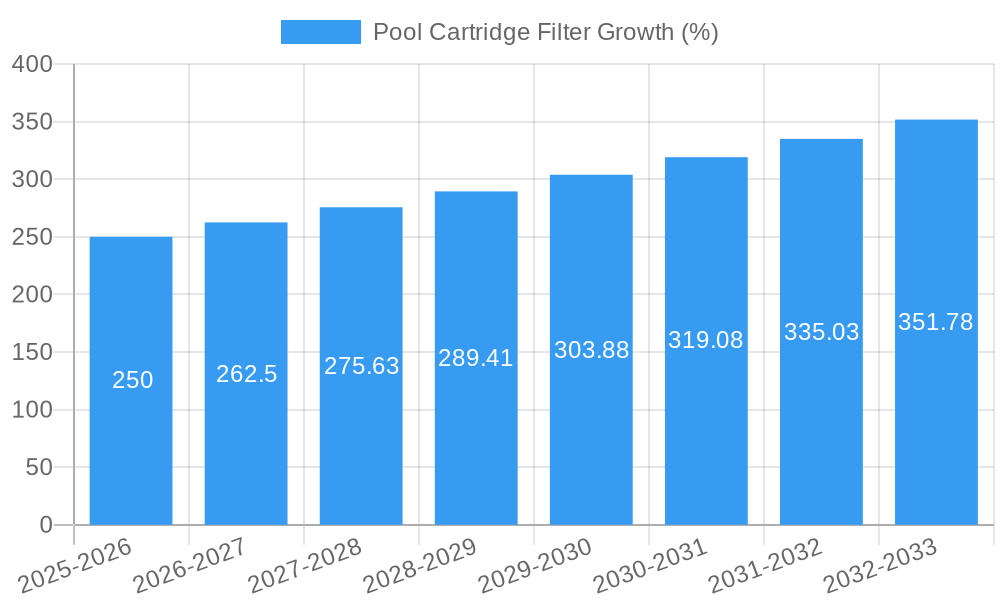
The global pool cartridge filter market exhibited a CAGR of xx% during the historical period (2019-2024), reaching an estimated market size of xx million units in 2025. This growth is attributed to rising disposable incomes, increasing residential pool construction, and a growing preference for convenient and low-maintenance pool cleaning solutions. Technological advancements, such as the introduction of high-performance filter media and smart pool control systems, have significantly boosted adoption rates. Consumer behavior is shifting towards premium, energy-efficient filters, creating opportunities for manufacturers offering advanced features and improved durability. The forecast period (2025-2033) anticipates continued market expansion, driven by factors like increasing urbanization, tourism, and the global popularity of swimming pools. We project a CAGR of xx% for this period, resulting in a market size of xx million units by 2033.
Dominant Regions, Countries, or Segments in Pool Cartridge Filter
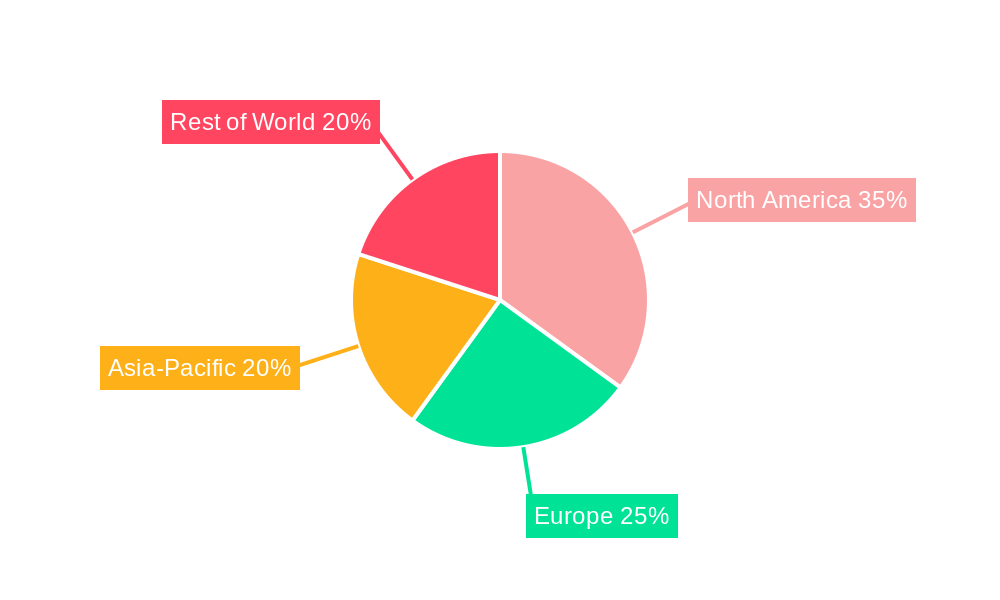
North America (particularly the US) and Western Europe currently dominate the pool cartridge filter market, driven by high levels of pool ownership, strong disposable incomes, and well-established infrastructure supporting the pool industry. Key drivers in these regions include robust housing markets, favorable climatic conditions, and increased demand for outdoor recreational activities. However, emerging markets in Asia-Pacific, particularly China and India, are exhibiting strong growth potential due to rising disposable incomes and increasing urbanization. The residential segment accounts for the largest share of the market, followed by the commercial sector (hotels, resorts, etc).
- North America: High pool ownership, strong disposable incomes, established infrastructure.
- Western Europe: Mature market with steady growth, driven by renovation and replacement demand.
- Asia-Pacific: Rapid growth potential fueled by rising disposable incomes and urbanization.
- Residential Segment: Largest market share, driven by individual homeowners.
- Commercial Segment: Steady growth driven by hotels, resorts, and recreational facilities.
Pool Cartridge Filter Product Landscape
The pool cartridge filter market showcases a wide array of products, ranging from basic models to advanced systems featuring automated cleaning cycles, enhanced filtration efficiency, and integration with smart home technology. Key product innovations include improved filter media materials (e.g., pleated cartridges offering greater surface area), self-cleaning mechanisms, and energy-efficient designs. Unique selling propositions focus on ease of maintenance, improved filtration performance, and longer lifespan. These advancements are primarily driven by consumer demand for convenience and cost-effectiveness.
Key Drivers, Barriers & Challenges in Pool Cartridge Filter
Key Drivers: Rising disposable incomes, increasing pool ownership, technological advancements (improved filter media and automation), favorable climatic conditions in key markets, and government initiatives promoting water conservation.
Challenges: Fluctuations in raw material prices, intense competition from substitute products, stringent environmental regulations, and supply chain disruptions. For example, a xx% increase in the price of polypropylene in 2022 resulted in a xx% increase in manufacturing costs for some manufacturers.
Emerging Opportunities in Pool Cartridge Filter
Emerging opportunities lie in expanding into untapped markets (e.g., developing countries with growing middle classes), developing innovative filter media with improved performance and sustainability, and creating smart pool solutions that integrate with other home automation systems. Targeting environmentally conscious consumers with eco-friendly filter materials and designs also presents a strong growth opportunity.
Growth Accelerators in the Pool Cartridge Filter Industry
Strategic partnerships between filter manufacturers and pool construction companies can create synergies and accelerate market penetration. Technological breakthroughs in filter media materials and automation technology will further enhance filter efficiency and reduce maintenance requirements. Expansion into new geographic markets, particularly in developing economies, represents a key catalyst for long-term growth.
Key Players Shaping the Pool Cartridge Filter Market
- Intex
- Waterco
- Pentair
- Hayward
- Zodiac Pool Systems LLC
- Onga
- Astral
- Waterway
Notable Milestones in Pool Cartridge Filter Sector
- 2020: Pentair launches a new line of smart pool filters with integrated Wi-Fi connectivity.
- 2021: Hayward introduces a new filter media material with significantly improved filtration efficiency.
- 2022: Zodiac Pool Systems LLC acquires a smaller competitor, expanding its market share.
- 2023: Waterco releases a new eco-friendly filter cartridge made from recycled materials.
In-Depth Pool Cartridge Filter Market Outlook
The future of the pool cartridge filter market is bright, driven by ongoing technological advancements, increasing consumer demand for efficient and convenient pool maintenance solutions, and expansion into new geographic markets. The market's long-term growth potential is substantial, driven by continuous innovation, strategic partnerships, and increasing awareness of the importance of water conservation. Opportunities exist for companies that focus on sustainability, smart technology integration, and expansion into emerging markets.
Pool Cartridge Filter Segmentation
-
1. Application
- 1.1. Online Sales
- 1.2. Offline Sales
-
2. Types
- 2.1. Effective Filtration Area <= 100 ft.2
- 2.2. Effective Filtration Area > 100 ft.2
Pool Cartridge Filter Segmentation By Geography
-
1. North America
- 1.1. United States
- 1.2. Canada
- 1.3. Mexico
-
2. South America
- 2.1. Brazil
- 2.2. Argentina
- 2.3. Rest of South America
-
3. Europe
- 3.1. United Kingdom
- 3.2. Germany
- 3.3. France
- 3.4. Italy
- 3.5. Spain
- 3.6. Russia
- 3.7. Benelux
- 3.8. Nordics
- 3.9. Rest of Europe
-
4. Middle East & Africa
- 4.1. Turkey
- 4.2. Israel
- 4.3. GCC
- 4.4. North Africa
- 4.5. South Africa
- 4.6. Rest of Middle East & Africa
-
5. Asia Pacific
- 5.1. China
- 5.2. India
- 5.3. Japan
- 5.4. South Korea
- 5.5. ASEAN
- 5.6. Oceania
- 5.7. Rest of Asia Pacific
Pool Cartridge Filter REPORT HIGHLIGHTS
| Aspects | Details |
|---|---|
| Study Period | 2019-2033 |
| Base Year | 2024 |
| Estimated Year | 2025 |
| Forecast Period | 2025-2033 |
| Historical Period | 2019-2024 |
| Growth Rate | CAGR of XX% from 2019-2033 |
| Segmentation |
|
Table of Contents
- 1. Introduction
- 1.1. Research Scope
- 1.2. Market Segmentation
- 1.3. Research Methodology
- 1.4. Definitions and Assumptions
- 2. Executive Summary
- 2.1. Introduction
- 3. Market Dynamics
- 3.1. Introduction
- 3.2. Market Drivers
- 3.3. Market Restrains
- 3.4. Market Trends
- 4. Market Factor Analysis
- 4.1. Porters Five Forces
- 4.2. Supply/Value Chain
- 4.3. PESTEL analysis
- 4.4. Market Entropy
- 4.5. Patent/Trademark Analysis
- 5. Global Pool Cartridge Filter Analysis, Insights and Forecast, 2019-2031
- 5.1. Market Analysis, Insights and Forecast - by Application
- 5.1.1. Online Sales
- 5.1.2. Offline Sales
- 5.2. Market Analysis, Insights and Forecast - by Types
- 5.2.1. Effective Filtration Area <= 100 ft.2
- 5.2.2. Effective Filtration Area > 100 ft.2
- 5.3. Market Analysis, Insights and Forecast - by Region
- 5.3.1. North America
- 5.3.2. South America
- 5.3.3. Europe
- 5.3.4. Middle East & Africa
- 5.3.5. Asia Pacific
- 5.1. Market Analysis, Insights and Forecast - by Application
- 6. North America Pool Cartridge Filter Analysis, Insights and Forecast, 2019-2031
- 6.1. Market Analysis, Insights and Forecast - by Application
- 6.1.1. Online Sales
- 6.1.2. Offline Sales
- 6.2. Market Analysis, Insights and Forecast - by Types
- 6.2.1. Effective Filtration Area <= 100 ft.2
- 6.2.2. Effective Filtration Area > 100 ft.2
- 6.1. Market Analysis, Insights and Forecast - by Application
- 7. South America Pool Cartridge Filter Analysis, Insights and Forecast, 2019-2031
- 7.1. Market Analysis, Insights and Forecast - by Application
- 7.1.1. Online Sales
- 7.1.2. Offline Sales
- 7.2. Market Analysis, Insights and Forecast - by Types
- 7.2.1. Effective Filtration Area <= 100 ft.2
- 7.2.2. Effective Filtration Area > 100 ft.2
- 7.1. Market Analysis, Insights and Forecast - by Application
- 8. Europe Pool Cartridge Filter Analysis, Insights and Forecast, 2019-2031
- 8.1. Market Analysis, Insights and Forecast - by Application
- 8.1.1. Online Sales
- 8.1.2. Offline Sales
- 8.2. Market Analysis, Insights and Forecast - by Types
- 8.2.1. Effective Filtration Area <= 100 ft.2
- 8.2.2. Effective Filtration Area > 100 ft.2
- 8.1. Market Analysis, Insights and Forecast - by Application
- 9. Middle East & Africa Pool Cartridge Filter Analysis, Insights and Forecast, 2019-2031
- 9.1. Market Analysis, Insights and Forecast - by Application
- 9.1.1. Online Sales
- 9.1.2. Offline Sales
- 9.2. Market Analysis, Insights and Forecast - by Types
- 9.2.1. Effective Filtration Area <= 100 ft.2
- 9.2.2. Effective Filtration Area > 100 ft.2
- 9.1. Market Analysis, Insights and Forecast - by Application
- 10. Asia Pacific Pool Cartridge Filter Analysis, Insights and Forecast, 2019-2031
- 10.1. Market Analysis, Insights and Forecast - by Application
- 10.1.1. Online Sales
- 10.1.2. Offline Sales
- 10.2. Market Analysis, Insights and Forecast - by Types
- 10.2.1. Effective Filtration Area <= 100 ft.2
- 10.2.2. Effective Filtration Area > 100 ft.2
- 10.1. Market Analysis, Insights and Forecast - by Application
- 11. Competitive Analysis
- 11.1. Global Market Share Analysis 2024
- 11.2. Company Profiles
- 11.2.1 Intex
- 11.2.1.1. Overview
- 11.2.1.2. Products
- 11.2.1.3. SWOT Analysis
- 11.2.1.4. Recent Developments
- 11.2.1.5. Financials (Based on Availability)
- 11.2.2 Waterco
- 11.2.2.1. Overview
- 11.2.2.2. Products
- 11.2.2.3. SWOT Analysis
- 11.2.2.4. Recent Developments
- 11.2.2.5. Financials (Based on Availability)
- 11.2.3 Pentair
- 11.2.3.1. Overview
- 11.2.3.2. Products
- 11.2.3.3. SWOT Analysis
- 11.2.3.4. Recent Developments
- 11.2.3.5. Financials (Based on Availability)
- 11.2.4 Hayward
- 11.2.4.1. Overview
- 11.2.4.2. Products
- 11.2.4.3. SWOT Analysis
- 11.2.4.4. Recent Developments
- 11.2.4.5. Financials (Based on Availability)
- 11.2.5 Zodiac Pool Systems LLC
- 11.2.5.1. Overview
- 11.2.5.2. Products
- 11.2.5.3. SWOT Analysis
- 11.2.5.4. Recent Developments
- 11.2.5.5. Financials (Based on Availability)
- 11.2.6 Onga
- 11.2.6.1. Overview
- 11.2.6.2. Products
- 11.2.6.3. SWOT Analysis
- 11.2.6.4. Recent Developments
- 11.2.6.5. Financials (Based on Availability)
- 11.2.7 Astral
- 11.2.7.1. Overview
- 11.2.7.2. Products
- 11.2.7.3. SWOT Analysis
- 11.2.7.4. Recent Developments
- 11.2.7.5. Financials (Based on Availability)
- 11.2.8 Waterway
- 11.2.8.1. Overview
- 11.2.8.2. Products
- 11.2.8.3. SWOT Analysis
- 11.2.8.4. Recent Developments
- 11.2.8.5. Financials (Based on Availability)
- 11.2.1 Intex
List of Figures
- Figure 1: Global Pool Cartridge Filter Revenue Breakdown (million, %) by Region 2024 & 2032
- Figure 2: Global Pool Cartridge Filter Volume Breakdown (K, %) by Region 2024 & 2032
- Figure 3: North America Pool Cartridge Filter Revenue (million), by Application 2024 & 2032
- Figure 4: North America Pool Cartridge Filter Volume (K), by Application 2024 & 2032
- Figure 5: North America Pool Cartridge Filter Revenue Share (%), by Application 2024 & 2032
- Figure 6: North America Pool Cartridge Filter Volume Share (%), by Application 2024 & 2032
- Figure 7: North America Pool Cartridge Filter Revenue (million), by Types 2024 & 2032
- Figure 8: North America Pool Cartridge Filter Volume (K), by Types 2024 & 2032
- Figure 9: North America Pool Cartridge Filter Revenue Share (%), by Types 2024 & 2032
- Figure 10: North America Pool Cartridge Filter Volume Share (%), by Types 2024 & 2032
- Figure 11: North America Pool Cartridge Filter Revenue (million), by Country 2024 & 2032
- Figure 12: North America Pool Cartridge Filter Volume (K), by Country 2024 & 2032
- Figure 13: North America Pool Cartridge Filter Revenue Share (%), by Country 2024 & 2032
- Figure 14: North America Pool Cartridge Filter Volume Share (%), by Country 2024 & 2032
- Figure 15: South America Pool Cartridge Filter Revenue (million), by Application 2024 & 2032
- Figure 16: South America Pool Cartridge Filter Volume (K), by Application 2024 & 2032
- Figure 17: South America Pool Cartridge Filter Revenue Share (%), by Application 2024 & 2032
- Figure 18: South America Pool Cartridge Filter Volume Share (%), by Application 2024 & 2032
- Figure 19: South America Pool Cartridge Filter Revenue (million), by Types 2024 & 2032
- Figure 20: South America Pool Cartridge Filter Volume (K), by Types 2024 & 2032
- Figure 21: South America Pool Cartridge Filter Revenue Share (%), by Types 2024 & 2032
- Figure 22: South America Pool Cartridge Filter Volume Share (%), by Types 2024 & 2032
- Figure 23: South America Pool Cartridge Filter Revenue (million), by Country 2024 & 2032
- Figure 24: South America Pool Cartridge Filter Volume (K), by Country 2024 & 2032
- Figure 25: South America Pool Cartridge Filter Revenue Share (%), by Country 2024 & 2032
- Figure 26: South America Pool Cartridge Filter Volume Share (%), by Country 2024 & 2032
- Figure 27: Europe Pool Cartridge Filter Revenue (million), by Application 2024 & 2032
- Figure 28: Europe Pool Cartridge Filter Volume (K), by Application 2024 & 2032
- Figure 29: Europe Pool Cartridge Filter Revenue Share (%), by Application 2024 & 2032
- Figure 30: Europe Pool Cartridge Filter Volume Share (%), by Application 2024 & 2032
- Figure 31: Europe Pool Cartridge Filter Revenue (million), by Types 2024 & 2032
- Figure 32: Europe Pool Cartridge Filter Volume (K), by Types 2024 & 2032
- Figure 33: Europe Pool Cartridge Filter Revenue Share (%), by Types 2024 & 2032
- Figure 34: Europe Pool Cartridge Filter Volume Share (%), by Types 2024 & 2032
- Figure 35: Europe Pool Cartridge Filter Revenue (million), by Country 2024 & 2032
- Figure 36: Europe Pool Cartridge Filter Volume (K), by Country 2024 & 2032
- Figure 37: Europe Pool Cartridge Filter Revenue Share (%), by Country 2024 & 2032
- Figure 38: Europe Pool Cartridge Filter Volume Share (%), by Country 2024 & 2032
- Figure 39: Middle East & Africa Pool Cartridge Filter Revenue (million), by Application 2024 & 2032
- Figure 40: Middle East & Africa Pool Cartridge Filter Volume (K), by Application 2024 & 2032
- Figure 41: Middle East & Africa Pool Cartridge Filter Revenue Share (%), by Application 2024 & 2032
- Figure 42: Middle East & Africa Pool Cartridge Filter Volume Share (%), by Application 2024 & 2032
- Figure 43: Middle East & Africa Pool Cartridge Filter Revenue (million), by Types 2024 & 2032
- Figure 44: Middle East & Africa Pool Cartridge Filter Volume (K), by Types 2024 & 2032
- Figure 45: Middle East & Africa Pool Cartridge Filter Revenue Share (%), by Types 2024 & 2032
- Figure 46: Middle East & Africa Pool Cartridge Filter Volume Share (%), by Types 2024 & 2032
- Figure 47: Middle East & Africa Pool Cartridge Filter Revenue (million), by Country 2024 & 2032
- Figure 48: Middle East & Africa Pool Cartridge Filter Volume (K), by Country 2024 & 2032
- Figure 49: Middle East & Africa Pool Cartridge Filter Revenue Share (%), by Country 2024 & 2032
- Figure 50: Middle East & Africa Pool Cartridge Filter Volume Share (%), by Country 2024 & 2032
- Figure 51: Asia Pacific Pool Cartridge Filter Revenue (million), by Application 2024 & 2032
- Figure 52: Asia Pacific Pool Cartridge Filter Volume (K), by Application 2024 & 2032
- Figure 53: Asia Pacific Pool Cartridge Filter Revenue Share (%), by Application 2024 & 2032
- Figure 54: Asia Pacific Pool Cartridge Filter Volume Share (%), by Application 2024 & 2032
- Figure 55: Asia Pacific Pool Cartridge Filter Revenue (million), by Types 2024 & 2032
- Figure 56: Asia Pacific Pool Cartridge Filter Volume (K), by Types 2024 & 2032
- Figure 57: Asia Pacific Pool Cartridge Filter Revenue Share (%), by Types 2024 & 2032
- Figure 58: Asia Pacific Pool Cartridge Filter Volume Share (%), by Types 2024 & 2032
- Figure 59: Asia Pacific Pool Cartridge Filter Revenue (million), by Country 2024 & 2032
- Figure 60: Asia Pacific Pool Cartridge Filter Volume (K), by Country 2024 & 2032
- Figure 61: Asia Pacific Pool Cartridge Filter Revenue Share (%), by Country 2024 & 2032
- Figure 62: Asia Pacific Pool Cartridge Filter Volume Share (%), by Country 2024 & 2032
List of Tables
- Table 1: Global Pool Cartridge Filter Revenue million Forecast, by Region 2019 & 2032
- Table 2: Global Pool Cartridge Filter Volume K Forecast, by Region 2019 & 2032
- Table 3: Global Pool Cartridge Filter Revenue million Forecast, by Application 2019 & 2032
- Table 4: Global Pool Cartridge Filter Volume K Forecast, by Application 2019 & 2032
- Table 5: Global Pool Cartridge Filter Revenue million Forecast, by Types 2019 & 2032
- Table 6: Global Pool Cartridge Filter Volume K Forecast, by Types 2019 & 2032
- Table 7: Global Pool Cartridge Filter Revenue million Forecast, by Region 2019 & 2032
- Table 8: Global Pool Cartridge Filter Volume K Forecast, by Region 2019 & 2032
- Table 9: Global Pool Cartridge Filter Revenue million Forecast, by Application 2019 & 2032
- Table 10: Global Pool Cartridge Filter Volume K Forecast, by Application 2019 & 2032
- Table 11: Global Pool Cartridge Filter Revenue million Forecast, by Types 2019 & 2032
- Table 12: Global Pool Cartridge Filter Volume K Forecast, by Types 2019 & 2032
- Table 13: Global Pool Cartridge Filter Revenue million Forecast, by Country 2019 & 2032
- Table 14: Global Pool Cartridge Filter Volume K Forecast, by Country 2019 & 2032
- Table 15: United States Pool Cartridge Filter Revenue (million) Forecast, by Application 2019 & 2032
- Table 16: United States Pool Cartridge Filter Volume (K) Forecast, by Application 2019 & 2032
- Table 17: Canada Pool Cartridge Filter Revenue (million) Forecast, by Application 2019 & 2032
- Table 18: Canada Pool Cartridge Filter Volume (K) Forecast, by Application 2019 & 2032
- Table 19: Mexico Pool Cartridge Filter Revenue (million) Forecast, by Application 2019 & 2032
- Table 20: Mexico Pool Cartridge Filter Volume (K) Forecast, by Application 2019 & 2032
- Table 21: Global Pool Cartridge Filter Revenue million Forecast, by Application 2019 & 2032
- Table 22: Global Pool Cartridge Filter Volume K Forecast, by Application 2019 & 2032
- Table 23: Global Pool Cartridge Filter Revenue million Forecast, by Types 2019 & 2032
- Table 24: Global Pool Cartridge Filter Volume K Forecast, by Types 2019 & 2032
- Table 25: Global Pool Cartridge Filter Revenue million Forecast, by Country 2019 & 2032
- Table 26: Global Pool Cartridge Filter Volume K Forecast, by Country 2019 & 2032
- Table 27: Brazil Pool Cartridge Filter Revenue (million) Forecast, by Application 2019 & 2032
- Table 28: Brazil Pool Cartridge Filter Volume (K) Forecast, by Application 2019 & 2032
- Table 29: Argentina Pool Cartridge Filter Revenue (million) Forecast, by Application 2019 & 2032
- Table 30: Argentina Pool Cartridge Filter Volume (K) Forecast, by Application 2019 & 2032
- Table 31: Rest of South America Pool Cartridge Filter Revenue (million) Forecast, by Application 2019 & 2032
- Table 32: Rest of South America Pool Cartridge Filter Volume (K) Forecast, by Application 2019 & 2032
- Table 33: Global Pool Cartridge Filter Revenue million Forecast, by Application 2019 & 2032
- Table 34: Global Pool Cartridge Filter Volume K Forecast, by Application 2019 & 2032
- Table 35: Global Pool Cartridge Filter Revenue million Forecast, by Types 2019 & 2032
- Table 36: Global Pool Cartridge Filter Volume K Forecast, by Types 2019 & 2032
- Table 37: Global Pool Cartridge Filter Revenue million Forecast, by Country 2019 & 2032
- Table 38: Global Pool Cartridge Filter Volume K Forecast, by Country 2019 & 2032
- Table 39: United Kingdom Pool Cartridge Filter Revenue (million) Forecast, by Application 2019 & 2032
- Table 40: United Kingdom Pool Cartridge Filter Volume (K) Forecast, by Application 2019 & 2032
- Table 41: Germany Pool Cartridge Filter Revenue (million) Forecast, by Application 2019 & 2032
- Table 42: Germany Pool Cartridge Filter Volume (K) Forecast, by Application 2019 & 2032
- Table 43: France Pool Cartridge Filter Revenue (million) Forecast, by Application 2019 & 2032
- Table 44: France Pool Cartridge Filter Volume (K) Forecast, by Application 2019 & 2032
- Table 45: Italy Pool Cartridge Filter Revenue (million) Forecast, by Application 2019 & 2032
- Table 46: Italy Pool Cartridge Filter Volume (K) Forecast, by Application 2019 & 2032
- Table 47: Spain Pool Cartridge Filter Revenue (million) Forecast, by Application 2019 & 2032
- Table 48: Spain Pool Cartridge Filter Volume (K) Forecast, by Application 2019 & 2032
- Table 49: Russia Pool Cartridge Filter Revenue (million) Forecast, by Application 2019 & 2032
- Table 50: Russia Pool Cartridge Filter Volume (K) Forecast, by Application 2019 & 2032
- Table 51: Benelux Pool Cartridge Filter Revenue (million) Forecast, by Application 2019 & 2032
- Table 52: Benelux Pool Cartridge Filter Volume (K) Forecast, by Application 2019 & 2032
- Table 53: Nordics Pool Cartridge Filter Revenue (million) Forecast, by Application 2019 & 2032
- Table 54: Nordics Pool Cartridge Filter Volume (K) Forecast, by Application 2019 & 2032
- Table 55: Rest of Europe Pool Cartridge Filter Revenue (million) Forecast, by Application 2019 & 2032
- Table 56: Rest of Europe Pool Cartridge Filter Volume (K) Forecast, by Application 2019 & 2032
- Table 57: Global Pool Cartridge Filter Revenue million Forecast, by Application 2019 & 2032
- Table 58: Global Pool Cartridge Filter Volume K Forecast, by Application 2019 & 2032
- Table 59: Global Pool Cartridge Filter Revenue million Forecast, by Types 2019 & 2032
- Table 60: Global Pool Cartridge Filter Volume K Forecast, by Types 2019 & 2032
- Table 61: Global Pool Cartridge Filter Revenue million Forecast, by Country 2019 & 2032
- Table 62: Global Pool Cartridge Filter Volume K Forecast, by Country 2019 & 2032
- Table 63: Turkey Pool Cartridge Filter Revenue (million) Forecast, by Application 2019 & 2032
- Table 64: Turkey Pool Cartridge Filter Volume (K) Forecast, by Application 2019 & 2032
- Table 65: Israel Pool Cartridge Filter Revenue (million) Forecast, by Application 2019 & 2032
- Table 66: Israel Pool Cartridge Filter Volume (K) Forecast, by Application 2019 & 2032
- Table 67: GCC Pool Cartridge Filter Revenue (million) Forecast, by Application 2019 & 2032
- Table 68: GCC Pool Cartridge Filter Volume (K) Forecast, by Application 2019 & 2032
- Table 69: North Africa Pool Cartridge Filter Revenue (million) Forecast, by Application 2019 & 2032
- Table 70: North Africa Pool Cartridge Filter Volume (K) Forecast, by Application 2019 & 2032
- Table 71: South Africa Pool Cartridge Filter Revenue (million) Forecast, by Application 2019 & 2032
- Table 72: South Africa Pool Cartridge Filter Volume (K) Forecast, by Application 2019 & 2032
- Table 73: Rest of Middle East & Africa Pool Cartridge Filter Revenue (million) Forecast, by Application 2019 & 2032
- Table 74: Rest of Middle East & Africa Pool Cartridge Filter Volume (K) Forecast, by Application 2019 & 2032
- Table 75: Global Pool Cartridge Filter Revenue million Forecast, by Application 2019 & 2032
- Table 76: Global Pool Cartridge Filter Volume K Forecast, by Application 2019 & 2032
- Table 77: Global Pool Cartridge Filter Revenue million Forecast, by Types 2019 & 2032
- Table 78: Global Pool Cartridge Filter Volume K Forecast, by Types 2019 & 2032
- Table 79: Global Pool Cartridge Filter Revenue million Forecast, by Country 2019 & 2032
- Table 80: Global Pool Cartridge Filter Volume K Forecast, by Country 2019 & 2032
- Table 81: China Pool Cartridge Filter Revenue (million) Forecast, by Application 2019 & 2032
- Table 82: China Pool Cartridge Filter Volume (K) Forecast, by Application 2019 & 2032
- Table 83: India Pool Cartridge Filter Revenue (million) Forecast, by Application 2019 & 2032
- Table 84: India Pool Cartridge Filter Volume (K) Forecast, by Application 2019 & 2032
- Table 85: Japan Pool Cartridge Filter Revenue (million) Forecast, by Application 2019 & 2032
- Table 86: Japan Pool Cartridge Filter Volume (K) Forecast, by Application 2019 & 2032
- Table 87: South Korea Pool Cartridge Filter Revenue (million) Forecast, by Application 2019 & 2032
- Table 88: South Korea Pool Cartridge Filter Volume (K) Forecast, by Application 2019 & 2032
- Table 89: ASEAN Pool Cartridge Filter Revenue (million) Forecast, by Application 2019 & 2032
- Table 90: ASEAN Pool Cartridge Filter Volume (K) Forecast, by Application 2019 & 2032
- Table 91: Oceania Pool Cartridge Filter Revenue (million) Forecast, by Application 2019 & 2032
- Table 92: Oceania Pool Cartridge Filter Volume (K) Forecast, by Application 2019 & 2032
- Table 93: Rest of Asia Pacific Pool Cartridge Filter Revenue (million) Forecast, by Application 2019 & 2032
- Table 94: Rest of Asia Pacific Pool Cartridge Filter Volume (K) Forecast, by Application 2019 & 2032
Frequently Asked Questions
1. What is the projected Compound Annual Growth Rate (CAGR) of the Pool Cartridge Filter?
The projected CAGR is approximately XX%.
2. Which companies are prominent players in the Pool Cartridge Filter?
Key companies in the market include Intex, Waterco, Pentair, Hayward, Zodiac Pool Systems LLC, Onga, Astral, Waterway.
3. What are the main segments of the Pool Cartridge Filter?
The market segments include Application, Types.
4. Can you provide details about the market size?
The market size is estimated to be USD XXX million as of 2022.
5. What are some drivers contributing to market growth?
N/A
6. What are the notable trends driving market growth?
N/A
7. Are there any restraints impacting market growth?
N/A
8. Can you provide examples of recent developments in the market?
N/A
9. What pricing options are available for accessing the report?
Pricing options include single-user, multi-user, and enterprise licenses priced at USD 3350.00, USD 5025.00, and USD 6700.00 respectively.
10. Is the market size provided in terms of value or volume?
The market size is provided in terms of value, measured in million and volume, measured in K.
11. Are there any specific market keywords associated with the report?
Yes, the market keyword associated with the report is "Pool Cartridge Filter," which aids in identifying and referencing the specific market segment covered.
12. How do I determine which pricing option suits my needs best?
The pricing options vary based on user requirements and access needs. Individual users may opt for single-user licenses, while businesses requiring broader access may choose multi-user or enterprise licenses for cost-effective access to the report.
13. Are there any additional resources or data provided in the Pool Cartridge Filter report?
While the report offers comprehensive insights, it's advisable to review the specific contents or supplementary materials provided to ascertain if additional resources or data are available.
14. How can I stay updated on further developments or reports in the Pool Cartridge Filter?
To stay informed about further developments, trends, and reports in the Pool Cartridge Filter, consider subscribing to industry newsletters, following relevant companies and organizations, or regularly checking reputable industry news sources and publications.
Methodology
Step 1 - Identification of Relevant Samples Size from Population Database


Step 2 - Approaches for Defining Global Market Size (Value, Volume* & Price*)

Note*: In applicable scenarios
Step 3 - Data Sources
Primary Research
- Web Analytics
- Survey Reports
- Research Institute
- Latest Research Reports
- Opinion Leaders
Secondary Research
- Annual Reports
- White Paper
- Latest Press Release
- Industry Association
- Paid Database
- Investor Presentations

Step 4 - Data Triangulation
Involves using different sources of information in order to increase the validity of a study
These sources are likely to be stakeholders in a program - participants, other researchers, program staff, other community members, and so on.
Then we put all data in single framework & apply various statistical tools to find out the dynamic on the market.
During the analysis stage, feedback from the stakeholder groups would be compared to determine areas of agreement as well as areas of divergence
