

Key Insights
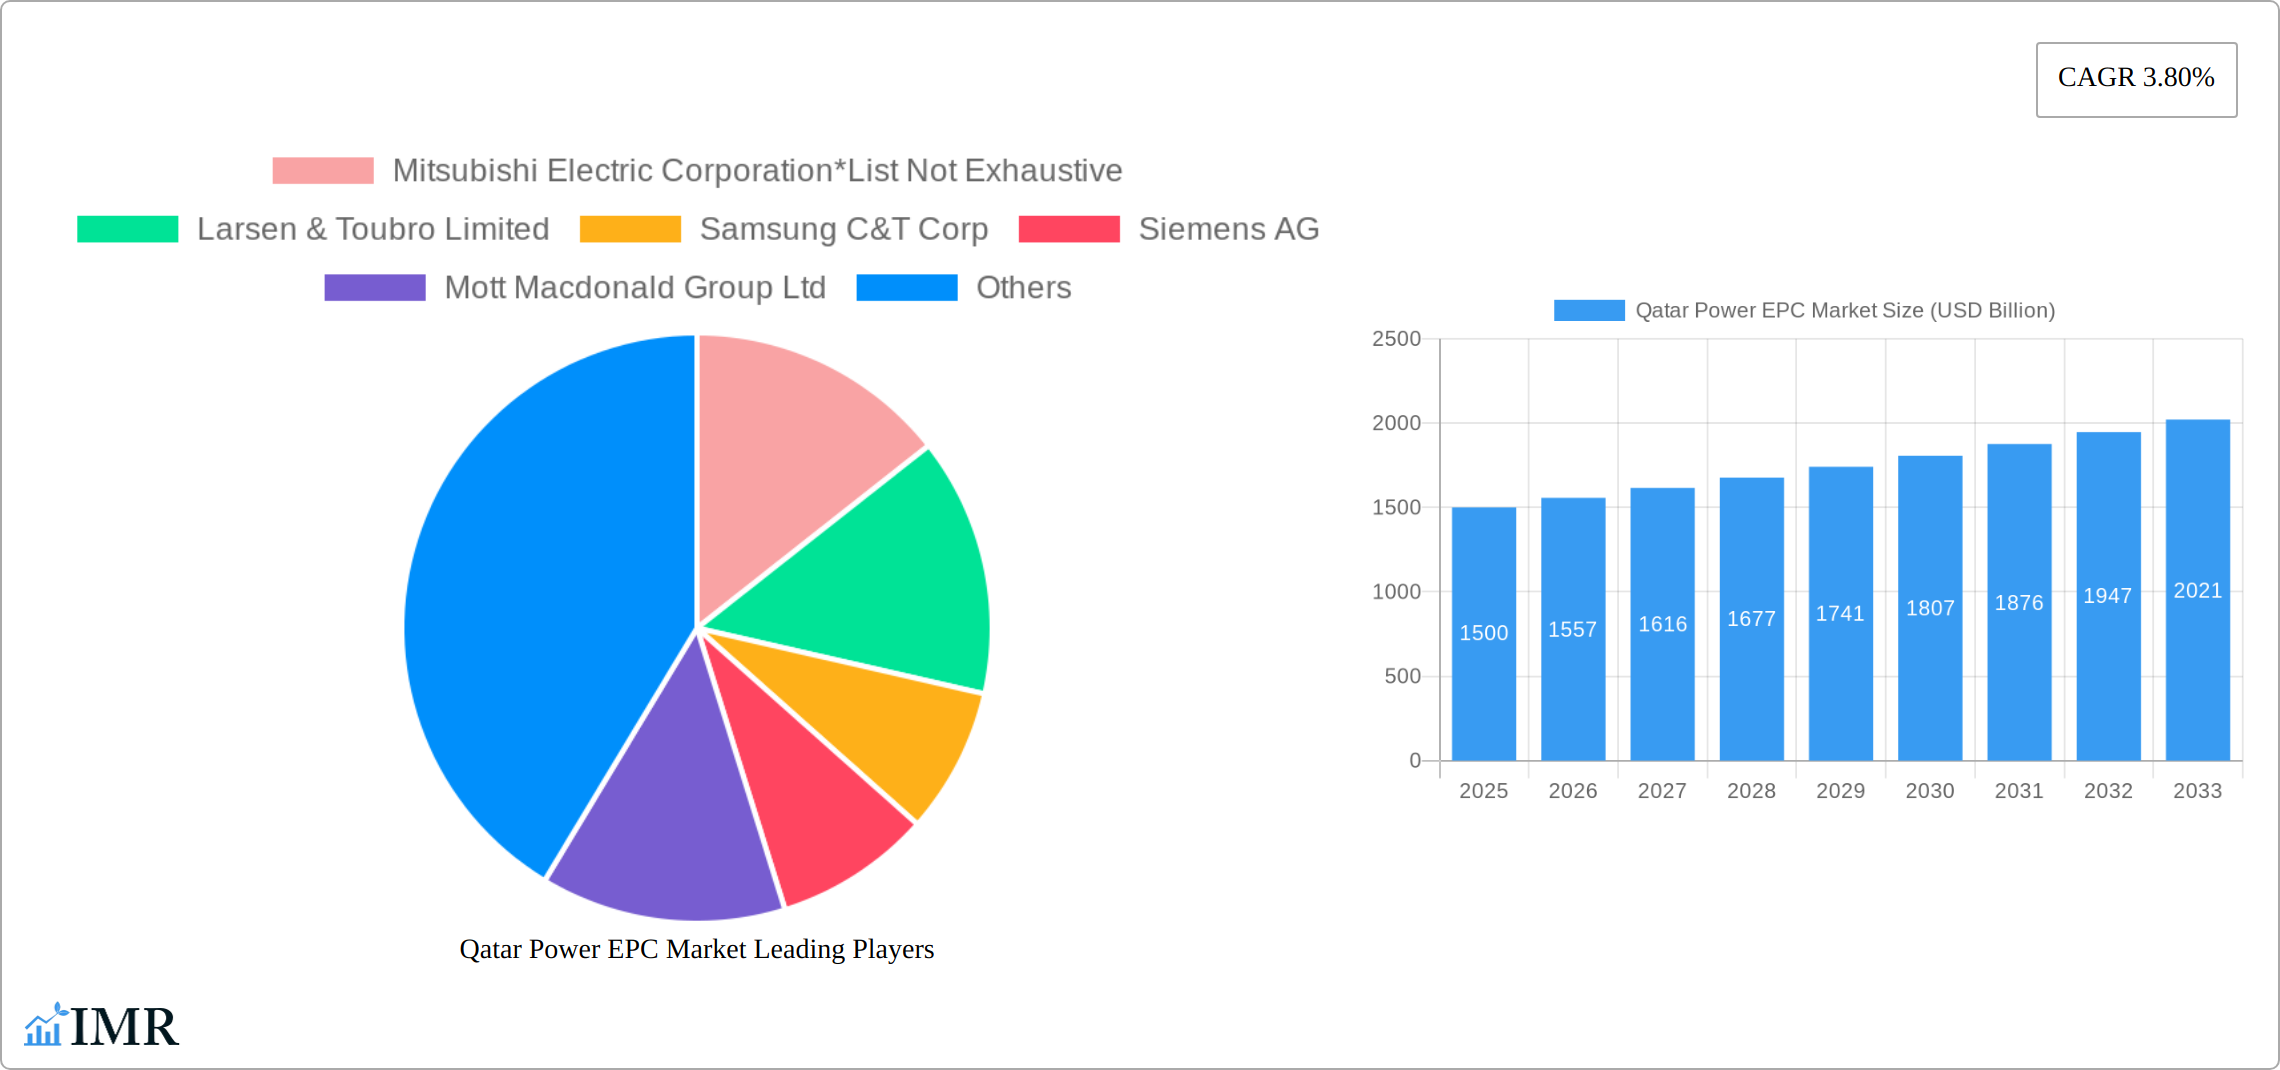
The Qatar power EPC market, valued at USD 1.5 billion in 2025, exhibits robust growth potential, projected to expand at a compound annual growth rate (CAGR) of 3.80% from 2025 to 2033. This growth is fueled by Qatar's ambitious infrastructure development plans, particularly in power generation and transmission. Significant investments in renewable energy sources, driven by the nation's commitment to sustainable development and energy diversification, are a key driver. The thermal power segment continues to be substantial, but the renewable energy segment is experiencing accelerated growth, attracting considerable investment in solar and wind power projects. Upcoming projects and EPC contracts, encompassing both under-construction and in-pipeline initiatives, are contributing significantly to market expansion. The strong involvement of major international EPC players like Mitsubishi Electric Corporation, Larsen & Toubro Limited, and Siemens AG underscores the market's attractiveness and the considerable foreign direct investment flowing into Qatar's energy sector. Competition is intense, with companies vying for lucrative contracts, leading to innovative solutions and cost optimizations within the EPC landscape. Challenges include the need for skilled labor and maintaining project timelines in line with national development strategies. Nevertheless, the long-term outlook for the Qatar power EPC market remains positive, underpinned by sustained government support and a burgeoning demand for reliable and sustainable energy solutions.
The market segmentation reveals a dynamic interplay between traditional thermal power and emerging renewable energy projects. The detailed breakdown of upcoming projects, including operators, EPC contractors, construction start dates, expected commissioning dates, and project values, provides valuable insights for stakeholders. The power transmission and distribution segment also contributes to the overall market growth, as investments in grid infrastructure are crucial for handling the increasing energy demand from both thermal and renewable sources. Analyzing this data allows for a precise understanding of market dynamics, competitor activities, and investment opportunities within specific project segments. The market data highlights a strong focus on large-scale projects and sustained investment, shaping future growth trajectories.
Qatar Power EPC Market: A Comprehensive Report (2019-2033)
This in-depth report provides a comprehensive analysis of the Qatar Power EPC market, encompassing market dynamics, growth trends, key players, and future outlook. With a study period spanning 2019-2033, a base year of 2025, and a forecast period of 2025-2033, this report is an invaluable resource for industry professionals, investors, and strategic decision-makers. The market is segmented into Power Generation (Thermal & Renewable), and Power Transmission & Distribution, providing granular insights into each segment's growth trajectory. The total market size is projected to reach xx Billion USD by 2033.
Qatar Power EPC Market Market Dynamics & Structure
This section analyzes the competitive landscape of Qatar's Power EPC market, examining factors influencing market structure and growth. The market is characterized by a mix of international and local players, with varying degrees of market concentration across segments. Technological innovation, driven by the increasing adoption of renewable energy sources and smart grid technologies, is a key driver. The regulatory framework, including government initiatives and policies promoting energy diversification, significantly influences market dynamics. Furthermore, the report analyzes M&A activity, identifying key trends and their impact on market consolidation.
- Market Concentration: Moderately concentrated, with a few dominant players and several smaller, specialized firms. xx% market share held by top 5 players in 2025.
- Technological Innovation: Significant investments in renewable energy technologies (solar, wind) and smart grid infrastructure are driving innovation.
- Regulatory Framework: Supportive government policies promoting energy independence and diversification are key growth enablers.
- Competitive Product Substitutes: Limited direct substitutes exist, but competition is intense within each segment (e.g., different renewable energy technologies).
- End-User Demographics: Primarily focused on large-scale power projects for utilities and industrial end-users.
- M&A Trends: Moderate M&A activity observed, driven by strategic acquisitions to expand market share and technological capabilities. xx number of deals closed in the past 5 years.
Qatar Power EPC Market Growth Trends & Insights
The Qatar Power EPC market has witnessed robust growth over the historical period (2019-2024), driven by sustained investments in infrastructure development and energy diversification strategies. This growth is expected to continue during the forecast period (2025-2033), albeit at a moderating pace, with the market expected to reach xx billion USD by 2033. The market's growth is fuelled by increasing energy demand, government initiatives to enhance energy security, and significant investments in renewable energy projects. Technological advancements in power generation and transmission technologies also contribute to market expansion. The report analyzes the adoption rates of various technologies, consumer behavior shifts, and identifies key factors driving market expansion. The Compound Annual Growth Rate (CAGR) during the forecast period is estimated at xx%. Market penetration of renewable energy technologies is projected to increase significantly.

Dominant Regions, Countries, or Segments in Qatar Power EPC Market
The Qatar Power EPC market is primarily concentrated in the country's major cities and industrial zones. Power Generation (both thermal and renewable) represents the largest segment, followed by Power Transmission and Distribution. The significant investments in new power plants, including both thermal and renewable projects, and the ongoing expansion of the national grid are major drivers of growth.
- Key Drivers: Government investments in infrastructure, increasing energy demand, focus on renewable energy integration, and the Qatar National Vision 2030.
- Market Share: Power Generation accounts for xx% of the total market share in 2025, with Thermal Power representing xx% and Renewable Power representing xx%. Power Transmission & Distribution accounts for the remaining xx%.
- Growth Potential: High growth potential exists in the renewable energy segment due to the country's commitment to diversifying its energy mix.
Qatar Power EPC Market Product Landscape
The Qatar Power EPC market offers a diverse range of products and services, encompassing engineering, procurement, and construction for thermal and renewable power plants, as well as power transmission and distribution infrastructure. Technological advancements are continuously improving efficiency, reducing environmental impact, and enhancing reliability. The focus is on cost-effectiveness, energy efficiency, and environmentally friendly solutions.
Key Drivers, Barriers & Challenges in Qatar Power EPC Market
Key Drivers:
- Government initiatives promoting energy diversification and infrastructure development.
- Increasing demand for reliable and efficient power supply.
- Large-scale investments in renewable energy projects.
Challenges and Restraints:
- Potential supply chain disruptions and material cost fluctuations.
- Regulatory hurdles and permit approvals for projects.
- Intense competition from both domestic and international EPC contractors.
Emerging Opportunities in Qatar Power EPC Market
Emerging opportunities include the expansion of renewable energy capacity, particularly solar and wind power, and the implementation of smart grid technologies to improve efficiency and grid stability. The development of energy storage solutions and the integration of distributed generation resources present further growth avenues.
Growth Accelerators in the Qatar Power EPC Market Industry
Long-term growth will be driven by sustained government investments, technological advancements in renewable energy technologies, and the ongoing expansion of the power grid infrastructure. Strategic partnerships between international and local companies will also play a significant role.
Key Players Shaping the Qatar Power EPC Market Market
- Mitsubishi Electric Corporation
- Larsen & Toubro Limited
- Samsung C&T Corp
- Siemens AG
- Mott Macdonald Group Ltd
- El Sewedy Electric Co SAE
- Yokogawa Electric Corporation
- ABB Ltd
- Qatar Energy Renewable Solutions
- POWERCHINA Guizhou Engineering Co.
Notable Milestones in Qatar Power EPC Market Sector
- 2022: Announcement of the "Qatar Power Transmission Master Plan".
- 2021: Commissioning of the 800 MW Umm Al Houl Power Plant.
- 2020: Plans to develop large-scale solar power plants, including the 800 MW Al Kharsaah Solar Power Plant.
In-Depth Qatar Power EPC Market Market Outlook
The Qatar Power EPC market is poised for continued growth, driven by the country's ambitious energy diversification plans and significant investments in infrastructure development. The increasing adoption of renewable energy technologies and the implementation of smart grid solutions will create substantial opportunities for EPC contractors. Strategic partnerships and technological innovation will be crucial for success in this dynamic market.
Qatar Power EPC Market Segmentation
-
1. Power Generation
-
1.1. Thermal Power
- 1.1.1. Overview
- 1.1.2. Market S
-
1.1.3. Upcoming
- 1.1.3.1. Under-construction Projects
- 1.1.3.2. In-pipeline Projects
-
1.2. Renewable Power
- 1.2.1. Upcoming
-
1.1. Thermal Power
-
2. Power Transmission and Distribution
- 2.1. Overview
- 2.2. Market S
-
2.3. Upcoming
- 2.3.1. Under-construction Projects
- 2.3.2. In-pipeline Projects
Qatar Power EPC Market Segmentation By Geography
- 1. Qatar

Qatar Power EPC Market REPORT HIGHLIGHTS
| Aspects | Details |
|---|---|
| Study Period | 2019-2033 |
| Base Year | 2024 |
| Estimated Year | 2025 |
| Forecast Period | 2025-2033 |
| Historical Period | 2019-2024 |
| Growth Rate | CAGR of 3.80% from 2019-2033 |
| Segmentation |
|
Table of Contents
- 1. Introduction
- 1.1. Research Scope
- 1.2. Market Segmentation
- 1.3. Research Methodology
- 1.4. Definitions and Assumptions
- 2. Executive Summary
- 2.1. Introduction
- 3. Market Dynamics
- 3.1. Introduction
- 3.2. Market Drivers
- 3.2.1. 4.; Increasing investment in the Midstream Sector4.; Increasing Production of Oil and Natural Gas
- 3.3. Market Restrains
- 3.3.1. 4.; Inadequate Infrastructure in the Country
- 3.4. Market Trends
- 3.4.1. Power Transmission and Distribution Segment to Witness Significant Growth
- 4. Market Factor Analysis
- 4.1. Porters Five Forces
- 4.2. Supply/Value Chain
- 4.3. PESTEL analysis
- 4.4. Market Entropy
- 4.5. Patent/Trademark Analysis
- 5. Qatar Power EPC Market Analysis, Insights and Forecast, 2019-2031
- 5.1. Market Analysis, Insights and Forecast - by Power Generation
- 5.1.1. Thermal Power
- 5.1.1.1. Overview
- 5.1.1.2. Market S
- 5.1.1.3. Upcoming
- 5.1.1.3.1. Under-construction Projects
- 5.1.1.3.2. In-pipeline Projects
- 5.1.2. Renewable Power
- 5.1.2.1. Upcoming
- 5.1.1. Thermal Power
- 5.2. Market Analysis, Insights and Forecast - by Power Transmission and Distribution
- 5.2.1. Overview
- 5.2.2. Market S
- 5.2.3. Upcoming
- 5.2.3.1. Under-construction Projects
- 5.2.3.2. In-pipeline Projects
- 5.3. Market Analysis, Insights and Forecast - by Region
- 5.3.1. Qatar
- 5.1. Market Analysis, Insights and Forecast - by Power Generation
- 6. Competitive Analysis
- 6.1. Market Share Analysis 2024
- 6.2. Company Profiles
- 6.2.1 Mitsubishi Electric Corporation*List Not Exhaustive
- 6.2.1.1. Overview
- 6.2.1.2. Products
- 6.2.1.3. SWOT Analysis
- 6.2.1.4. Recent Developments
- 6.2.1.5. Financials (Based on Availability)
- 6.2.2 Larsen & Toubro Limited
- 6.2.2.1. Overview
- 6.2.2.2. Products
- 6.2.2.3. SWOT Analysis
- 6.2.2.4. Recent Developments
- 6.2.2.5. Financials (Based on Availability)
- 6.2.3 Samsung C&T Corp
- 6.2.3.1. Overview
- 6.2.3.2. Products
- 6.2.3.3. SWOT Analysis
- 6.2.3.4. Recent Developments
- 6.2.3.5. Financials (Based on Availability)
- 6.2.4 Siemens AG
- 6.2.4.1. Overview
- 6.2.4.2. Products
- 6.2.4.3. SWOT Analysis
- 6.2.4.4. Recent Developments
- 6.2.4.5. Financials (Based on Availability)
- 6.2.5 Mott Macdonald Group Ltd
- 6.2.5.1. Overview
- 6.2.5.2. Products
- 6.2.5.3. SWOT Analysis
- 6.2.5.4. Recent Developments
- 6.2.5.5. Financials (Based on Availability)
- 6.2.6 El Sewedy Electric Co SAE
- 6.2.6.1. Overview
- 6.2.6.2. Products
- 6.2.6.3. SWOT Analysis
- 6.2.6.4. Recent Developments
- 6.2.6.5. Financials (Based on Availability)
- 6.2.7 Yokogawa Electric Corporation
- 6.2.7.1. Overview
- 6.2.7.2. Products
- 6.2.7.3. SWOT Analysis
- 6.2.7.4. Recent Developments
- 6.2.7.5. Financials (Based on Availability)
- 6.2.8 ABB Ltd
- 6.2.8.1. Overview
- 6.2.8.2. Products
- 6.2.8.3. SWOT Analysis
- 6.2.8.4. Recent Developments
- 6.2.8.5. Financials (Based on Availability)
- 6.2.9 Qatar Energy Renewable Solutions
- 6.2.9.1. Overview
- 6.2.9.2. Products
- 6.2.9.3. SWOT Analysis
- 6.2.9.4. Recent Developments
- 6.2.9.5. Financials (Based on Availability)
- 6.2.10 POWERCHINA Guizhou Engineering Co.
- 6.2.10.1. Overview
- 6.2.10.2. Products
- 6.2.10.3. SWOT Analysis
- 6.2.10.4. Recent Developments
- 6.2.10.5. Financials (Based on Availability)
- 6.2.1 Mitsubishi Electric Corporation*List Not Exhaustive
List of Figures
- Figure 1: Qatar Power EPC Market Revenue Breakdown (USD Billion, %) by Product 2024 & 2032
- Figure 2: Qatar Power EPC Market Share (%) by Company 2024
List of Tables
- Table 1: Qatar Power EPC Market Revenue USD Billion Forecast, by Region 2019 & 2032
- Table 2: Qatar Power EPC Market Volume Gigawatt Forecast, by Region 2019 & 2032
- Table 3: Qatar Power EPC Market Revenue USD Billion Forecast, by Power Generation 2019 & 2032
- Table 4: Qatar Power EPC Market Volume Gigawatt Forecast, by Power Generation 2019 & 2032
- Table 5: Qatar Power EPC Market Revenue USD Billion Forecast, by Power Transmission and Distribution 2019 & 2032
- Table 6: Qatar Power EPC Market Volume Gigawatt Forecast, by Power Transmission and Distribution 2019 & 2032
- Table 7: Qatar Power EPC Market Revenue USD Billion Forecast, by Region 2019 & 2032
- Table 8: Qatar Power EPC Market Volume Gigawatt Forecast, by Region 2019 & 2032
- Table 9: Qatar Power EPC Market Revenue USD Billion Forecast, by Country 2019 & 2032
- Table 10: Qatar Power EPC Market Volume Gigawatt Forecast, by Country 2019 & 2032
- Table 11: Qatar Power EPC Market Revenue USD Billion Forecast, by Power Generation 2019 & 2032
- Table 12: Qatar Power EPC Market Volume Gigawatt Forecast, by Power Generation 2019 & 2032
- Table 13: Qatar Power EPC Market Revenue USD Billion Forecast, by Power Transmission and Distribution 2019 & 2032
- Table 14: Qatar Power EPC Market Volume Gigawatt Forecast, by Power Transmission and Distribution 2019 & 2032
- Table 15: Qatar Power EPC Market Revenue USD Billion Forecast, by Country 2019 & 2032
- Table 16: Qatar Power EPC Market Volume Gigawatt Forecast, by Country 2019 & 2032
Frequently Asked Questions
1. What is the projected Compound Annual Growth Rate (CAGR) of the Qatar Power EPC Market?
The projected CAGR is approximately 3.80%.
2. Which companies are prominent players in the Qatar Power EPC Market?
Key companies in the market include Mitsubishi Electric Corporation*List Not Exhaustive, Larsen & Toubro Limited, Samsung C&T Corp, Siemens AG, Mott Macdonald Group Ltd, El Sewedy Electric Co SAE, Yokogawa Electric Corporation, ABB Ltd , Qatar Energy Renewable Solutions , POWERCHINA Guizhou Engineering Co..
3. What are the main segments of the Qatar Power EPC Market?
The market segments include Power Generation, Power Transmission and Distribution.
4. Can you provide details about the market size?
The market size is estimated to be USD 1.5 USD Billion as of 2022.
5. What are some drivers contributing to market growth?
4.; Increasing investment in the Midstream Sector4.; Increasing Production of Oil and Natural Gas.
6. What are the notable trends driving market growth?
Power Transmission and Distribution Segment to Witness Significant Growth.
7. Are there any restraints impacting market growth?
4.; Inadequate Infrastructure in the Country.
8. Can you provide examples of recent developments in the market?
Announcement of the "Qatar Power Transmission Master Plan" to enhance the country's power grid infrastructure
9. What pricing options are available for accessing the report?
Pricing options include single-user, multi-user, and enterprise licenses priced at USD 3800, USD 4500, and USD 5800 respectively.
10. Is the market size provided in terms of value or volume?
The market size is provided in terms of value, measured in USD Billion and volume, measured in Gigawatt.
11. Are there any specific market keywords associated with the report?
Yes, the market keyword associated with the report is "Qatar Power EPC Market," which aids in identifying and referencing the specific market segment covered.
12. How do I determine which pricing option suits my needs best?
The pricing options vary based on user requirements and access needs. Individual users may opt for single-user licenses, while businesses requiring broader access may choose multi-user or enterprise licenses for cost-effective access to the report.
13. Are there any additional resources or data provided in the Qatar Power EPC Market report?
While the report offers comprehensive insights, it's advisable to review the specific contents or supplementary materials provided to ascertain if additional resources or data are available.
14. How can I stay updated on further developments or reports in the Qatar Power EPC Market?
To stay informed about further developments, trends, and reports in the Qatar Power EPC Market, consider subscribing to industry newsletters, following relevant companies and organizations, or regularly checking reputable industry news sources and publications.
Methodology
Step 1 - Identification of Relevant Samples Size from Population Database


Step 2 - Approaches for Defining Global Market Size (Value, Volume* & Price*)

Note*: In applicable scenarios
Step 3 - Data Sources
Primary Research
- Web Analytics
- Survey Reports
- Research Institute
- Latest Research Reports
- Opinion Leaders
Secondary Research
- Annual Reports
- White Paper
- Latest Press Release
- Industry Association
- Paid Database
- Investor Presentations

Step 4 - Data Triangulation
Involves using different sources of information in order to increase the validity of a study
These sources are likely to be stakeholders in a program - participants, other researchers, program staff, other community members, and so on.
Then we put all data in single framework & apply various statistical tools to find out the dynamic on the market.
During the analysis stage, feedback from the stakeholder groups would be compared to determine areas of agreement as well as areas of divergence
