

Key Insights
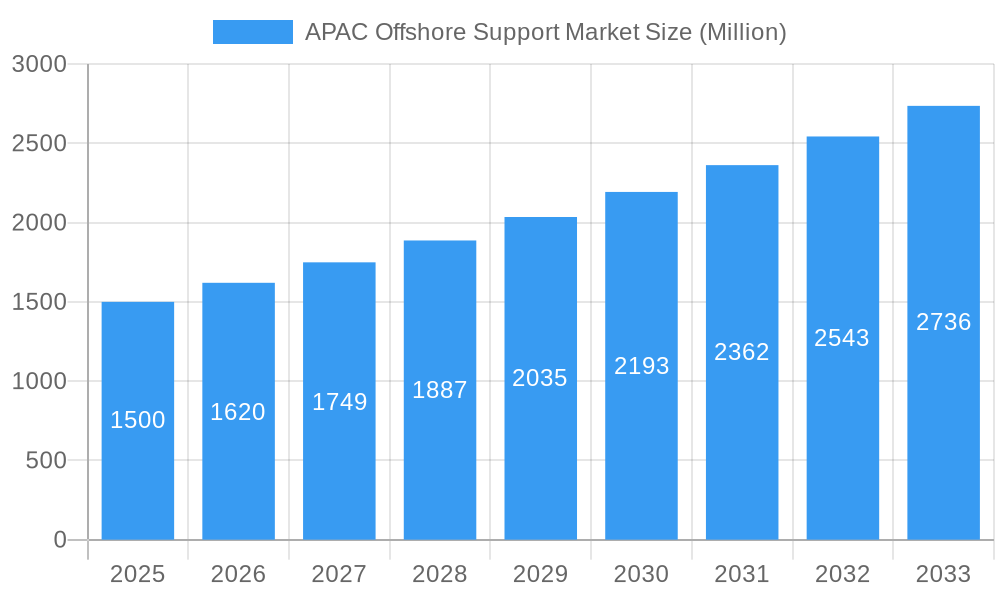
The Asia-Pacific (APAC) offshore support vessel market is experiencing robust growth, driven by increasing offshore oil and gas exploration and production activities, particularly in Southeast Asia and Australia. The region's burgeoning renewable energy sector, focusing on offshore wind farms, further fuels market expansion. While the global market exhibits a Compound Annual Growth Rate (CAGR) exceeding 7%, APAC's growth is likely to be even more significant, potentially reaching a CAGR of 8-9% from 2025-2033, driven by strong government support for energy transition and infrastructure development. This growth is propelled by the increasing demand for specialized vessels like Anchor Handling Tug/Supply Vessels (AHTS) and Platform Supply Vessels (PSV) to support these operations. However, the market faces certain restraints including fluctuating oil prices, stringent environmental regulations impacting operational costs, and potential supply chain disruptions. Despite these challenges, the long-term outlook for the APAC offshore support vessel market remains positive, supported by the consistent rise in offshore energy activities.
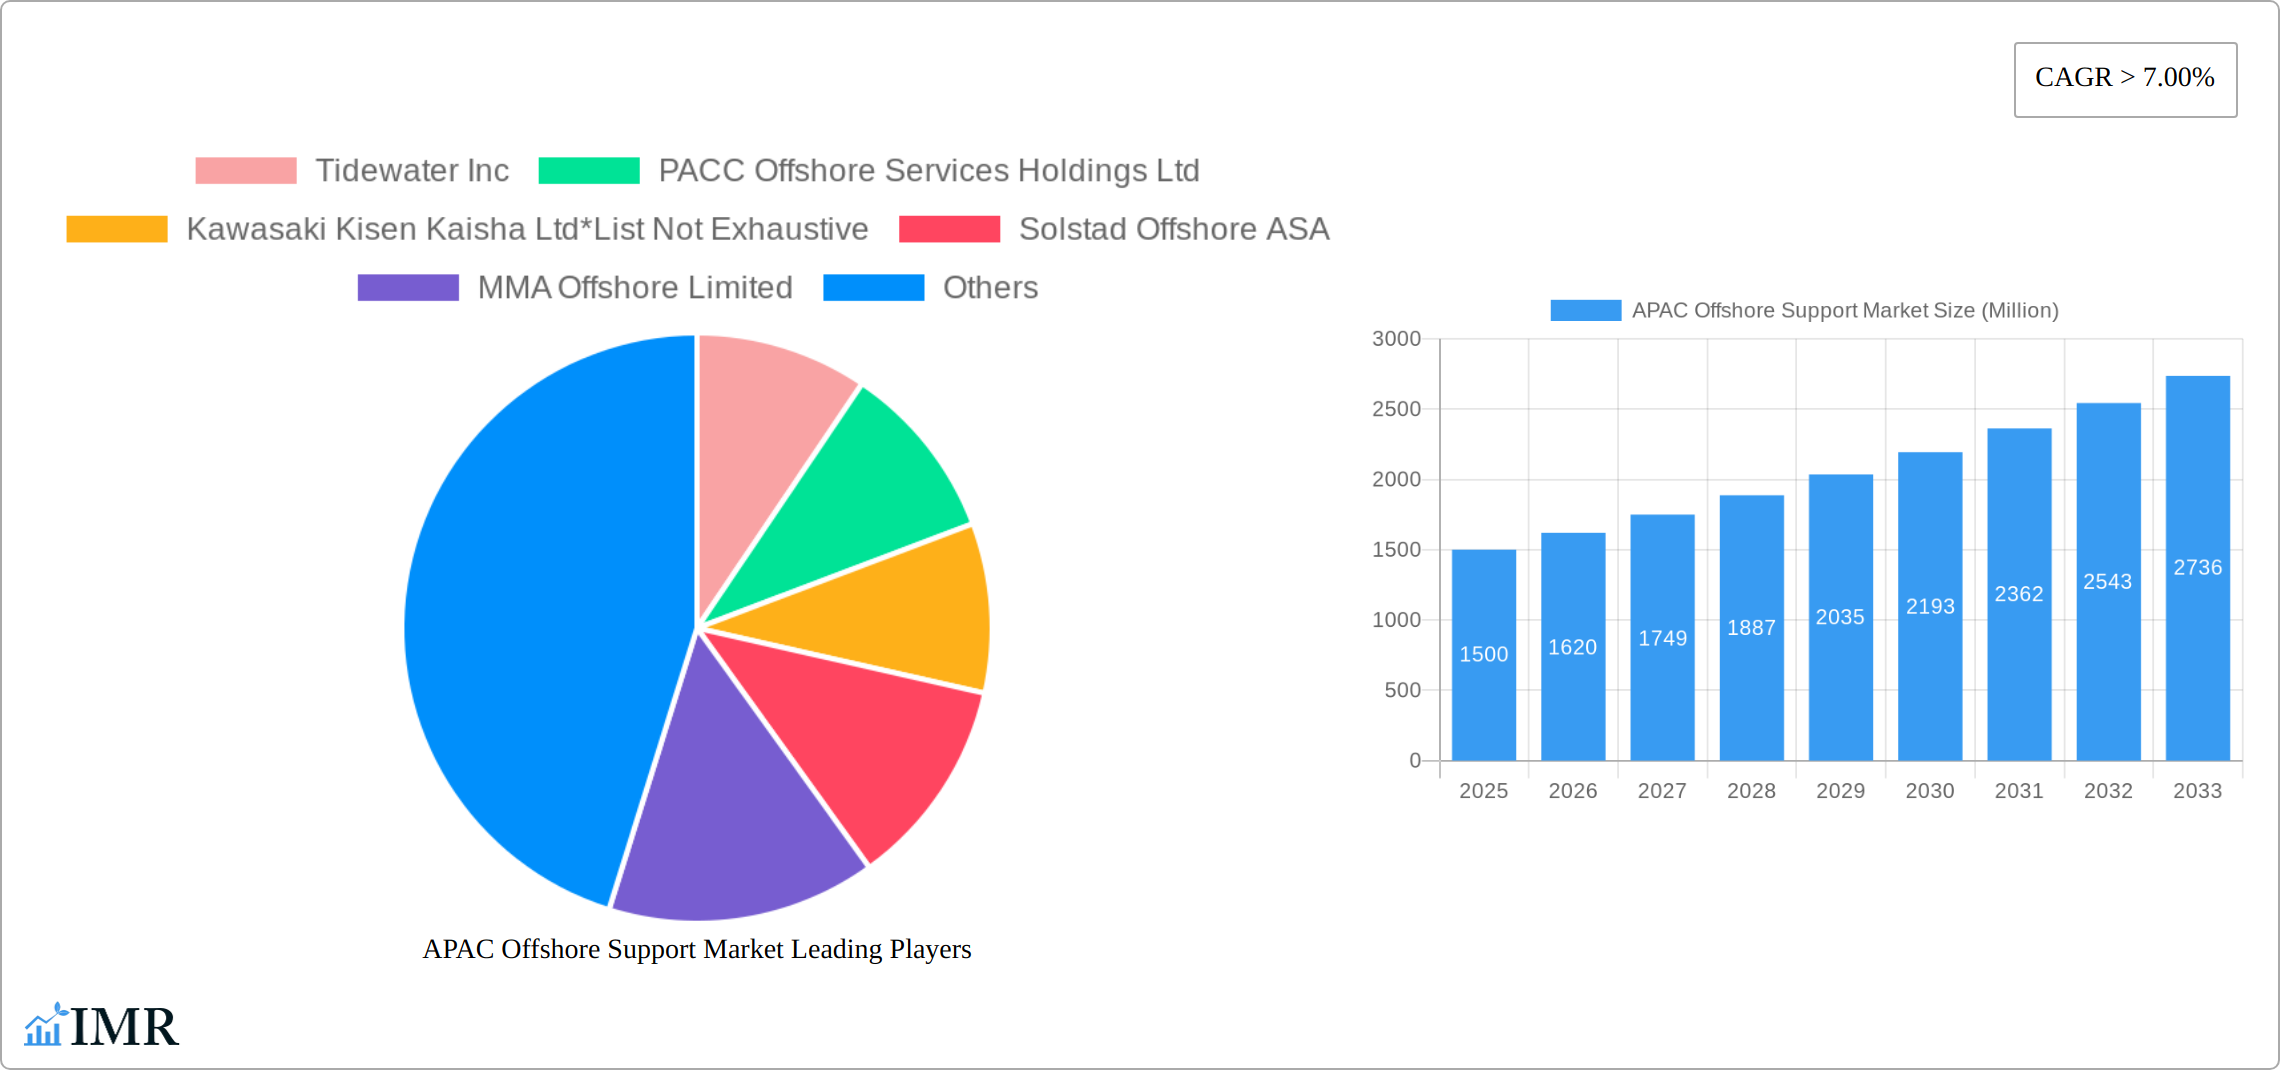
APAC Offshore Support Market Market Size (In Billion)
The market segmentation within APAC shows a significant share held by the oil and gas sector, followed by a rapidly growing renewable energy segment. Among vessel types, AHTS and PSVs dominate, reflecting the industry's core operational needs. Key players such as Tidewater Inc., PACC Offshore Services, and others are strategically positioned to capitalize on this growth. China, Japan, India, and Australia are the major contributors to the market's expansion, driven by extensive offshore projects. Increased investment in infrastructure and ongoing exploration activities across the region are creating a favorable environment for sustained market expansion in the coming years. However, competition among existing players and the entry of new players will be key factors shaping the market dynamics in the coming years. Understanding the unique opportunities and challenges presented by individual countries within the APAC region is crucial for market participants seeking to succeed.
APAC Offshore Support Market Company Market Share
APAC Offshore Support Market: A Comprehensive Report (2019-2033)
This comprehensive report provides an in-depth analysis of the Asia-Pacific (APAC) offshore support market, encompassing market dynamics, growth trends, dominant segments, and key players. The study period covers 2019-2033, with a base year of 2025 and a forecast period of 2025-2033. The market is segmented by vessel type (Anchor Handling Tug/Anchor Handling Tower Supply Vessels (AHT/AHTS), Platform Supply Vessels, Other Types) and application (Oil and gas, Renewable energy, Other applications). This report is crucial for industry professionals, investors, and strategists seeking to understand and capitalize on the opportunities within this dynamic market. The estimated market size in 2025 is xx Million.
APAC Offshore Support Market Dynamics & Structure
The APAC offshore support market is characterized by a moderately concentrated landscape, with several major players vying for market share. Technological innovation, primarily driven by advancements in automation, remote operations, and emission reduction technologies, significantly influences market growth. Stringent regulatory frameworks concerning safety, environmental protection, and operational efficiency shape market dynamics. The market also faces competition from alternative solutions such as drones and remotely operated vehicles (ROVs) for specific tasks. The end-user demographic primarily comprises oil and gas companies, renewable energy developers, and other marine industries. Mergers and acquisitions (M&A) activity has been moderate, driven by the consolidation of fleet operators and technological collaborations.
- Market Concentration: Moderately concentrated, with top 5 players holding approximately xx% market share in 2025.
- Technological Innovation: Focus on automation, digitalization, and environmentally friendly solutions.
- Regulatory Framework: Stringent safety and environmental regulations, influencing vessel design and operations.
- Competitive Substitutes: Drones, ROVs, and other emerging technologies pose competitive pressure.
- End-User Demographics: Oil & gas, renewable energy, and other marine industries.
- M&A Activity: Moderate M&A activity, driven by consolidation and technological partnerships. Estimated xx deals between 2019-2024.
APAC Offshore Support Market Growth Trends & Insights
The APAC offshore support market, while experiencing moderate growth from 2019-2024 influenced by fluctuating oil prices and the global pandemic, is poised for a substantial rebound and robust expansion from 2025 onwards. This resurgence is primarily driven by the burgeoning offshore wind energy sector, increased oil and gas exploration activities in key regions, and a broader industry shift towards offshore operations. The escalating demand for specialized vessels, particularly those designed for renewable energy support such as walk-to-work vessels and Crew Transfer Vessels (CTVs), is a key catalyst for this growth. The market is projected to exhibit a Compound Annual Growth Rate (CAGR) of [Insert Specific CAGR]% during the forecast period (2025-2033), reaching an estimated market size of [Insert Specific Market Size] Million by 2033. This significant expansion will be further accelerated by technological advancements, including the increasing adoption of autonomous vessels and remote operations, while simultaneously aligning with the global push towards sustainable practices and a corresponding demand for eco-friendly vessels. Market penetration of advanced technologies is anticipated to increase from [Insert Specific Percentage]% in 2025 to [Insert Specific Percentage]% by 2033. This growth will be supported by increasing government investment in renewable energy infrastructure and supportive regulatory frameworks.
Dominant Regions, Countries, or Segments in APAC Offshore Support Market
Southeast Asia and Australia are emerging as leading markets within the APAC region, fueled by substantial investments in offshore wind energy projects and continued oil and gas exploration. China and Taiwan are at the forefront of walk-to-work vessel adoption, reflecting their strong commitment to renewable energy infrastructure development. Anchor Handling Tug/Supply Vessels (AHTS) continue to hold a significant market share due to their versatility across various offshore operations. While the oil and gas sector remains a major application driver, the renewable energy sector is experiencing rapid growth, quickly becoming a dominant force shaping market demand.
- Key Drivers:
- Southeast Asia: Rapid expansion of offshore wind farms, coupled with ongoing exploration and production of oil and gas resources.
- Australia: Significant investments in offshore oil and gas infrastructure, and growing interest in offshore wind energy.
- China & Taiwan: Strong government support for renewable energy, leading to substantial demand for specialized support vessels for offshore wind farms and other renewable energy projects.
- India: Increasing exploration and production activities in offshore oil and gas, coupled with growing interest in offshore renewable energy.
- Economic Policies: Government initiatives promoting renewable energy and robust infrastructure development are creating favorable market conditions.
- Dominance Factors: Market share, growth potential, supportive government policies, and robust infrastructure development are key factors determining market dominance. In 2025, Southeast Asia is projected to hold the largest market share ([Insert Specific Percentage]% ), followed by Australia ([Insert Specific Percentage]%) and China ([Insert Specific Percentage]% ).
APAC Offshore Support Market Product Landscape
The APAC offshore support market features a diverse range of vessels, with a strong emphasis on specialized designs catering to specific operational needs. Innovations include enhanced dynamic positioning systems, improved fuel efficiency technologies, and advanced safety features. Key performance metrics include operational uptime, fuel consumption, and cargo capacity. Unique selling propositions focus on efficiency, safety, and environmental performance. Technological advancements are heavily geared towards automation and remote operation capabilities.
Key Drivers, Barriers & Challenges in APAP Offshore Support Market
Key Drivers:
- Growing demand for offshore wind energy support vessels.
- Increased offshore oil and gas exploration activities in certain areas.
- Technological advancements leading to greater efficiency and safety.
- Government policies supporting renewable energy and maritime infrastructure.
Key Challenges & Restraints:
- Fluctuations in oil prices impacting investment decisions.
- Stringent environmental regulations increasing operational costs.
- Supply chain disruptions potentially affecting vessel construction and maintenance.
- Intense competition among vessel operators leading to price pressures. Estimated impact on profit margins: xx% reduction in 2024 due to competition.
Emerging Opportunities in APAC Offshore Support Market
- Expansion into underserved markets within the APAC region, focusing on developing economies with significant offshore potential.
- Growth in specialized vessels for the decommissioning of aging offshore oil and gas infrastructure, a sector requiring specialized capabilities.
- Increasing demand for vessels equipped with advanced technologies for remote operations, automation, and data analytics, enhancing efficiency and safety.
- Opportunities in servicing the burgeoning offshore aquaculture industry, which requires specialized support vessels.
- Development and deployment of innovative vessel designs and technologies that meet the evolving needs of the offshore energy sector, incorporating sustainability and efficiency features.
Growth Accelerators in the APAC Offshore Support Market Industry
Technological breakthroughs in areas such as autonomous navigation and emission reduction technologies are crucial growth drivers. Strategic partnerships between vessel operators and technology providers are also facilitating innovation. Expansion into new markets and diversification into emerging applications, such as subsea mining support, offer further growth potential.
Key Players Shaping the APAC Offshore Support Market Market
- Tidewater Inc
- PACC Offshore Services Holdings Ltd
- Kawasaki Kisen Kaisha Ltd
- Solstad Offshore ASA
- MMA Offshore Limited
- Seacor Marine Holdings Inc
- Nam Cheong Offshore Pte Ltd
- Maersk Supply Services AS
Notable Milestones in APAC Offshore Support Market Sector
- January 2022: TSS Pioneer, an offshore support vessel, completed sea trials in Vietnam, signifying progress in the region's offshore support capabilities.
- October 2021: Dong Fang Offshore launched Taiwan's first walk-to-work vessel for offshore wind farms, highlighting the growing commitment to renewable energy in the region.
- [Add other relevant recent milestones and news]
In-Depth APAC Offshore Support Market Market Outlook
The APAC offshore support market is poised for sustained growth driven by strong demand from renewable energy and oil & gas sectors. Strategic investments in advanced technologies and expansion into new geographical areas will be crucial for capitalizing on future market potential. The market presents significant opportunities for companies focusing on innovation, sustainability, and operational efficiency. The long-term outlook remains positive, with considerable potential for market expansion and value creation.
APAC Offshore Support Market Segmentation
- 1. Production Analysis
- 2. Consumption Analysis
- 3. Import Market Analysis (Value & Volume)
- 4. Export Market Analysis (Value & Volume)
- 5. Price Trend Analysis
APAC Offshore Support Market Segmentation By Geography
- 1. China
- 2. India
- 3. Japan
- 4. South Korea
- 5. Australia
- 6. Singapore
- 7. Indonesia
- 8. Rest of Asia Pacific
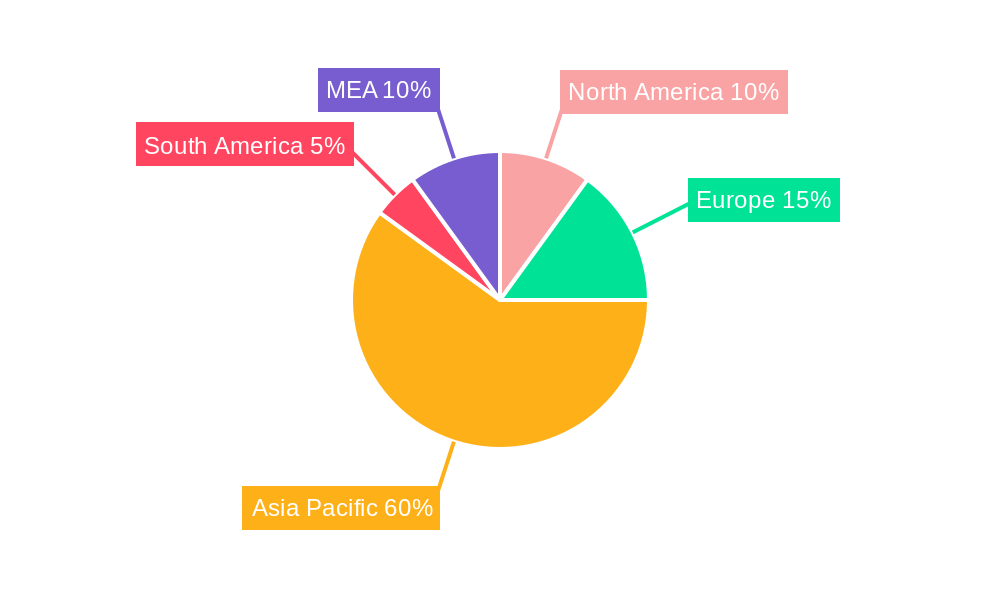
APAC Offshore Support Market Regional Market Share
Geographic Coverage of APAC Offshore Support Market
APAC Offshore Support Market REPORT HIGHLIGHTS
| Aspects | Details |
|---|---|
| Study Period | 2020-2034 |
| Base Year | 2025 |
| Estimated Year | 2026 |
| Forecast Period | 2026-2034 |
| Historical Period | 2020-2025 |
| Growth Rate | CAGR of 4.2% from 2020-2034 |
| Segmentation |
|
Table of Contents
- 1. Introduction
- 1.1. Research Scope
- 1.2. Market Segmentation
- 1.3. Research Objective
- 1.4. Definitions and Assumptions
- 2. Executive Summary
- 2.1. Market Snapshot
- 3. Market Dynamics
- 3.1. Market Drivers
- 3.2. Market Restrains
- 3.3. Market Trends
- 3.4. Market Opportunities
- 4. Market Factor Analysis
- 4.1. Porters Five Forces
- 4.1.1. Bargaining Power of Suppliers
- 4.1.2. Bargaining Power of Buyers
- 4.1.3. Threat of New Entrants
- 4.1.4. Threat of Substitutes
- 4.1.5. Competitive Rivalry
- 4.2. PESTEL analysis
- 4.3. BCG Analysis
- 4.3.1. Stars (High Growth, High Market Share)
- 4.3.2. Cash Cows (Low Growth, High Market Share)
- 4.3.3. Question Mark (High Growth, Low Market Share)
- 4.3.4. Dogs (Low Growth, Low Market Share)
- 4.4. Ansoff Matrix Analysis
- 4.5. Supply Chain Analysis
- 4.6. Regulatory Landscape
- 4.7. Current Market Potential and Opportunity Assessment (TAM–SAM–SOM Framework)
- 4.8. IMR Analyst Note
- 4.1. Porters Five Forces
- 5. Market Analysis, Insights and Forecast 2021-2033
- 5.1. Market Analysis, Insights and Forecast - by Production Analysis
- 5.2. Market Analysis, Insights and Forecast - by Consumption Analysis
- 5.3. Market Analysis, Insights and Forecast - by Import Market Analysis (Value & Volume)
- 5.4. Market Analysis, Insights and Forecast - by Export Market Analysis (Value & Volume)
- 5.5. Market Analysis, Insights and Forecast - by Price Trend Analysis
- 5.6. Market Analysis, Insights and Forecast - by Region
- 5.6.1. China
- 5.6.2. India
- 5.6.3. Japan
- 5.6.4. South Korea
- 5.6.5. Australia
- 5.6.6. Singapore
- 5.6.7. Indonesia
- 5.6.8. Rest of Asia Pacific
- 6. Global APAC Offshore Support Market Analysis, Insights and Forecast, 2021-2033
- 6.1. Market Analysis, Insights and Forecast - by Production Analysis
- 6.2. Market Analysis, Insights and Forecast - by Consumption Analysis
- 6.3. Market Analysis, Insights and Forecast - by Import Market Analysis (Value & Volume)
- 6.4. Market Analysis, Insights and Forecast - by Export Market Analysis (Value & Volume)
- 6.5. Market Analysis, Insights and Forecast - by Price Trend Analysis
- 7. China APAC Offshore Support Market Analysis, Insights and Forecast, 2020-2032
- 7.1. Market Analysis, Insights and Forecast - by Production Analysis
- 7.2. Market Analysis, Insights and Forecast - by Consumption Analysis
- 7.3. Market Analysis, Insights and Forecast - by Import Market Analysis (Value & Volume)
- 7.4. Market Analysis, Insights and Forecast - by Export Market Analysis (Value & Volume)
- 7.5. Market Analysis, Insights and Forecast - by Price Trend Analysis
- 8. India APAC Offshore Support Market Analysis, Insights and Forecast, 2020-2032
- 8.1. Market Analysis, Insights and Forecast - by Production Analysis
- 8.2. Market Analysis, Insights and Forecast - by Consumption Analysis
- 8.3. Market Analysis, Insights and Forecast - by Import Market Analysis (Value & Volume)
- 8.4. Market Analysis, Insights and Forecast - by Export Market Analysis (Value & Volume)
- 8.5. Market Analysis, Insights and Forecast - by Price Trend Analysis
- 9. Japan APAC Offshore Support Market Analysis, Insights and Forecast, 2020-2032
- 9.1. Market Analysis, Insights and Forecast - by Production Analysis
- 9.2. Market Analysis, Insights and Forecast - by Consumption Analysis
- 9.3. Market Analysis, Insights and Forecast - by Import Market Analysis (Value & Volume)
- 9.4. Market Analysis, Insights and Forecast - by Export Market Analysis (Value & Volume)
- 9.5. Market Analysis, Insights and Forecast - by Price Trend Analysis
- 10. South Korea APAC Offshore Support Market Analysis, Insights and Forecast, 2020-2032
- 10.1. Market Analysis, Insights and Forecast - by Production Analysis
- 10.2. Market Analysis, Insights and Forecast - by Consumption Analysis
- 10.3. Market Analysis, Insights and Forecast - by Import Market Analysis (Value & Volume)
- 10.4. Market Analysis, Insights and Forecast - by Export Market Analysis (Value & Volume)
- 10.5. Market Analysis, Insights and Forecast - by Price Trend Analysis
- 11. Australia APAC Offshore Support Market Analysis, Insights and Forecast, 2020-2032
- 11.1. Market Analysis, Insights and Forecast - by Production Analysis
- 11.2. Market Analysis, Insights and Forecast - by Consumption Analysis
- 11.3. Market Analysis, Insights and Forecast - by Import Market Analysis (Value & Volume)
- 11.4. Market Analysis, Insights and Forecast - by Export Market Analysis (Value & Volume)
- 11.5. Market Analysis, Insights and Forecast - by Price Trend Analysis
- 12. Singapore APAC Offshore Support Market Analysis, Insights and Forecast, 2020-2032
- 12.1. Market Analysis, Insights and Forecast - by Production Analysis
- 12.2. Market Analysis, Insights and Forecast - by Consumption Analysis
- 12.3. Market Analysis, Insights and Forecast - by Import Market Analysis (Value & Volume)
- 12.4. Market Analysis, Insights and Forecast - by Export Market Analysis (Value & Volume)
- 12.5. Market Analysis, Insights and Forecast - by Price Trend Analysis
- 13. Indonesia APAC Offshore Support Market Analysis, Insights and Forecast, 2020-2032
- 13.1. Market Analysis, Insights and Forecast - by Production Analysis
- 13.2. Market Analysis, Insights and Forecast - by Consumption Analysis
- 13.3. Market Analysis, Insights and Forecast - by Import Market Analysis (Value & Volume)
- 13.4. Market Analysis, Insights and Forecast - by Export Market Analysis (Value & Volume)
- 13.5. Market Analysis, Insights and Forecast - by Price Trend Analysis
- 14. Rest of Asia Pacific APAC Offshore Support Market Analysis, Insights and Forecast, 2020-2032
- 14.1. Market Analysis, Insights and Forecast - by Production Analysis
- 14.2. Market Analysis, Insights and Forecast - by Consumption Analysis
- 14.3. Market Analysis, Insights and Forecast - by Import Market Analysis (Value & Volume)
- 14.4. Market Analysis, Insights and Forecast - by Export Market Analysis (Value & Volume)
- 14.5. Market Analysis, Insights and Forecast - by Price Trend Analysis
- 15. Competitive Analysis
- 15.1. Company Profiles
- 15.1.1 Tidewater Inc
- 15.1.1.1. Company Overview
- 15.1.1.2. Products
- 15.1.1.3. Company Financials
- 15.1.1.4. SWOT Analysis
- 15.1.2 PACC Offshore Services Holdings Ltd
- 15.1.2.1. Company Overview
- 15.1.2.2. Products
- 15.1.2.3. Company Financials
- 15.1.2.4. SWOT Analysis
- 15.1.3 Kawasaki Kisen Kaisha Ltd*List Not Exhaustive
- 15.1.3.1. Company Overview
- 15.1.3.2. Products
- 15.1.3.3. Company Financials
- 15.1.3.4. SWOT Analysis
- 15.1.4 Solstad Offshore ASA
- 15.1.4.1. Company Overview
- 15.1.4.2. Products
- 15.1.4.3. Company Financials
- 15.1.4.4. SWOT Analysis
- 15.1.5 MMA Offshore Limited
- 15.1.5.1. Company Overview
- 15.1.5.2. Products
- 15.1.5.3. Company Financials
- 15.1.5.4. SWOT Analysis
- 15.1.6 Seacor Marine Holdings Inc
- 15.1.6.1. Company Overview
- 15.1.6.2. Products
- 15.1.6.3. Company Financials
- 15.1.6.4. SWOT Analysis
- 15.1.7 Nam Cheong Offshore Pte Ltd
- 15.1.7.1. Company Overview
- 15.1.7.2. Products
- 15.1.7.3. Company Financials
- 15.1.7.4. SWOT Analysis
- 15.1.8 Maersk Supply Services AS
- 15.1.8.1. Company Overview
- 15.1.8.2. Products
- 15.1.8.3. Company Financials
- 15.1.8.4. SWOT Analysis
- 15.1.1 Tidewater Inc
- 15.2. Market Entropy
- 15.2.1 Company's Key Areas Served
- 15.2.2 Recent Developments
- 15.3. Company Market Share Analysis 2025
- 15.3.1 Top 5 Companies Market Share Analysis
- 15.3.2 Top 3 Companies Market Share Analysis
- 15.4. List of Potential Customers
- 16. Research Methodology
List of Figures
- Figure 1: Global APAC Offshore Support Market Revenue Breakdown (billion, %) by Region 2025 & 2033
- Figure 2: China APAC Offshore Support Market Revenue (billion), by Production Analysis 2025 & 2033
- Figure 3: China APAC Offshore Support Market Revenue Share (%), by Production Analysis 2025 & 2033
- Figure 4: China APAC Offshore Support Market Revenue (billion), by Consumption Analysis 2025 & 2033
- Figure 5: China APAC Offshore Support Market Revenue Share (%), by Consumption Analysis 2025 & 2033
- Figure 6: China APAC Offshore Support Market Revenue (billion), by Import Market Analysis (Value & Volume) 2025 & 2033
- Figure 7: China APAC Offshore Support Market Revenue Share (%), by Import Market Analysis (Value & Volume) 2025 & 2033
- Figure 8: China APAC Offshore Support Market Revenue (billion), by Export Market Analysis (Value & Volume) 2025 & 2033
- Figure 9: China APAC Offshore Support Market Revenue Share (%), by Export Market Analysis (Value & Volume) 2025 & 2033
- Figure 10: China APAC Offshore Support Market Revenue (billion), by Price Trend Analysis 2025 & 2033
- Figure 11: China APAC Offshore Support Market Revenue Share (%), by Price Trend Analysis 2025 & 2033
- Figure 12: China APAC Offshore Support Market Revenue (billion), by Country 2025 & 2033
- Figure 13: China APAC Offshore Support Market Revenue Share (%), by Country 2025 & 2033
- Figure 14: India APAC Offshore Support Market Revenue (billion), by Production Analysis 2025 & 2033
- Figure 15: India APAC Offshore Support Market Revenue Share (%), by Production Analysis 2025 & 2033
- Figure 16: India APAC Offshore Support Market Revenue (billion), by Consumption Analysis 2025 & 2033
- Figure 17: India APAC Offshore Support Market Revenue Share (%), by Consumption Analysis 2025 & 2033
- Figure 18: India APAC Offshore Support Market Revenue (billion), by Import Market Analysis (Value & Volume) 2025 & 2033
- Figure 19: India APAC Offshore Support Market Revenue Share (%), by Import Market Analysis (Value & Volume) 2025 & 2033
- Figure 20: India APAC Offshore Support Market Revenue (billion), by Export Market Analysis (Value & Volume) 2025 & 2033
- Figure 21: India APAC Offshore Support Market Revenue Share (%), by Export Market Analysis (Value & Volume) 2025 & 2033
- Figure 22: India APAC Offshore Support Market Revenue (billion), by Price Trend Analysis 2025 & 2033
- Figure 23: India APAC Offshore Support Market Revenue Share (%), by Price Trend Analysis 2025 & 2033
- Figure 24: India APAC Offshore Support Market Revenue (billion), by Country 2025 & 2033
- Figure 25: India APAC Offshore Support Market Revenue Share (%), by Country 2025 & 2033
- Figure 26: Japan APAC Offshore Support Market Revenue (billion), by Production Analysis 2025 & 2033
- Figure 27: Japan APAC Offshore Support Market Revenue Share (%), by Production Analysis 2025 & 2033
- Figure 28: Japan APAC Offshore Support Market Revenue (billion), by Consumption Analysis 2025 & 2033
- Figure 29: Japan APAC Offshore Support Market Revenue Share (%), by Consumption Analysis 2025 & 2033
- Figure 30: Japan APAC Offshore Support Market Revenue (billion), by Import Market Analysis (Value & Volume) 2025 & 2033
- Figure 31: Japan APAC Offshore Support Market Revenue Share (%), by Import Market Analysis (Value & Volume) 2025 & 2033
- Figure 32: Japan APAC Offshore Support Market Revenue (billion), by Export Market Analysis (Value & Volume) 2025 & 2033
- Figure 33: Japan APAC Offshore Support Market Revenue Share (%), by Export Market Analysis (Value & Volume) 2025 & 2033
- Figure 34: Japan APAC Offshore Support Market Revenue (billion), by Price Trend Analysis 2025 & 2033
- Figure 35: Japan APAC Offshore Support Market Revenue Share (%), by Price Trend Analysis 2025 & 2033
- Figure 36: Japan APAC Offshore Support Market Revenue (billion), by Country 2025 & 2033
- Figure 37: Japan APAC Offshore Support Market Revenue Share (%), by Country 2025 & 2033
- Figure 38: South Korea APAC Offshore Support Market Revenue (billion), by Production Analysis 2025 & 2033
- Figure 39: South Korea APAC Offshore Support Market Revenue Share (%), by Production Analysis 2025 & 2033
- Figure 40: South Korea APAC Offshore Support Market Revenue (billion), by Consumption Analysis 2025 & 2033
- Figure 41: South Korea APAC Offshore Support Market Revenue Share (%), by Consumption Analysis 2025 & 2033
- Figure 42: South Korea APAC Offshore Support Market Revenue (billion), by Import Market Analysis (Value & Volume) 2025 & 2033
- Figure 43: South Korea APAC Offshore Support Market Revenue Share (%), by Import Market Analysis (Value & Volume) 2025 & 2033
- Figure 44: South Korea APAC Offshore Support Market Revenue (billion), by Export Market Analysis (Value & Volume) 2025 & 2033
- Figure 45: South Korea APAC Offshore Support Market Revenue Share (%), by Export Market Analysis (Value & Volume) 2025 & 2033
- Figure 46: South Korea APAC Offshore Support Market Revenue (billion), by Price Trend Analysis 2025 & 2033
- Figure 47: South Korea APAC Offshore Support Market Revenue Share (%), by Price Trend Analysis 2025 & 2033
- Figure 48: South Korea APAC Offshore Support Market Revenue (billion), by Country 2025 & 2033
- Figure 49: South Korea APAC Offshore Support Market Revenue Share (%), by Country 2025 & 2033
- Figure 50: Australia APAC Offshore Support Market Revenue (billion), by Production Analysis 2025 & 2033
- Figure 51: Australia APAC Offshore Support Market Revenue Share (%), by Production Analysis 2025 & 2033
- Figure 52: Australia APAC Offshore Support Market Revenue (billion), by Consumption Analysis 2025 & 2033
- Figure 53: Australia APAC Offshore Support Market Revenue Share (%), by Consumption Analysis 2025 & 2033
- Figure 54: Australia APAC Offshore Support Market Revenue (billion), by Import Market Analysis (Value & Volume) 2025 & 2033
- Figure 55: Australia APAC Offshore Support Market Revenue Share (%), by Import Market Analysis (Value & Volume) 2025 & 2033
- Figure 56: Australia APAC Offshore Support Market Revenue (billion), by Export Market Analysis (Value & Volume) 2025 & 2033
- Figure 57: Australia APAC Offshore Support Market Revenue Share (%), by Export Market Analysis (Value & Volume) 2025 & 2033
- Figure 58: Australia APAC Offshore Support Market Revenue (billion), by Price Trend Analysis 2025 & 2033
- Figure 59: Australia APAC Offshore Support Market Revenue Share (%), by Price Trend Analysis 2025 & 2033
- Figure 60: Australia APAC Offshore Support Market Revenue (billion), by Country 2025 & 2033
- Figure 61: Australia APAC Offshore Support Market Revenue Share (%), by Country 2025 & 2033
- Figure 62: Singapore APAC Offshore Support Market Revenue (billion), by Production Analysis 2025 & 2033
- Figure 63: Singapore APAC Offshore Support Market Revenue Share (%), by Production Analysis 2025 & 2033
- Figure 64: Singapore APAC Offshore Support Market Revenue (billion), by Consumption Analysis 2025 & 2033
- Figure 65: Singapore APAC Offshore Support Market Revenue Share (%), by Consumption Analysis 2025 & 2033
- Figure 66: Singapore APAC Offshore Support Market Revenue (billion), by Import Market Analysis (Value & Volume) 2025 & 2033
- Figure 67: Singapore APAC Offshore Support Market Revenue Share (%), by Import Market Analysis (Value & Volume) 2025 & 2033
- Figure 68: Singapore APAC Offshore Support Market Revenue (billion), by Export Market Analysis (Value & Volume) 2025 & 2033
- Figure 69: Singapore APAC Offshore Support Market Revenue Share (%), by Export Market Analysis (Value & Volume) 2025 & 2033
- Figure 70: Singapore APAC Offshore Support Market Revenue (billion), by Price Trend Analysis 2025 & 2033
- Figure 71: Singapore APAC Offshore Support Market Revenue Share (%), by Price Trend Analysis 2025 & 2033
- Figure 72: Singapore APAC Offshore Support Market Revenue (billion), by Country 2025 & 2033
- Figure 73: Singapore APAC Offshore Support Market Revenue Share (%), by Country 2025 & 2033
- Figure 74: Indonesia APAC Offshore Support Market Revenue (billion), by Production Analysis 2025 & 2033
- Figure 75: Indonesia APAC Offshore Support Market Revenue Share (%), by Production Analysis 2025 & 2033
- Figure 76: Indonesia APAC Offshore Support Market Revenue (billion), by Consumption Analysis 2025 & 2033
- Figure 77: Indonesia APAC Offshore Support Market Revenue Share (%), by Consumption Analysis 2025 & 2033
- Figure 78: Indonesia APAC Offshore Support Market Revenue (billion), by Import Market Analysis (Value & Volume) 2025 & 2033
- Figure 79: Indonesia APAC Offshore Support Market Revenue Share (%), by Import Market Analysis (Value & Volume) 2025 & 2033
- Figure 80: Indonesia APAC Offshore Support Market Revenue (billion), by Export Market Analysis (Value & Volume) 2025 & 2033
- Figure 81: Indonesia APAC Offshore Support Market Revenue Share (%), by Export Market Analysis (Value & Volume) 2025 & 2033
- Figure 82: Indonesia APAC Offshore Support Market Revenue (billion), by Price Trend Analysis 2025 & 2033
- Figure 83: Indonesia APAC Offshore Support Market Revenue Share (%), by Price Trend Analysis 2025 & 2033
- Figure 84: Indonesia APAC Offshore Support Market Revenue (billion), by Country 2025 & 2033
- Figure 85: Indonesia APAC Offshore Support Market Revenue Share (%), by Country 2025 & 2033
- Figure 86: Rest of Asia Pacific APAC Offshore Support Market Revenue (billion), by Production Analysis 2025 & 2033
- Figure 87: Rest of Asia Pacific APAC Offshore Support Market Revenue Share (%), by Production Analysis 2025 & 2033
- Figure 88: Rest of Asia Pacific APAC Offshore Support Market Revenue (billion), by Consumption Analysis 2025 & 2033
- Figure 89: Rest of Asia Pacific APAC Offshore Support Market Revenue Share (%), by Consumption Analysis 2025 & 2033
- Figure 90: Rest of Asia Pacific APAC Offshore Support Market Revenue (billion), by Import Market Analysis (Value & Volume) 2025 & 2033
- Figure 91: Rest of Asia Pacific APAC Offshore Support Market Revenue Share (%), by Import Market Analysis (Value & Volume) 2025 & 2033
- Figure 92: Rest of Asia Pacific APAC Offshore Support Market Revenue (billion), by Export Market Analysis (Value & Volume) 2025 & 2033
- Figure 93: Rest of Asia Pacific APAC Offshore Support Market Revenue Share (%), by Export Market Analysis (Value & Volume) 2025 & 2033
- Figure 94: Rest of Asia Pacific APAC Offshore Support Market Revenue (billion), by Price Trend Analysis 2025 & 2033
- Figure 95: Rest of Asia Pacific APAC Offshore Support Market Revenue Share (%), by Price Trend Analysis 2025 & 2033
- Figure 96: Rest of Asia Pacific APAC Offshore Support Market Revenue (billion), by Country 2025 & 2033
- Figure 97: Rest of Asia Pacific APAC Offshore Support Market Revenue Share (%), by Country 2025 & 2033
List of Tables
- Table 1: Global APAC Offshore Support Market Revenue billion Forecast, by Production Analysis 2020 & 2033
- Table 2: Global APAC Offshore Support Market Revenue billion Forecast, by Consumption Analysis 2020 & 2033
- Table 3: Global APAC Offshore Support Market Revenue billion Forecast, by Import Market Analysis (Value & Volume) 2020 & 2033
- Table 4: Global APAC Offshore Support Market Revenue billion Forecast, by Export Market Analysis (Value & Volume) 2020 & 2033
- Table 5: Global APAC Offshore Support Market Revenue billion Forecast, by Price Trend Analysis 2020 & 2033
- Table 6: Global APAC Offshore Support Market Revenue billion Forecast, by Region 2020 & 2033
- Table 7: Global APAC Offshore Support Market Revenue billion Forecast, by Production Analysis 2020 & 2033
- Table 8: Global APAC Offshore Support Market Revenue billion Forecast, by Consumption Analysis 2020 & 2033
- Table 9: Global APAC Offshore Support Market Revenue billion Forecast, by Import Market Analysis (Value & Volume) 2020 & 2033
- Table 10: Global APAC Offshore Support Market Revenue billion Forecast, by Export Market Analysis (Value & Volume) 2020 & 2033
- Table 11: Global APAC Offshore Support Market Revenue billion Forecast, by Price Trend Analysis 2020 & 2033
- Table 12: Global APAC Offshore Support Market Revenue billion Forecast, by Country 2020 & 2033
- Table 13: Global APAC Offshore Support Market Revenue billion Forecast, by Production Analysis 2020 & 2033
- Table 14: Global APAC Offshore Support Market Revenue billion Forecast, by Consumption Analysis 2020 & 2033
- Table 15: Global APAC Offshore Support Market Revenue billion Forecast, by Import Market Analysis (Value & Volume) 2020 & 2033
- Table 16: Global APAC Offshore Support Market Revenue billion Forecast, by Export Market Analysis (Value & Volume) 2020 & 2033
- Table 17: Global APAC Offshore Support Market Revenue billion Forecast, by Price Trend Analysis 2020 & 2033
- Table 18: Global APAC Offshore Support Market Revenue billion Forecast, by Country 2020 & 2033
- Table 19: Global APAC Offshore Support Market Revenue billion Forecast, by Production Analysis 2020 & 2033
- Table 20: Global APAC Offshore Support Market Revenue billion Forecast, by Consumption Analysis 2020 & 2033
- Table 21: Global APAC Offshore Support Market Revenue billion Forecast, by Import Market Analysis (Value & Volume) 2020 & 2033
- Table 22: Global APAC Offshore Support Market Revenue billion Forecast, by Export Market Analysis (Value & Volume) 2020 & 2033
- Table 23: Global APAC Offshore Support Market Revenue billion Forecast, by Price Trend Analysis 2020 & 2033
- Table 24: Global APAC Offshore Support Market Revenue billion Forecast, by Country 2020 & 2033
- Table 25: Global APAC Offshore Support Market Revenue billion Forecast, by Production Analysis 2020 & 2033
- Table 26: Global APAC Offshore Support Market Revenue billion Forecast, by Consumption Analysis 2020 & 2033
- Table 27: Global APAC Offshore Support Market Revenue billion Forecast, by Import Market Analysis (Value & Volume) 2020 & 2033
- Table 28: Global APAC Offshore Support Market Revenue billion Forecast, by Export Market Analysis (Value & Volume) 2020 & 2033
- Table 29: Global APAC Offshore Support Market Revenue billion Forecast, by Price Trend Analysis 2020 & 2033
- Table 30: Global APAC Offshore Support Market Revenue billion Forecast, by Country 2020 & 2033
- Table 31: Global APAC Offshore Support Market Revenue billion Forecast, by Production Analysis 2020 & 2033
- Table 32: Global APAC Offshore Support Market Revenue billion Forecast, by Consumption Analysis 2020 & 2033
- Table 33: Global APAC Offshore Support Market Revenue billion Forecast, by Import Market Analysis (Value & Volume) 2020 & 2033
- Table 34: Global APAC Offshore Support Market Revenue billion Forecast, by Export Market Analysis (Value & Volume) 2020 & 2033
- Table 35: Global APAC Offshore Support Market Revenue billion Forecast, by Price Trend Analysis 2020 & 2033
- Table 36: Global APAC Offshore Support Market Revenue billion Forecast, by Country 2020 & 2033
- Table 37: Global APAC Offshore Support Market Revenue billion Forecast, by Production Analysis 2020 & 2033
- Table 38: Global APAC Offshore Support Market Revenue billion Forecast, by Consumption Analysis 2020 & 2033
- Table 39: Global APAC Offshore Support Market Revenue billion Forecast, by Import Market Analysis (Value & Volume) 2020 & 2033
- Table 40: Global APAC Offshore Support Market Revenue billion Forecast, by Export Market Analysis (Value & Volume) 2020 & 2033
- Table 41: Global APAC Offshore Support Market Revenue billion Forecast, by Price Trend Analysis 2020 & 2033
- Table 42: Global APAC Offshore Support Market Revenue billion Forecast, by Country 2020 & 2033
- Table 43: Global APAC Offshore Support Market Revenue billion Forecast, by Production Analysis 2020 & 2033
- Table 44: Global APAC Offshore Support Market Revenue billion Forecast, by Consumption Analysis 2020 & 2033
- Table 45: Global APAC Offshore Support Market Revenue billion Forecast, by Import Market Analysis (Value & Volume) 2020 & 2033
- Table 46: Global APAC Offshore Support Market Revenue billion Forecast, by Export Market Analysis (Value & Volume) 2020 & 2033
- Table 47: Global APAC Offshore Support Market Revenue billion Forecast, by Price Trend Analysis 2020 & 2033
- Table 48: Global APAC Offshore Support Market Revenue billion Forecast, by Country 2020 & 2033
- Table 49: Global APAC Offshore Support Market Revenue billion Forecast, by Production Analysis 2020 & 2033
- Table 50: Global APAC Offshore Support Market Revenue billion Forecast, by Consumption Analysis 2020 & 2033
- Table 51: Global APAC Offshore Support Market Revenue billion Forecast, by Import Market Analysis (Value & Volume) 2020 & 2033
- Table 52: Global APAC Offshore Support Market Revenue billion Forecast, by Export Market Analysis (Value & Volume) 2020 & 2033
- Table 53: Global APAC Offshore Support Market Revenue billion Forecast, by Price Trend Analysis 2020 & 2033
- Table 54: Global APAC Offshore Support Market Revenue billion Forecast, by Country 2020 & 2033
Frequently Asked Questions
1. What is the projected Compound Annual Growth Rate (CAGR) of the APAC Offshore Support Market?
The projected CAGR is approximately 4.2%.
2. Which companies are prominent players in the APAC Offshore Support Market?
Key companies in the market include Tidewater Inc, PACC Offshore Services Holdings Ltd, Kawasaki Kisen Kaisha Ltd*List Not Exhaustive, Solstad Offshore ASA, MMA Offshore Limited, Seacor Marine Holdings Inc, Nam Cheong Offshore Pte Ltd, Maersk Supply Services AS.
3. What are the main segments of the APAC Offshore Support Market?
The market segments include Production Analysis, Consumption Analysis, Import Market Analysis (Value & Volume), Export Market Analysis (Value & Volume), Price Trend Analysis.
4. Can you provide details about the market size?
The market size is estimated to be USD 25.5 billion as of 2022.
5. What are some drivers contributing to market growth?
4.; Increasing Offshore Exploration and Production Activities4.; Development of Offshore Wind Energy.
6. What are the notable trends driving market growth?
Anchor Handling Tug/Anchor Handling Towing Supply (AHT/AHTS) Vessels to Dominate the Market.
7. Are there any restraints impacting market growth?
4.; Rising Demand for Dynamic Positioning (DP) Drilling Rigs.
8. Can you provide examples of recent developments in the market?
In January 2022, TSS Pioneer, an offshore support vessel built by Vard at the Vung Tau shipyard in Vietnam, completed sea trials offshore Vietnam. The vessel will be delivered to Ta Shang Marine, a joint company owned by Mitsui O.S.K. Lines and Ta Tong Marine.
9. What pricing options are available for accessing the report?
Pricing options include single-user, multi-user, and enterprise licenses priced at USD 4750, USD 5250, and USD 8750 respectively.
10. Is the market size provided in terms of value or volume?
The market size is provided in terms of value, measured in billion.
11. Are there any specific market keywords associated with the report?
Yes, the market keyword associated with the report is "APAC Offshore Support Market," which aids in identifying and referencing the specific market segment covered.
12. How do I determine which pricing option suits my needs best?
The pricing options vary based on user requirements and access needs. Individual users may opt for single-user licenses, while businesses requiring broader access may choose multi-user or enterprise licenses for cost-effective access to the report.
13. Are there any additional resources or data provided in the APAC Offshore Support Market report?
While the report offers comprehensive insights, it's advisable to review the specific contents or supplementary materials provided to ascertain if additional resources or data are available.
14. How can I stay updated on further developments or reports in the APAC Offshore Support Market?
To stay informed about further developments, trends, and reports in the APAC Offshore Support Market, consider subscribing to industry newsletters, following relevant companies and organizations, or regularly checking reputable industry news sources and publications.
Methodology
Step 1 - Identification of Relevant Samples Size from Population Database


Step 2 - Approaches for Defining Global Market Size (Value, Volume* & Price*)

Note*: In applicable scenarios
Step 3 - Data Sources
Primary Research
- Web Analytics
- Survey Reports
- Research Institute
- Latest Research Reports
- Opinion Leaders
Secondary Research
- Annual Reports
- White Paper
- Latest Press Release
- Industry Association
- Paid Database
- Investor Presentations

Step 4 - Data Triangulation
Involves using different sources of information in order to increase the validity of a study
These sources are likely to be stakeholders in a program - participants, other researchers, program staff, other community members, and so on.
Then we put all data in single framework & apply various statistical tools to find out the dynamic on the market.
During the analysis stage, feedback from the stakeholder groups would be compared to determine areas of agreement as well as areas of divergence