

Key Insights
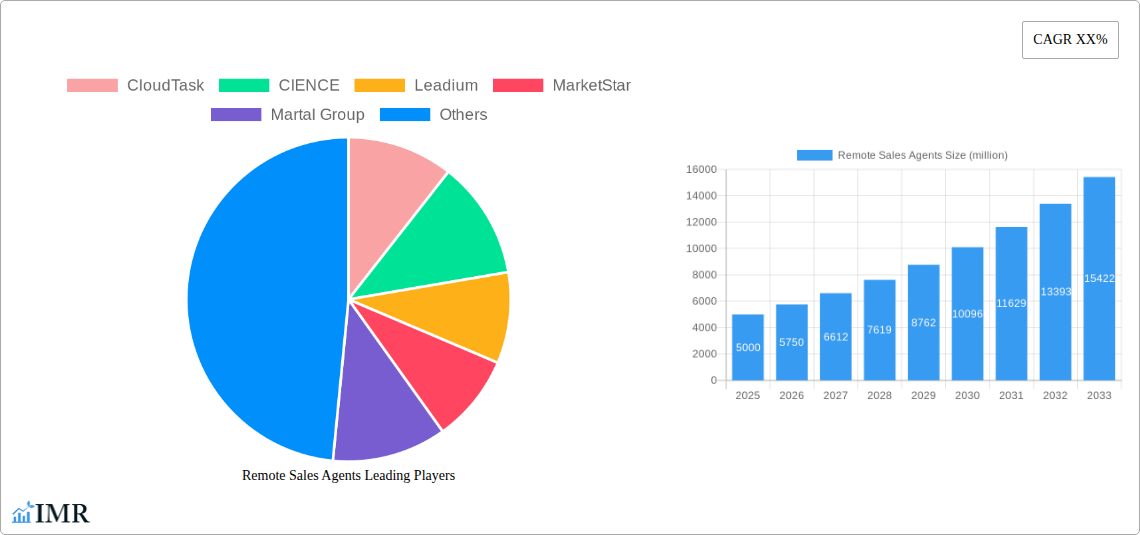
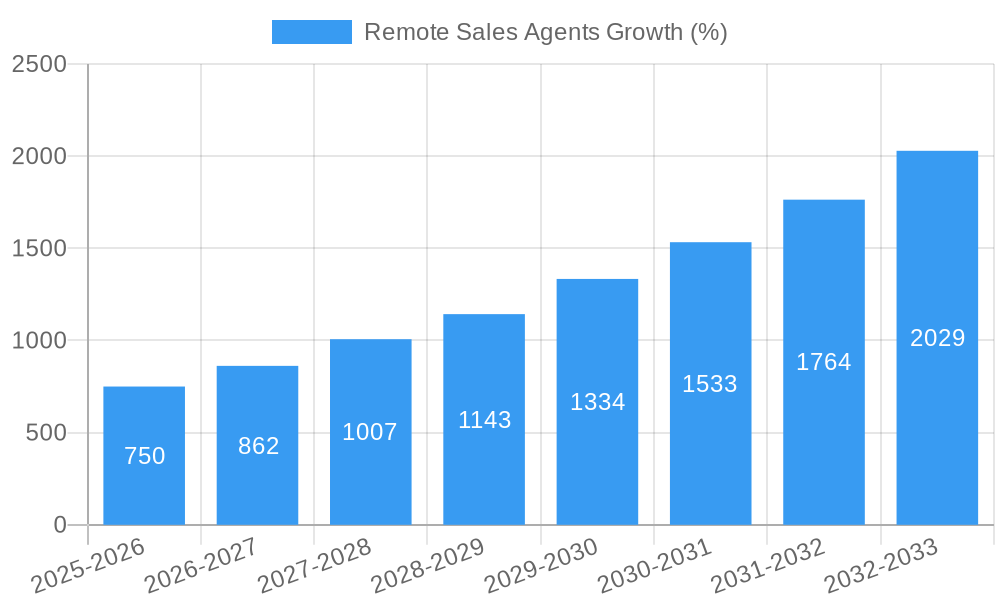
The remote sales agent market is experiencing significant growth, driven by the increasing adoption of remote work models, advancements in sales technology, and the need for businesses to reach wider customer bases cost-effectively. The market's expansion is fueled by several key factors. Firstly, the flexibility and scalability offered by remote sales agents allow companies to adjust their sales force rapidly according to fluctuating demand. Secondly, the cost savings associated with reduced overhead expenses, such as office space and utilities, are highly attractive to businesses of all sizes. Technological advancements, particularly in CRM software, communication tools, and sales automation platforms, have significantly improved the efficiency and productivity of remote sales agents, further boosting market growth. While the initial investment in technology and training can be a barrier to entry for some companies, the long-term benefits often outweigh the initial costs. Competitive pressures and the need to optimize sales operations are also driving market adoption. We estimate the current market size (2025) at $5 billion, growing at a compound annual growth rate (CAGR) of 15% between 2025 and 2033, reaching a projected value of approximately $16 billion by 2033. This prediction is based on observed growth trends in related sectors, such as remote work and SaaS adoption.
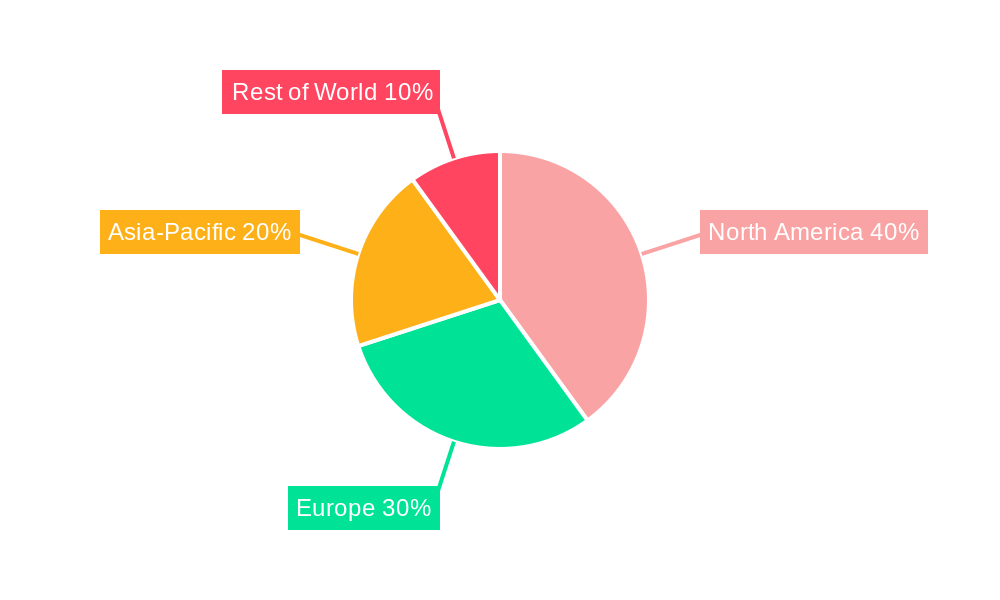
However, the market is not without its challenges. Maintaining consistent sales performance and team cohesion across geographically dispersed teams requires robust management strategies and strong communication infrastructure. Data security and compliance concerns also necessitate careful consideration and investment in secure systems. Competition among established players and new entrants is intense, necessitating continuous innovation and adaptation to changing market dynamics. Successfully navigating these hurdles will require a focus on training, technological integration, and a strong commitment to quality control. The market segmentation includes various industry verticals leveraging remote sales agents, impacting revenue generation and scaling projections. Geographic variations in regulatory frameworks and market penetration further influence growth trajectory across different regions, which includes North America, Europe, Asia-Pacific, and others. A comprehensive strategy addressing these challenges and opportunities will be crucial for market players to achieve sustainable growth and success in this dynamic landscape.
Remote Sales Agents Market Report: 2019-2033
This comprehensive report provides an in-depth analysis of the Remote Sales Agents market, projecting robust growth from 2025 to 2033. We examine market dynamics, growth trends, key players, and emerging opportunities across various segments and geographies. This report is an indispensable resource for industry professionals, investors, and strategic decision-makers seeking to navigate this rapidly evolving landscape. The study period covers 2019-2033, with 2025 as the base and estimated year. The forecast period spans 2025-2033, and the historical period is 2019-2024.
Parent Market: Business Process Outsourcing (BPO) Child Market: Sales Outsourcing
Remote Sales Agents Market Dynamics & Structure
The Remote Sales Agents market is experiencing significant growth driven by technological advancements, changing consumer behavior, and a global shift towards remote work models. Market concentration is currently moderate, with several key players holding substantial shares, but a fragmented landscape also exists with numerous smaller firms competing for market share. Technological innovation, particularly in CRM software and sales automation tools, is a major driver, while regulatory frameworks concerning data privacy and compliance continue to shape market practices. The industry also faces competitive pressures from alternative sales strategies and a constant need to adapt to evolving customer expectations. M&A activity has been relatively steady (xx deals in 2024), driven by a desire for expansion and the acquisition of specialized technologies.
- Market Concentration: Moderately concentrated, with top 5 players holding xx% market share in 2024.
- Technological Drivers: AI-powered sales tools, CRM integration, automation platforms.
- Regulatory Factors: GDPR, CCPA, and other data privacy regulations.
- Competitive Substitutes: In-house sales teams, traditional telemarketing.
- End-User Demographics: Increasingly diverse, spanning various industries and company sizes.
- M&A Trends: Steady consolidation with xx million USD invested in M&A in 2024.
Remote Sales Agents Growth Trends & Insights
The Remote Sales Agents market exhibited a CAGR of xx% during the historical period (2019-2024), reaching a market size of xx million USD in 2024. This growth is expected to continue, with a projected CAGR of xx% during the forecast period (2025-2033), driven by increasing adoption of remote work practices, the rising demand for cost-effective sales solutions, and ongoing technological advancements. Market penetration is currently at xx%, with significant growth potential remaining, particularly in emerging markets. Consumer behavior shifts towards digital engagement and personalized experiences are also contributing to market growth. Technological disruptions are reshaping the market landscape, creating new opportunities for companies that embrace innovation and adapt quickly to changing demands.
Dominant Regions, Countries, or Segments in Remote Sales Agents
North America currently holds the largest market share in the Remote Sales Agents market, followed by Europe and Asia-Pacific. This dominance is largely attributed to the high adoption of remote work strategies, robust technological infrastructure, and the presence of major market players in these regions. However, rapid growth is anticipated in Asia-Pacific, driven by increasing internet penetration, favorable economic policies, and a growing base of businesses adopting outsourced sales solutions.
- North America: High adoption rates, strong technological infrastructure, established market players.
- Europe: Steady growth, driven by increasing demand for cost-effective sales solutions.
- Asia-Pacific: Rapid expansion, fueled by growing internet penetration and favorable economic conditions.
- Key Drivers: Government initiatives promoting digitalization, investment in technology infrastructure.
Remote Sales Agents Product Landscape
The Remote Sales Agents market offers a diverse range of services, including lead generation, appointment setting, sales development, and inside sales support. Product innovations are focused on improving efficiency, increasing conversion rates, and enhancing customer experience through AI-powered tools, advanced analytics, and personalized communication strategies. Unique selling propositions frequently center around specialized industry knowledge, advanced technology integrations, and performance-based pricing models. Key performance indicators include conversion rates, lead qualification scores, and customer satisfaction metrics.
Key Drivers, Barriers & Challenges in Remote Sales Agents
Key Drivers:
- Increasing demand for cost-effective sales solutions.
- Growing adoption of remote work models globally.
- Technological advancements in sales automation and CRM.
Key Challenges & Restraints:
- Data security and privacy concerns.
- Maintaining consistent sales team quality and training.
- Competitive pricing pressures and maintaining profit margins. This translates to approximately a xx million USD loss in potential revenue yearly for the market.
Emerging Opportunities in Remote Sales Agents
Emerging opportunities lie in specialized niches within the market, focusing on servicing specific industry verticals with tailored solutions. Furthermore, integrating emerging technologies such as AI-powered chatbots and predictive analytics offers potential to significantly enhance sales efficiency and customer engagement. Expanding into untapped markets in developing economies presents further growth opportunities.
Growth Accelerators in the Remote Sales Agents Industry
Strategic partnerships between technology providers and Remote Sales Agents companies are key growth accelerators, enabling access to advanced technologies and broader market reach. Continuous investment in employee training and upskilling to improve sales skills and maintain a high-quality workforce is also crucial for long-term success.
Key Players Shaping the Remote Sales Agents Market
- CloudTask
- CIENCE
- Leadium
- MarketStar
- Martal Group
- Acquirent
- AOB India
- Bandalier
- CPM International
- demandDrive
- durhamlane
- EBQ
- Flockjay
- FullFunnel
- Jinactus Consulting
- JumpCrew
- Lease A Sales Rep
- Marconix Sales and Marketing Private Limited
- MarketSource
- N3
- Operatix
- Sales Outsourcing Pros
- Saletancy Consulting Private
- The Vanella Group
- Top Hawks
- ZingPro Consulting
Notable Milestones in Remote Sales Agents Sector
- 2021-Q3: Increased investment in AI-powered sales tools by several major players.
- 2022-Q1: Launch of several new CRM integrations by leading Remote Sales Agents providers.
- 2023-Q2: Significant M&A activity within the sector leading to market consolidation.
In-Depth Remote Sales Agents Market Outlook
The Remote Sales Agents market is poised for continued strong growth, driven by accelerating technological advancements and the ongoing shift towards remote work models. Strategic partnerships, investment in employee training, and expansion into new markets will be critical success factors for companies in this sector. The market's future potential is significant, with ample opportunities for innovation and expansion across various regions and industries.
Remote Sales Agents Segmentation
-
1. Application
- 1.1. Large Enterprises
- 1.2. SMEs
-
2. Types
- 2.1. Outside Sales
- 2.2. Inside Sales
Remote Sales Agents Segmentation By Geography
-
1. North America
- 1.1. United States
- 1.2. Canada
- 1.3. Mexico
-
2. South America
- 2.1. Brazil
- 2.2. Argentina
- 2.3. Rest of South America
-
3. Europe
- 3.1. United Kingdom
- 3.2. Germany
- 3.3. France
- 3.4. Italy
- 3.5. Spain
- 3.6. Russia
- 3.7. Benelux
- 3.8. Nordics
- 3.9. Rest of Europe
-
4. Middle East & Africa
- 4.1. Turkey
- 4.2. Israel
- 4.3. GCC
- 4.4. North Africa
- 4.5. South Africa
- 4.6. Rest of Middle East & Africa
-
5. Asia Pacific
- 5.1. China
- 5.2. India
- 5.3. Japan
- 5.4. South Korea
- 5.5. ASEAN
- 5.6. Oceania
- 5.7. Rest of Asia Pacific
Remote Sales Agents REPORT HIGHLIGHTS
| Aspects | Details |
|---|---|
| Study Period | 2019-2033 |
| Base Year | 2024 |
| Estimated Year | 2025 |
| Forecast Period | 2025-2033 |
| Historical Period | 2019-2024 |
| Growth Rate | CAGR of XX% from 2019-2033 |
| Segmentation |
|
Table of Contents
- 1. Introduction
- 1.1. Research Scope
- 1.2. Market Segmentation
- 1.3. Research Methodology
- 1.4. Definitions and Assumptions
- 2. Executive Summary
- 2.1. Introduction
- 3. Market Dynamics
- 3.1. Introduction
- 3.2. Market Drivers
- 3.3. Market Restrains
- 3.4. Market Trends
- 4. Market Factor Analysis
- 4.1. Porters Five Forces
- 4.2. Supply/Value Chain
- 4.3. PESTEL analysis
- 4.4. Market Entropy
- 4.5. Patent/Trademark Analysis
- 5. Global Remote Sales Agents Analysis, Insights and Forecast, 2019-2031
- 5.1. Market Analysis, Insights and Forecast - by Application
- 5.1.1. Large Enterprises
- 5.1.2. SMEs
- 5.2. Market Analysis, Insights and Forecast - by Types
- 5.2.1. Outside Sales
- 5.2.2. Inside Sales
- 5.3. Market Analysis, Insights and Forecast - by Region
- 5.3.1. North America
- 5.3.2. South America
- 5.3.3. Europe
- 5.3.4. Middle East & Africa
- 5.3.5. Asia Pacific
- 5.1. Market Analysis, Insights and Forecast - by Application
- 6. North America Remote Sales Agents Analysis, Insights and Forecast, 2019-2031
- 6.1. Market Analysis, Insights and Forecast - by Application
- 6.1.1. Large Enterprises
- 6.1.2. SMEs
- 6.2. Market Analysis, Insights and Forecast - by Types
- 6.2.1. Outside Sales
- 6.2.2. Inside Sales
- 6.1. Market Analysis, Insights and Forecast - by Application
- 7. South America Remote Sales Agents Analysis, Insights and Forecast, 2019-2031
- 7.1. Market Analysis, Insights and Forecast - by Application
- 7.1.1. Large Enterprises
- 7.1.2. SMEs
- 7.2. Market Analysis, Insights and Forecast - by Types
- 7.2.1. Outside Sales
- 7.2.2. Inside Sales
- 7.1. Market Analysis, Insights and Forecast - by Application
- 8. Europe Remote Sales Agents Analysis, Insights and Forecast, 2019-2031
- 8.1. Market Analysis, Insights and Forecast - by Application
- 8.1.1. Large Enterprises
- 8.1.2. SMEs
- 8.2. Market Analysis, Insights and Forecast - by Types
- 8.2.1. Outside Sales
- 8.2.2. Inside Sales
- 8.1. Market Analysis, Insights and Forecast - by Application
- 9. Middle East & Africa Remote Sales Agents Analysis, Insights and Forecast, 2019-2031
- 9.1. Market Analysis, Insights and Forecast - by Application
- 9.1.1. Large Enterprises
- 9.1.2. SMEs
- 9.2. Market Analysis, Insights and Forecast - by Types
- 9.2.1. Outside Sales
- 9.2.2. Inside Sales
- 9.1. Market Analysis, Insights and Forecast - by Application
- 10. Asia Pacific Remote Sales Agents Analysis, Insights and Forecast, 2019-2031
- 10.1. Market Analysis, Insights and Forecast - by Application
- 10.1.1. Large Enterprises
- 10.1.2. SMEs
- 10.2. Market Analysis, Insights and Forecast - by Types
- 10.2.1. Outside Sales
- 10.2.2. Inside Sales
- 10.1. Market Analysis, Insights and Forecast - by Application
- 11. Competitive Analysis
- 11.1. Global Market Share Analysis 2024
- 11.2. Company Profiles
- 11.2.1 CloudTask
- 11.2.1.1. Overview
- 11.2.1.2. Products
- 11.2.1.3. SWOT Analysis
- 11.2.1.4. Recent Developments
- 11.2.1.5. Financials (Based on Availability)
- 11.2.2 CIENCE
- 11.2.2.1. Overview
- 11.2.2.2. Products
- 11.2.2.3. SWOT Analysis
- 11.2.2.4. Recent Developments
- 11.2.2.5. Financials (Based on Availability)
- 11.2.3 Leadium
- 11.2.3.1. Overview
- 11.2.3.2. Products
- 11.2.3.3. SWOT Analysis
- 11.2.3.4. Recent Developments
- 11.2.3.5. Financials (Based on Availability)
- 11.2.4 MarketStar
- 11.2.4.1. Overview
- 11.2.4.2. Products
- 11.2.4.3. SWOT Analysis
- 11.2.4.4. Recent Developments
- 11.2.4.5. Financials (Based on Availability)
- 11.2.5 Martal Group
- 11.2.5.1. Overview
- 11.2.5.2. Products
- 11.2.5.3. SWOT Analysis
- 11.2.5.4. Recent Developments
- 11.2.5.5. Financials (Based on Availability)
- 11.2.6 Acquirent
- 11.2.6.1. Overview
- 11.2.6.2. Products
- 11.2.6.3. SWOT Analysis
- 11.2.6.4. Recent Developments
- 11.2.6.5. Financials (Based on Availability)
- 11.2.7 AOB India
- 11.2.7.1. Overview
- 11.2.7.2. Products
- 11.2.7.3. SWOT Analysis
- 11.2.7.4. Recent Developments
- 11.2.7.5. Financials (Based on Availability)
- 11.2.8 Bandalier
- 11.2.8.1. Overview
- 11.2.8.2. Products
- 11.2.8.3. SWOT Analysis
- 11.2.8.4. Recent Developments
- 11.2.8.5. Financials (Based on Availability)
- 11.2.9 CPM International
- 11.2.9.1. Overview
- 11.2.9.2. Products
- 11.2.9.3. SWOT Analysis
- 11.2.9.4. Recent Developments
- 11.2.9.5. Financials (Based on Availability)
- 11.2.10 demandDrive
- 11.2.10.1. Overview
- 11.2.10.2. Products
- 11.2.10.3. SWOT Analysis
- 11.2.10.4. Recent Developments
- 11.2.10.5. Financials (Based on Availability)
- 11.2.11 durhamlane
- 11.2.11.1. Overview
- 11.2.11.2. Products
- 11.2.11.3. SWOT Analysis
- 11.2.11.4. Recent Developments
- 11.2.11.5. Financials (Based on Availability)
- 11.2.12 EBQ
- 11.2.12.1. Overview
- 11.2.12.2. Products
- 11.2.12.3. SWOT Analysis
- 11.2.12.4. Recent Developments
- 11.2.12.5. Financials (Based on Availability)
- 11.2.13 Flockjay
- 11.2.13.1. Overview
- 11.2.13.2. Products
- 11.2.13.3. SWOT Analysis
- 11.2.13.4. Recent Developments
- 11.2.13.5. Financials (Based on Availability)
- 11.2.14 FullFunnel
- 11.2.14.1. Overview
- 11.2.14.2. Products
- 11.2.14.3. SWOT Analysis
- 11.2.14.4. Recent Developments
- 11.2.14.5. Financials (Based on Availability)
- 11.2.15 Jinactus Consulting
- 11.2.15.1. Overview
- 11.2.15.2. Products
- 11.2.15.3. SWOT Analysis
- 11.2.15.4. Recent Developments
- 11.2.15.5. Financials (Based on Availability)
- 11.2.16 JumpCrew
- 11.2.16.1. Overview
- 11.2.16.2. Products
- 11.2.16.3. SWOT Analysis
- 11.2.16.4. Recent Developments
- 11.2.16.5. Financials (Based on Availability)
- 11.2.17 Lease A Sales Rep
- 11.2.17.1. Overview
- 11.2.17.2. Products
- 11.2.17.3. SWOT Analysis
- 11.2.17.4. Recent Developments
- 11.2.17.5. Financials (Based on Availability)
- 11.2.18 Marconix Sales and Marketing Private Limited
- 11.2.18.1. Overview
- 11.2.18.2. Products
- 11.2.18.3. SWOT Analysis
- 11.2.18.4. Recent Developments
- 11.2.18.5. Financials (Based on Availability)
- 11.2.19 MarketSource
- 11.2.19.1. Overview
- 11.2.19.2. Products
- 11.2.19.3. SWOT Analysis
- 11.2.19.4. Recent Developments
- 11.2.19.5. Financials (Based on Availability)
- 11.2.20 N3
- 11.2.20.1. Overview
- 11.2.20.2. Products
- 11.2.20.3. SWOT Analysis
- 11.2.20.4. Recent Developments
- 11.2.20.5. Financials (Based on Availability)
- 11.2.21 Operatix
- 11.2.21.1. Overview
- 11.2.21.2. Products
- 11.2.21.3. SWOT Analysis
- 11.2.21.4. Recent Developments
- 11.2.21.5. Financials (Based on Availability)
- 11.2.22 Sales Outsourcing Pros
- 11.2.22.1. Overview
- 11.2.22.2. Products
- 11.2.22.3. SWOT Analysis
- 11.2.22.4. Recent Developments
- 11.2.22.5. Financials (Based on Availability)
- 11.2.23 Saletancy Consulting Private
- 11.2.23.1. Overview
- 11.2.23.2. Products
- 11.2.23.3. SWOT Analysis
- 11.2.23.4. Recent Developments
- 11.2.23.5. Financials (Based on Availability)
- 11.2.24 The Vanella Group
- 11.2.24.1. Overview
- 11.2.24.2. Products
- 11.2.24.3. SWOT Analysis
- 11.2.24.4. Recent Developments
- 11.2.24.5. Financials (Based on Availability)
- 11.2.25 Top Hawks
- 11.2.25.1. Overview
- 11.2.25.2. Products
- 11.2.25.3. SWOT Analysis
- 11.2.25.4. Recent Developments
- 11.2.25.5. Financials (Based on Availability)
- 11.2.26 ZingPro Consulting
- 11.2.26.1. Overview
- 11.2.26.2. Products
- 11.2.26.3. SWOT Analysis
- 11.2.26.4. Recent Developments
- 11.2.26.5. Financials (Based on Availability)
- 11.2.1 CloudTask
List of Figures
- Figure 1: Global Remote Sales Agents Revenue Breakdown (million, %) by Region 2024 & 2032
- Figure 2: North America Remote Sales Agents Revenue (million), by Application 2024 & 2032
- Figure 3: North America Remote Sales Agents Revenue Share (%), by Application 2024 & 2032
- Figure 4: North America Remote Sales Agents Revenue (million), by Types 2024 & 2032
- Figure 5: North America Remote Sales Agents Revenue Share (%), by Types 2024 & 2032
- Figure 6: North America Remote Sales Agents Revenue (million), by Country 2024 & 2032
- Figure 7: North America Remote Sales Agents Revenue Share (%), by Country 2024 & 2032
- Figure 8: South America Remote Sales Agents Revenue (million), by Application 2024 & 2032
- Figure 9: South America Remote Sales Agents Revenue Share (%), by Application 2024 & 2032
- Figure 10: South America Remote Sales Agents Revenue (million), by Types 2024 & 2032
- Figure 11: South America Remote Sales Agents Revenue Share (%), by Types 2024 & 2032
- Figure 12: South America Remote Sales Agents Revenue (million), by Country 2024 & 2032
- Figure 13: South America Remote Sales Agents Revenue Share (%), by Country 2024 & 2032
- Figure 14: Europe Remote Sales Agents Revenue (million), by Application 2024 & 2032
- Figure 15: Europe Remote Sales Agents Revenue Share (%), by Application 2024 & 2032
- Figure 16: Europe Remote Sales Agents Revenue (million), by Types 2024 & 2032
- Figure 17: Europe Remote Sales Agents Revenue Share (%), by Types 2024 & 2032
- Figure 18: Europe Remote Sales Agents Revenue (million), by Country 2024 & 2032
- Figure 19: Europe Remote Sales Agents Revenue Share (%), by Country 2024 & 2032
- Figure 20: Middle East & Africa Remote Sales Agents Revenue (million), by Application 2024 & 2032
- Figure 21: Middle East & Africa Remote Sales Agents Revenue Share (%), by Application 2024 & 2032
- Figure 22: Middle East & Africa Remote Sales Agents Revenue (million), by Types 2024 & 2032
- Figure 23: Middle East & Africa Remote Sales Agents Revenue Share (%), by Types 2024 & 2032
- Figure 24: Middle East & Africa Remote Sales Agents Revenue (million), by Country 2024 & 2032
- Figure 25: Middle East & Africa Remote Sales Agents Revenue Share (%), by Country 2024 & 2032
- Figure 26: Asia Pacific Remote Sales Agents Revenue (million), by Application 2024 & 2032
- Figure 27: Asia Pacific Remote Sales Agents Revenue Share (%), by Application 2024 & 2032
- Figure 28: Asia Pacific Remote Sales Agents Revenue (million), by Types 2024 & 2032
- Figure 29: Asia Pacific Remote Sales Agents Revenue Share (%), by Types 2024 & 2032
- Figure 30: Asia Pacific Remote Sales Agents Revenue (million), by Country 2024 & 2032
- Figure 31: Asia Pacific Remote Sales Agents Revenue Share (%), by Country 2024 & 2032
List of Tables
- Table 1: Global Remote Sales Agents Revenue million Forecast, by Region 2019 & 2032
- Table 2: Global Remote Sales Agents Revenue million Forecast, by Application 2019 & 2032
- Table 3: Global Remote Sales Agents Revenue million Forecast, by Types 2019 & 2032
- Table 4: Global Remote Sales Agents Revenue million Forecast, by Region 2019 & 2032
- Table 5: Global Remote Sales Agents Revenue million Forecast, by Application 2019 & 2032
- Table 6: Global Remote Sales Agents Revenue million Forecast, by Types 2019 & 2032
- Table 7: Global Remote Sales Agents Revenue million Forecast, by Country 2019 & 2032
- Table 8: United States Remote Sales Agents Revenue (million) Forecast, by Application 2019 & 2032
- Table 9: Canada Remote Sales Agents Revenue (million) Forecast, by Application 2019 & 2032
- Table 10: Mexico Remote Sales Agents Revenue (million) Forecast, by Application 2019 & 2032
- Table 11: Global Remote Sales Agents Revenue million Forecast, by Application 2019 & 2032
- Table 12: Global Remote Sales Agents Revenue million Forecast, by Types 2019 & 2032
- Table 13: Global Remote Sales Agents Revenue million Forecast, by Country 2019 & 2032
- Table 14: Brazil Remote Sales Agents Revenue (million) Forecast, by Application 2019 & 2032
- Table 15: Argentina Remote Sales Agents Revenue (million) Forecast, by Application 2019 & 2032
- Table 16: Rest of South America Remote Sales Agents Revenue (million) Forecast, by Application 2019 & 2032
- Table 17: Global Remote Sales Agents Revenue million Forecast, by Application 2019 & 2032
- Table 18: Global Remote Sales Agents Revenue million Forecast, by Types 2019 & 2032
- Table 19: Global Remote Sales Agents Revenue million Forecast, by Country 2019 & 2032
- Table 20: United Kingdom Remote Sales Agents Revenue (million) Forecast, by Application 2019 & 2032
- Table 21: Germany Remote Sales Agents Revenue (million) Forecast, by Application 2019 & 2032
- Table 22: France Remote Sales Agents Revenue (million) Forecast, by Application 2019 & 2032
- Table 23: Italy Remote Sales Agents Revenue (million) Forecast, by Application 2019 & 2032
- Table 24: Spain Remote Sales Agents Revenue (million) Forecast, by Application 2019 & 2032
- Table 25: Russia Remote Sales Agents Revenue (million) Forecast, by Application 2019 & 2032
- Table 26: Benelux Remote Sales Agents Revenue (million) Forecast, by Application 2019 & 2032
- Table 27: Nordics Remote Sales Agents Revenue (million) Forecast, by Application 2019 & 2032
- Table 28: Rest of Europe Remote Sales Agents Revenue (million) Forecast, by Application 2019 & 2032
- Table 29: Global Remote Sales Agents Revenue million Forecast, by Application 2019 & 2032
- Table 30: Global Remote Sales Agents Revenue million Forecast, by Types 2019 & 2032
- Table 31: Global Remote Sales Agents Revenue million Forecast, by Country 2019 & 2032
- Table 32: Turkey Remote Sales Agents Revenue (million) Forecast, by Application 2019 & 2032
- Table 33: Israel Remote Sales Agents Revenue (million) Forecast, by Application 2019 & 2032
- Table 34: GCC Remote Sales Agents Revenue (million) Forecast, by Application 2019 & 2032
- Table 35: North Africa Remote Sales Agents Revenue (million) Forecast, by Application 2019 & 2032
- Table 36: South Africa Remote Sales Agents Revenue (million) Forecast, by Application 2019 & 2032
- Table 37: Rest of Middle East & Africa Remote Sales Agents Revenue (million) Forecast, by Application 2019 & 2032
- Table 38: Global Remote Sales Agents Revenue million Forecast, by Application 2019 & 2032
- Table 39: Global Remote Sales Agents Revenue million Forecast, by Types 2019 & 2032
- Table 40: Global Remote Sales Agents Revenue million Forecast, by Country 2019 & 2032
- Table 41: China Remote Sales Agents Revenue (million) Forecast, by Application 2019 & 2032
- Table 42: India Remote Sales Agents Revenue (million) Forecast, by Application 2019 & 2032
- Table 43: Japan Remote Sales Agents Revenue (million) Forecast, by Application 2019 & 2032
- Table 44: South Korea Remote Sales Agents Revenue (million) Forecast, by Application 2019 & 2032
- Table 45: ASEAN Remote Sales Agents Revenue (million) Forecast, by Application 2019 & 2032
- Table 46: Oceania Remote Sales Agents Revenue (million) Forecast, by Application 2019 & 2032
- Table 47: Rest of Asia Pacific Remote Sales Agents Revenue (million) Forecast, by Application 2019 & 2032
Frequently Asked Questions
1. What is the projected Compound Annual Growth Rate (CAGR) of the Remote Sales Agents?
The projected CAGR is approximately XX%.
2. Which companies are prominent players in the Remote Sales Agents?
Key companies in the market include CloudTask, CIENCE, Leadium, MarketStar, Martal Group, Acquirent, AOB India, Bandalier, CPM International, demandDrive, durhamlane, EBQ, Flockjay, FullFunnel, Jinactus Consulting, JumpCrew, Lease A Sales Rep, Marconix Sales and Marketing Private Limited, MarketSource, N3, Operatix, Sales Outsourcing Pros, Saletancy Consulting Private, The Vanella Group, Top Hawks, ZingPro Consulting.
3. What are the main segments of the Remote Sales Agents?
The market segments include Application, Types.
4. Can you provide details about the market size?
The market size is estimated to be USD XXX million as of 2022.
5. What are some drivers contributing to market growth?
N/A
6. What are the notable trends driving market growth?
N/A
7. Are there any restraints impacting market growth?
N/A
8. Can you provide examples of recent developments in the market?
N/A
9. What pricing options are available for accessing the report?
Pricing options include single-user, multi-user, and enterprise licenses priced at USD 4900.00, USD 7350.00, and USD 9800.00 respectively.
10. Is the market size provided in terms of value or volume?
The market size is provided in terms of value, measured in million.
11. Are there any specific market keywords associated with the report?
Yes, the market keyword associated with the report is "Remote Sales Agents," which aids in identifying and referencing the specific market segment covered.
12. How do I determine which pricing option suits my needs best?
The pricing options vary based on user requirements and access needs. Individual users may opt for single-user licenses, while businesses requiring broader access may choose multi-user or enterprise licenses for cost-effective access to the report.
13. Are there any additional resources or data provided in the Remote Sales Agents report?
While the report offers comprehensive insights, it's advisable to review the specific contents or supplementary materials provided to ascertain if additional resources or data are available.
14. How can I stay updated on further developments or reports in the Remote Sales Agents?
To stay informed about further developments, trends, and reports in the Remote Sales Agents, consider subscribing to industry newsletters, following relevant companies and organizations, or regularly checking reputable industry news sources and publications.
Methodology
Step 1 - Identification of Relevant Samples Size from Population Database


Step 2 - Approaches for Defining Global Market Size (Value, Volume* & Price*)

Note*: In applicable scenarios
Step 3 - Data Sources
Primary Research
- Web Analytics
- Survey Reports
- Research Institute
- Latest Research Reports
- Opinion Leaders
Secondary Research
- Annual Reports
- White Paper
- Latest Press Release
- Industry Association
- Paid Database
- Investor Presentations

Step 4 - Data Triangulation
Involves using different sources of information in order to increase the validity of a study
These sources are likely to be stakeholders in a program - participants, other researchers, program staff, other community members, and so on.
Then we put all data in single framework & apply various statistical tools to find out the dynamic on the market.
During the analysis stage, feedback from the stakeholder groups would be compared to determine areas of agreement as well as areas of divergence
