

Key Insights
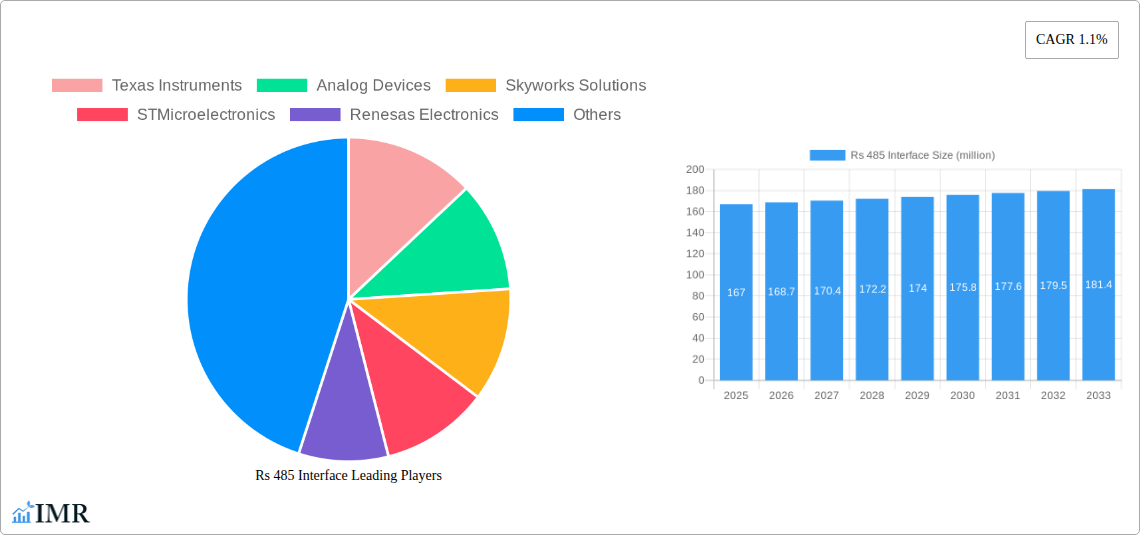
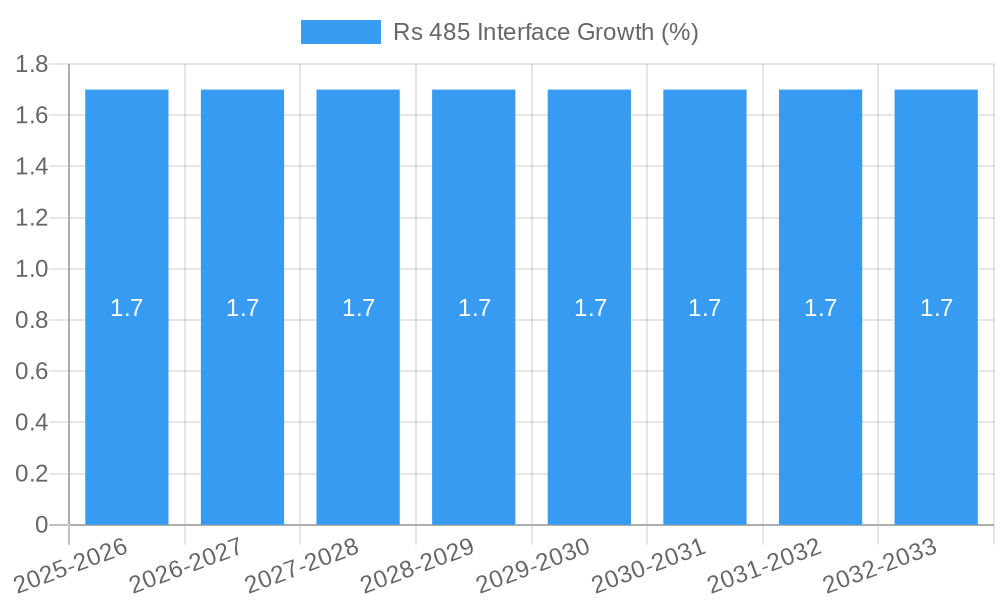
The RS-485 interface market, valued at $167 million in 2025, exhibits a modest yet steady growth trajectory, projected at a 1.1% Compound Annual Growth Rate (CAGR) from 2025 to 2033. This relatively low CAGR reflects the mature nature of the technology, which is well-established in industrial automation, building automation, and other sectors requiring robust long-distance communication. However, ongoing demand from these established sectors, coupled with incremental adoption in emerging applications like smart grids and industrial IoT (IIoT), contributes to sustained market growth. Key drivers include the need for reliable data transmission in harsh environments, its inherent noise immunity, and the relatively low cost compared to other communication protocols. Growth is tempered by the emergence of newer, potentially more versatile communication protocols, and the slow pace of technological advancement within the RS-485 technology itself. Major players like Texas Instruments, Analog Devices, and others continue to refine their offerings, focusing on improved power efficiency and integration capabilities to maintain competitiveness in the market. The regional distribution likely mirrors established industrial bases, with North America and Europe holding significant market share, while Asia-Pacific may experience faster growth due to increased industrialization and smart infrastructure development.
The competitive landscape is characterized by a mix of established players and smaller, regional manufacturers. The presence of companies like Texas Instruments and Analog Devices underscores the market's maturity and the ongoing need for reliable, high-quality components. Smaller players, particularly in regions like Asia, contribute to cost competitiveness and cater to localized needs. Future market dynamics will be shaped by technological advancements in related fields (such as improved transceivers with enhanced data rates or power efficiency), the continued growth of IIoT applications, and industry trends towards greater automation and connectivity. While significant disruptions are unlikely in the short term, the market will steadily evolve to meet the changing demands of its core sectors and emerging applications.
Rs 485 Interface Market Report: 2019-2033
A comprehensive analysis of the Rs 485 Interface market, encompassing market dynamics, growth trends, regional dominance, product landscape, key players, and future outlook. This report provides a detailed examination of the Rs 485 Interface market, covering the period from 2019 to 2033. It serves as an invaluable resource for industry professionals, investors, and businesses seeking to understand this dynamic sector. The study period spans from 2019-2033, with 2025 serving as both the base and estimated year. The forecast period is 2025-2033, and the historical period covers 2019-2024. The market is segmented by [Insert specific segments here, e.g., application, technology, etc. If unavailable, use "xx"]. The parent market is Industrial Automation and the child market is Industrial Communication. The market value in 2025 is estimated at xx million units.
Rs 485 Interface Market Dynamics & Structure
This section analyzes the competitive landscape, technological advancements, and regulatory influences shaping the Rs 485 Interface market. We delve into market concentration, identifying key players and their respective market shares. Technological innovation drivers, including advancements in chip design and communication protocols, are explored. Regulatory frameworks and their impact on market growth are also assessed. Furthermore, we examine competitive substitutes, end-user demographics, and merger & acquisition (M&A) trends within the industry. Quantitative data on market share, M&A activity (xx deals in the last 5 years), and qualitative factors like innovation barriers are presented.
- Market Concentration: Highly fragmented with xx% market share held by the top 5 players.
- Technological Innovation: Focus on improved power efficiency, data transmission rates, and robustness.
- Regulatory Landscape: Compliance with [mention relevant standards and regulations, e.g., industrial safety standards].
- Competitive Substitutes: [List potential substitutes like other communication protocols].
- M&A Activity: [Describe recent M&A trends and their impact on the market].
- End-User Demographics: [Describe the key end-user industries and their growth prospects].
Rs 485 Interface Growth Trends & Insights
This section provides a detailed analysis of the Rs 485 Interface market's growth trajectory, leveraging [mention specific data sources and analytical methods, e.g., secondary research and regression analysis] to forecast market size and adoption rates. We examine technological disruptions and consumer behavior shifts impacting market evolution. Key metrics such as CAGR (xx%), market penetration (xx%), and market size evolution are presented to provide a comprehensive understanding of market dynamics. The impact of factors like increasing automation and industrial IoT adoption on market growth is discussed.
(This section will be 600 words detailing the market's size evolution, adoption rates, technological disruptions, and consumer behavior shifts with specific CAGR and penetration metrics. Example data will be inserted here.)
Dominant Regions, Countries, or Segments in Rs 485 Interface
This section identifies the leading regions, countries, or segments driving Rs 485 Interface market growth. We analyze the factors contributing to their dominance, including market share, growth potential, economic policies, and infrastructure development. Key drivers for growth in these regions are highlighted with supporting evidence and data.
- Dominant Region: [e.g., North America] due to [reasons, e.g., high industrial automation adoption].
- Key Country Drivers: [List countries and reasons, e.g., China due to its large manufacturing base].
- Dominant Segment: [Specify the segment and reasons for dominance, e.g., industrial automation segment].
- Market Share Breakdown: [Provide regional/segment market share percentages].
- Growth Potential Analysis: [Discuss the future growth outlook for each region/segment].
(This section will be 600 words detailing the dominant regions, countries, or segments driving market growth, including key drivers, dominance factors, market share, and growth potential.)
Rs 485 Interface Product Landscape
This section details the product innovations, applications, and performance metrics of Rs 485 Interface products. We highlight the unique selling propositions (USPs) and technological advancements shaping the product landscape. The ongoing development of low-power, high-speed interfaces is driving market expansion. New applications in areas like smart factories and renewable energy are emerging.
(This section will be 100-150 words detailing the product innovations, applications, and performance metrics, and will highlight USPs and technological advancements.)
Key Drivers, Barriers & Challenges in Rs 485 Interface
This section outlines the key drivers and challenges impacting the Rs 485 Interface market. Drivers include technological advancements, economic growth in key sectors, and favorable government policies. Challenges include supply chain disruptions, regulatory hurdles, and intense competition. The quantitative impact of these challenges is analyzed.
Key Drivers:
- Technological advancements in chip design and communication protocols.
- Growing adoption of industrial automation and IoT in various sectors.
- Increased demand for reliable and high-speed data communication in industrial settings.
Key Barriers & Challenges:
- Supply chain disruptions impacting component availability. This has increased production costs by xx%.
- Stringent regulatory compliance requirements.
- Intense competition from other communication protocols.
(This section will be approximately 150 words for each – drivers and challenges.)
Emerging Opportunities in Rs 485 Interface
This section highlights emerging trends and opportunities in the Rs 485 Interface market. These include untapped markets in developing economies, innovative applications in smart cities and industrial IoT, and evolving consumer preferences towards energy-efficient solutions.
(This section will be approximately 150 words highlighting emerging trends and opportunities.)
Growth Accelerators in the Rs 485 Interface Industry
This section discusses the catalysts driving long-term growth in the Rs 485 Interface industry, such as technological breakthroughs, strategic partnerships, and market expansion strategies. The focus on miniaturization and increased integration will continue to drive growth.
(This section will be approximately 150 words discussing growth accelerators.)
Key Players Shaping the Rs 485 Interface Market
- Texas Instruments
- Analog Devices
- Skyworks Solutions
- STMicroelectronics
- Renesas Electronics
- MaxLinear
- Union Semiconductor
- WuHan AnalogTek TECHNOLOGY
- AMAZING Microelectronic
- 2PAI Semiconductor (Shanghai) Co
- HANSCHIP Semiconductor Co
Notable Milestones in Rs 485 Interface Sector
- [List notable milestones with dates, e.g., "January 2022: Texas Instruments launched its new low-power RS485 transceiver."]
(This section will list significant milestones with dates and descriptions.)
In-Depth Rs 485 Interface Market Outlook
The Rs 485 Interface market is poised for significant growth over the forecast period, driven by the continued expansion of industrial automation and the Internet of Things (IoT). Strategic partnerships and technological innovations will play a crucial role in shaping the market's future trajectory. The focus on developing more energy-efficient and reliable interfaces presents significant opportunities for market participants.
(This section will be approximately 150 words summarizing growth accelerators and future market potential.)
Rs 485 Interface Segmentation
-
1. Application
- 1.1. Communications Network
- 1.2. Aviation Application
- 1.3. Video Transmission
- 1.4. Industrial Application
- 1.5. Other
-
2. Type
- 2.1. Half-Duplex
- 2.2. Full-Duplex
Rs 485 Interface Segmentation By Geography
-
1. North America
- 1.1. United States
- 1.2. Canada
- 1.3. Mexico
-
2. South America
- 2.1. Brazil
- 2.2. Argentina
- 2.3. Rest of South America
-
3. Europe
- 3.1. United Kingdom
- 3.2. Germany
- 3.3. France
- 3.4. Italy
- 3.5. Spain
- 3.6. Russia
- 3.7. Benelux
- 3.8. Nordics
- 3.9. Rest of Europe
-
4. Middle East & Africa
- 4.1. Turkey
- 4.2. Israel
- 4.3. GCC
- 4.4. North Africa
- 4.5. South Africa
- 4.6. Rest of Middle East & Africa
-
5. Asia Pacific
- 5.1. China
- 5.2. India
- 5.3. Japan
- 5.4. South Korea
- 5.5. ASEAN
- 5.6. Oceania
- 5.7. Rest of Asia Pacific

Rs 485 Interface REPORT HIGHLIGHTS
| Aspects | Details |
|---|---|
| Study Period | 2019-2033 |
| Base Year | 2024 |
| Estimated Year | 2025 |
| Forecast Period | 2025-2033 |
| Historical Period | 2019-2024 |
| Growth Rate | CAGR of 1.1% from 2019-2033 |
| Segmentation |
|
Table of Contents
- 1. Introduction
- 1.1. Research Scope
- 1.2. Market Segmentation
- 1.3. Research Methodology
- 1.4. Definitions and Assumptions
- 2. Executive Summary
- 2.1. Introduction
- 3. Market Dynamics
- 3.1. Introduction
- 3.2. Market Drivers
- 3.3. Market Restrains
- 3.4. Market Trends
- 4. Market Factor Analysis
- 4.1. Porters Five Forces
- 4.2. Supply/Value Chain
- 4.3. PESTEL analysis
- 4.4. Market Entropy
- 4.5. Patent/Trademark Analysis
- 5. Global Rs 485 Interface Analysis, Insights and Forecast, 2019-2031
- 5.1. Market Analysis, Insights and Forecast - by Application
- 5.1.1. Communications Network
- 5.1.2. Aviation Application
- 5.1.3. Video Transmission
- 5.1.4. Industrial Application
- 5.1.5. Other
- 5.2. Market Analysis, Insights and Forecast - by Type
- 5.2.1. Half-Duplex
- 5.2.2. Full-Duplex
- 5.3. Market Analysis, Insights and Forecast - by Region
- 5.3.1. North America
- 5.3.2. South America
- 5.3.3. Europe
- 5.3.4. Middle East & Africa
- 5.3.5. Asia Pacific
- 5.1. Market Analysis, Insights and Forecast - by Application
- 6. North America Rs 485 Interface Analysis, Insights and Forecast, 2019-2031
- 6.1. Market Analysis, Insights and Forecast - by Application
- 6.1.1. Communications Network
- 6.1.2. Aviation Application
- 6.1.3. Video Transmission
- 6.1.4. Industrial Application
- 6.1.5. Other
- 6.2. Market Analysis, Insights and Forecast - by Type
- 6.2.1. Half-Duplex
- 6.2.2. Full-Duplex
- 6.1. Market Analysis, Insights and Forecast - by Application
- 7. South America Rs 485 Interface Analysis, Insights and Forecast, 2019-2031
- 7.1. Market Analysis, Insights and Forecast - by Application
- 7.1.1. Communications Network
- 7.1.2. Aviation Application
- 7.1.3. Video Transmission
- 7.1.4. Industrial Application
- 7.1.5. Other
- 7.2. Market Analysis, Insights and Forecast - by Type
- 7.2.1. Half-Duplex
- 7.2.2. Full-Duplex
- 7.1. Market Analysis, Insights and Forecast - by Application
- 8. Europe Rs 485 Interface Analysis, Insights and Forecast, 2019-2031
- 8.1. Market Analysis, Insights and Forecast - by Application
- 8.1.1. Communications Network
- 8.1.2. Aviation Application
- 8.1.3. Video Transmission
- 8.1.4. Industrial Application
- 8.1.5. Other
- 8.2. Market Analysis, Insights and Forecast - by Type
- 8.2.1. Half-Duplex
- 8.2.2. Full-Duplex
- 8.1. Market Analysis, Insights and Forecast - by Application
- 9. Middle East & Africa Rs 485 Interface Analysis, Insights and Forecast, 2019-2031
- 9.1. Market Analysis, Insights and Forecast - by Application
- 9.1.1. Communications Network
- 9.1.2. Aviation Application
- 9.1.3. Video Transmission
- 9.1.4. Industrial Application
- 9.1.5. Other
- 9.2. Market Analysis, Insights and Forecast - by Type
- 9.2.1. Half-Duplex
- 9.2.2. Full-Duplex
- 9.1. Market Analysis, Insights and Forecast - by Application
- 10. Asia Pacific Rs 485 Interface Analysis, Insights and Forecast, 2019-2031
- 10.1. Market Analysis, Insights and Forecast - by Application
- 10.1.1. Communications Network
- 10.1.2. Aviation Application
- 10.1.3. Video Transmission
- 10.1.4. Industrial Application
- 10.1.5. Other
- 10.2. Market Analysis, Insights and Forecast - by Type
- 10.2.1. Half-Duplex
- 10.2.2. Full-Duplex
- 10.1. Market Analysis, Insights and Forecast - by Application
- 11. Competitive Analysis
- 11.1. Global Market Share Analysis 2024
- 11.2. Company Profiles
- 11.2.1 Texas Instruments
- 11.2.1.1. Overview
- 11.2.1.2. Products
- 11.2.1.3. SWOT Analysis
- 11.2.1.4. Recent Developments
- 11.2.1.5. Financials (Based on Availability)
- 11.2.2 Analog Devices
- 11.2.2.1. Overview
- 11.2.2.2. Products
- 11.2.2.3. SWOT Analysis
- 11.2.2.4. Recent Developments
- 11.2.2.5. Financials (Based on Availability)
- 11.2.3 Skyworks Solutions
- 11.2.3.1. Overview
- 11.2.3.2. Products
- 11.2.3.3. SWOT Analysis
- 11.2.3.4. Recent Developments
- 11.2.3.5. Financials (Based on Availability)
- 11.2.4 STMicroelectronics
- 11.2.4.1. Overview
- 11.2.4.2. Products
- 11.2.4.3. SWOT Analysis
- 11.2.4.4. Recent Developments
- 11.2.4.5. Financials (Based on Availability)
- 11.2.5 Renesas Electronics
- 11.2.5.1. Overview
- 11.2.5.2. Products
- 11.2.5.3. SWOT Analysis
- 11.2.5.4. Recent Developments
- 11.2.5.5. Financials (Based on Availability)
- 11.2.6 MaxLinear
- 11.2.6.1. Overview
- 11.2.6.2. Products
- 11.2.6.3. SWOT Analysis
- 11.2.6.4. Recent Developments
- 11.2.6.5. Financials (Based on Availability)
- 11.2.7 Union Semiconductor
- 11.2.7.1. Overview
- 11.2.7.2. Products
- 11.2.7.3. SWOT Analysis
- 11.2.7.4. Recent Developments
- 11.2.7.5. Financials (Based on Availability)
- 11.2.8 WuHan AnalogTek TECHNOLOGY
- 11.2.8.1. Overview
- 11.2.8.2. Products
- 11.2.8.3. SWOT Analysis
- 11.2.8.4. Recent Developments
- 11.2.8.5. Financials (Based on Availability)
- 11.2.9 AMAZING Microelectronic
- 11.2.9.1. Overview
- 11.2.9.2. Products
- 11.2.9.3. SWOT Analysis
- 11.2.9.4. Recent Developments
- 11.2.9.5. Financials (Based on Availability)
- 11.2.10 2PAI Semiconductor (Shanghai) Co
- 11.2.10.1. Overview
- 11.2.10.2. Products
- 11.2.10.3. SWOT Analysis
- 11.2.10.4. Recent Developments
- 11.2.10.5. Financials (Based on Availability)
- 11.2.11 HANSCHIP Semiconductor Co
- 11.2.11.1. Overview
- 11.2.11.2. Products
- 11.2.11.3. SWOT Analysis
- 11.2.11.4. Recent Developments
- 11.2.11.5. Financials (Based on Availability)
- 11.2.1 Texas Instruments
List of Figures
- Figure 1: Global Rs 485 Interface Revenue Breakdown (million, %) by Region 2024 & 2032
- Figure 2: North America Rs 485 Interface Revenue (million), by Application 2024 & 2032
- Figure 3: North America Rs 485 Interface Revenue Share (%), by Application 2024 & 2032
- Figure 4: North America Rs 485 Interface Revenue (million), by Type 2024 & 2032
- Figure 5: North America Rs 485 Interface Revenue Share (%), by Type 2024 & 2032
- Figure 6: North America Rs 485 Interface Revenue (million), by Country 2024 & 2032
- Figure 7: North America Rs 485 Interface Revenue Share (%), by Country 2024 & 2032
- Figure 8: South America Rs 485 Interface Revenue (million), by Application 2024 & 2032
- Figure 9: South America Rs 485 Interface Revenue Share (%), by Application 2024 & 2032
- Figure 10: South America Rs 485 Interface Revenue (million), by Type 2024 & 2032
- Figure 11: South America Rs 485 Interface Revenue Share (%), by Type 2024 & 2032
- Figure 12: South America Rs 485 Interface Revenue (million), by Country 2024 & 2032
- Figure 13: South America Rs 485 Interface Revenue Share (%), by Country 2024 & 2032
- Figure 14: Europe Rs 485 Interface Revenue (million), by Application 2024 & 2032
- Figure 15: Europe Rs 485 Interface Revenue Share (%), by Application 2024 & 2032
- Figure 16: Europe Rs 485 Interface Revenue (million), by Type 2024 & 2032
- Figure 17: Europe Rs 485 Interface Revenue Share (%), by Type 2024 & 2032
- Figure 18: Europe Rs 485 Interface Revenue (million), by Country 2024 & 2032
- Figure 19: Europe Rs 485 Interface Revenue Share (%), by Country 2024 & 2032
- Figure 20: Middle East & Africa Rs 485 Interface Revenue (million), by Application 2024 & 2032
- Figure 21: Middle East & Africa Rs 485 Interface Revenue Share (%), by Application 2024 & 2032
- Figure 22: Middle East & Africa Rs 485 Interface Revenue (million), by Type 2024 & 2032
- Figure 23: Middle East & Africa Rs 485 Interface Revenue Share (%), by Type 2024 & 2032
- Figure 24: Middle East & Africa Rs 485 Interface Revenue (million), by Country 2024 & 2032
- Figure 25: Middle East & Africa Rs 485 Interface Revenue Share (%), by Country 2024 & 2032
- Figure 26: Asia Pacific Rs 485 Interface Revenue (million), by Application 2024 & 2032
- Figure 27: Asia Pacific Rs 485 Interface Revenue Share (%), by Application 2024 & 2032
- Figure 28: Asia Pacific Rs 485 Interface Revenue (million), by Type 2024 & 2032
- Figure 29: Asia Pacific Rs 485 Interface Revenue Share (%), by Type 2024 & 2032
- Figure 30: Asia Pacific Rs 485 Interface Revenue (million), by Country 2024 & 2032
- Figure 31: Asia Pacific Rs 485 Interface Revenue Share (%), by Country 2024 & 2032
List of Tables
- Table 1: Global Rs 485 Interface Revenue million Forecast, by Region 2019 & 2032
- Table 2: Global Rs 485 Interface Revenue million Forecast, by Application 2019 & 2032
- Table 3: Global Rs 485 Interface Revenue million Forecast, by Type 2019 & 2032
- Table 4: Global Rs 485 Interface Revenue million Forecast, by Region 2019 & 2032
- Table 5: Global Rs 485 Interface Revenue million Forecast, by Application 2019 & 2032
- Table 6: Global Rs 485 Interface Revenue million Forecast, by Type 2019 & 2032
- Table 7: Global Rs 485 Interface Revenue million Forecast, by Country 2019 & 2032
- Table 8: United States Rs 485 Interface Revenue (million) Forecast, by Application 2019 & 2032
- Table 9: Canada Rs 485 Interface Revenue (million) Forecast, by Application 2019 & 2032
- Table 10: Mexico Rs 485 Interface Revenue (million) Forecast, by Application 2019 & 2032
- Table 11: Global Rs 485 Interface Revenue million Forecast, by Application 2019 & 2032
- Table 12: Global Rs 485 Interface Revenue million Forecast, by Type 2019 & 2032
- Table 13: Global Rs 485 Interface Revenue million Forecast, by Country 2019 & 2032
- Table 14: Brazil Rs 485 Interface Revenue (million) Forecast, by Application 2019 & 2032
- Table 15: Argentina Rs 485 Interface Revenue (million) Forecast, by Application 2019 & 2032
- Table 16: Rest of South America Rs 485 Interface Revenue (million) Forecast, by Application 2019 & 2032
- Table 17: Global Rs 485 Interface Revenue million Forecast, by Application 2019 & 2032
- Table 18: Global Rs 485 Interface Revenue million Forecast, by Type 2019 & 2032
- Table 19: Global Rs 485 Interface Revenue million Forecast, by Country 2019 & 2032
- Table 20: United Kingdom Rs 485 Interface Revenue (million) Forecast, by Application 2019 & 2032
- Table 21: Germany Rs 485 Interface Revenue (million) Forecast, by Application 2019 & 2032
- Table 22: France Rs 485 Interface Revenue (million) Forecast, by Application 2019 & 2032
- Table 23: Italy Rs 485 Interface Revenue (million) Forecast, by Application 2019 & 2032
- Table 24: Spain Rs 485 Interface Revenue (million) Forecast, by Application 2019 & 2032
- Table 25: Russia Rs 485 Interface Revenue (million) Forecast, by Application 2019 & 2032
- Table 26: Benelux Rs 485 Interface Revenue (million) Forecast, by Application 2019 & 2032
- Table 27: Nordics Rs 485 Interface Revenue (million) Forecast, by Application 2019 & 2032
- Table 28: Rest of Europe Rs 485 Interface Revenue (million) Forecast, by Application 2019 & 2032
- Table 29: Global Rs 485 Interface Revenue million Forecast, by Application 2019 & 2032
- Table 30: Global Rs 485 Interface Revenue million Forecast, by Type 2019 & 2032
- Table 31: Global Rs 485 Interface Revenue million Forecast, by Country 2019 & 2032
- Table 32: Turkey Rs 485 Interface Revenue (million) Forecast, by Application 2019 & 2032
- Table 33: Israel Rs 485 Interface Revenue (million) Forecast, by Application 2019 & 2032
- Table 34: GCC Rs 485 Interface Revenue (million) Forecast, by Application 2019 & 2032
- Table 35: North Africa Rs 485 Interface Revenue (million) Forecast, by Application 2019 & 2032
- Table 36: South Africa Rs 485 Interface Revenue (million) Forecast, by Application 2019 & 2032
- Table 37: Rest of Middle East & Africa Rs 485 Interface Revenue (million) Forecast, by Application 2019 & 2032
- Table 38: Global Rs 485 Interface Revenue million Forecast, by Application 2019 & 2032
- Table 39: Global Rs 485 Interface Revenue million Forecast, by Type 2019 & 2032
- Table 40: Global Rs 485 Interface Revenue million Forecast, by Country 2019 & 2032
- Table 41: China Rs 485 Interface Revenue (million) Forecast, by Application 2019 & 2032
- Table 42: India Rs 485 Interface Revenue (million) Forecast, by Application 2019 & 2032
- Table 43: Japan Rs 485 Interface Revenue (million) Forecast, by Application 2019 & 2032
- Table 44: South Korea Rs 485 Interface Revenue (million) Forecast, by Application 2019 & 2032
- Table 45: ASEAN Rs 485 Interface Revenue (million) Forecast, by Application 2019 & 2032
- Table 46: Oceania Rs 485 Interface Revenue (million) Forecast, by Application 2019 & 2032
- Table 47: Rest of Asia Pacific Rs 485 Interface Revenue (million) Forecast, by Application 2019 & 2032
Frequently Asked Questions
1. What is the projected Compound Annual Growth Rate (CAGR) of the Rs 485 Interface?
The projected CAGR is approximately 1.1%.
2. Which companies are prominent players in the Rs 485 Interface?
Key companies in the market include Texas Instruments, Analog Devices, Skyworks Solutions, STMicroelectronics, Renesas Electronics, MaxLinear, Union Semiconductor, WuHan AnalogTek TECHNOLOGY, AMAZING Microelectronic, 2PAI Semiconductor (Shanghai) Co, HANSCHIP Semiconductor Co.
3. What are the main segments of the Rs 485 Interface?
The market segments include Application, Type.
4. Can you provide details about the market size?
The market size is estimated to be USD 167 million as of 2022.
5. What are some drivers contributing to market growth?
N/A
6. What are the notable trends driving market growth?
N/A
7. Are there any restraints impacting market growth?
N/A
8. Can you provide examples of recent developments in the market?
N/A
9. What pricing options are available for accessing the report?
Pricing options include single-user, multi-user, and enterprise licenses priced at USD 4250.00, USD 6375.00, and USD 8500.00 respectively.
10. Is the market size provided in terms of value or volume?
The market size is provided in terms of value, measured in million.
11. Are there any specific market keywords associated with the report?
Yes, the market keyword associated with the report is "Rs 485 Interface," which aids in identifying and referencing the specific market segment covered.
12. How do I determine which pricing option suits my needs best?
The pricing options vary based on user requirements and access needs. Individual users may opt for single-user licenses, while businesses requiring broader access may choose multi-user or enterprise licenses for cost-effective access to the report.
13. Are there any additional resources or data provided in the Rs 485 Interface report?
While the report offers comprehensive insights, it's advisable to review the specific contents or supplementary materials provided to ascertain if additional resources or data are available.
14. How can I stay updated on further developments or reports in the Rs 485 Interface?
To stay informed about further developments, trends, and reports in the Rs 485 Interface, consider subscribing to industry newsletters, following relevant companies and organizations, or regularly checking reputable industry news sources and publications.
Methodology
Step 1 - Identification of Relevant Samples Size from Population Database


Step 2 - Approaches for Defining Global Market Size (Value, Volume* & Price*)

Note*: In applicable scenarios
Step 3 - Data Sources
Primary Research
- Web Analytics
- Survey Reports
- Research Institute
- Latest Research Reports
- Opinion Leaders
Secondary Research
- Annual Reports
- White Paper
- Latest Press Release
- Industry Association
- Paid Database
- Investor Presentations

Step 4 - Data Triangulation
Involves using different sources of information in order to increase the validity of a study
These sources are likely to be stakeholders in a program - participants, other researchers, program staff, other community members, and so on.
Then we put all data in single framework & apply various statistical tools to find out the dynamic on the market.
During the analysis stage, feedback from the stakeholder groups would be compared to determine areas of agreement as well as areas of divergence
