

Key Insights
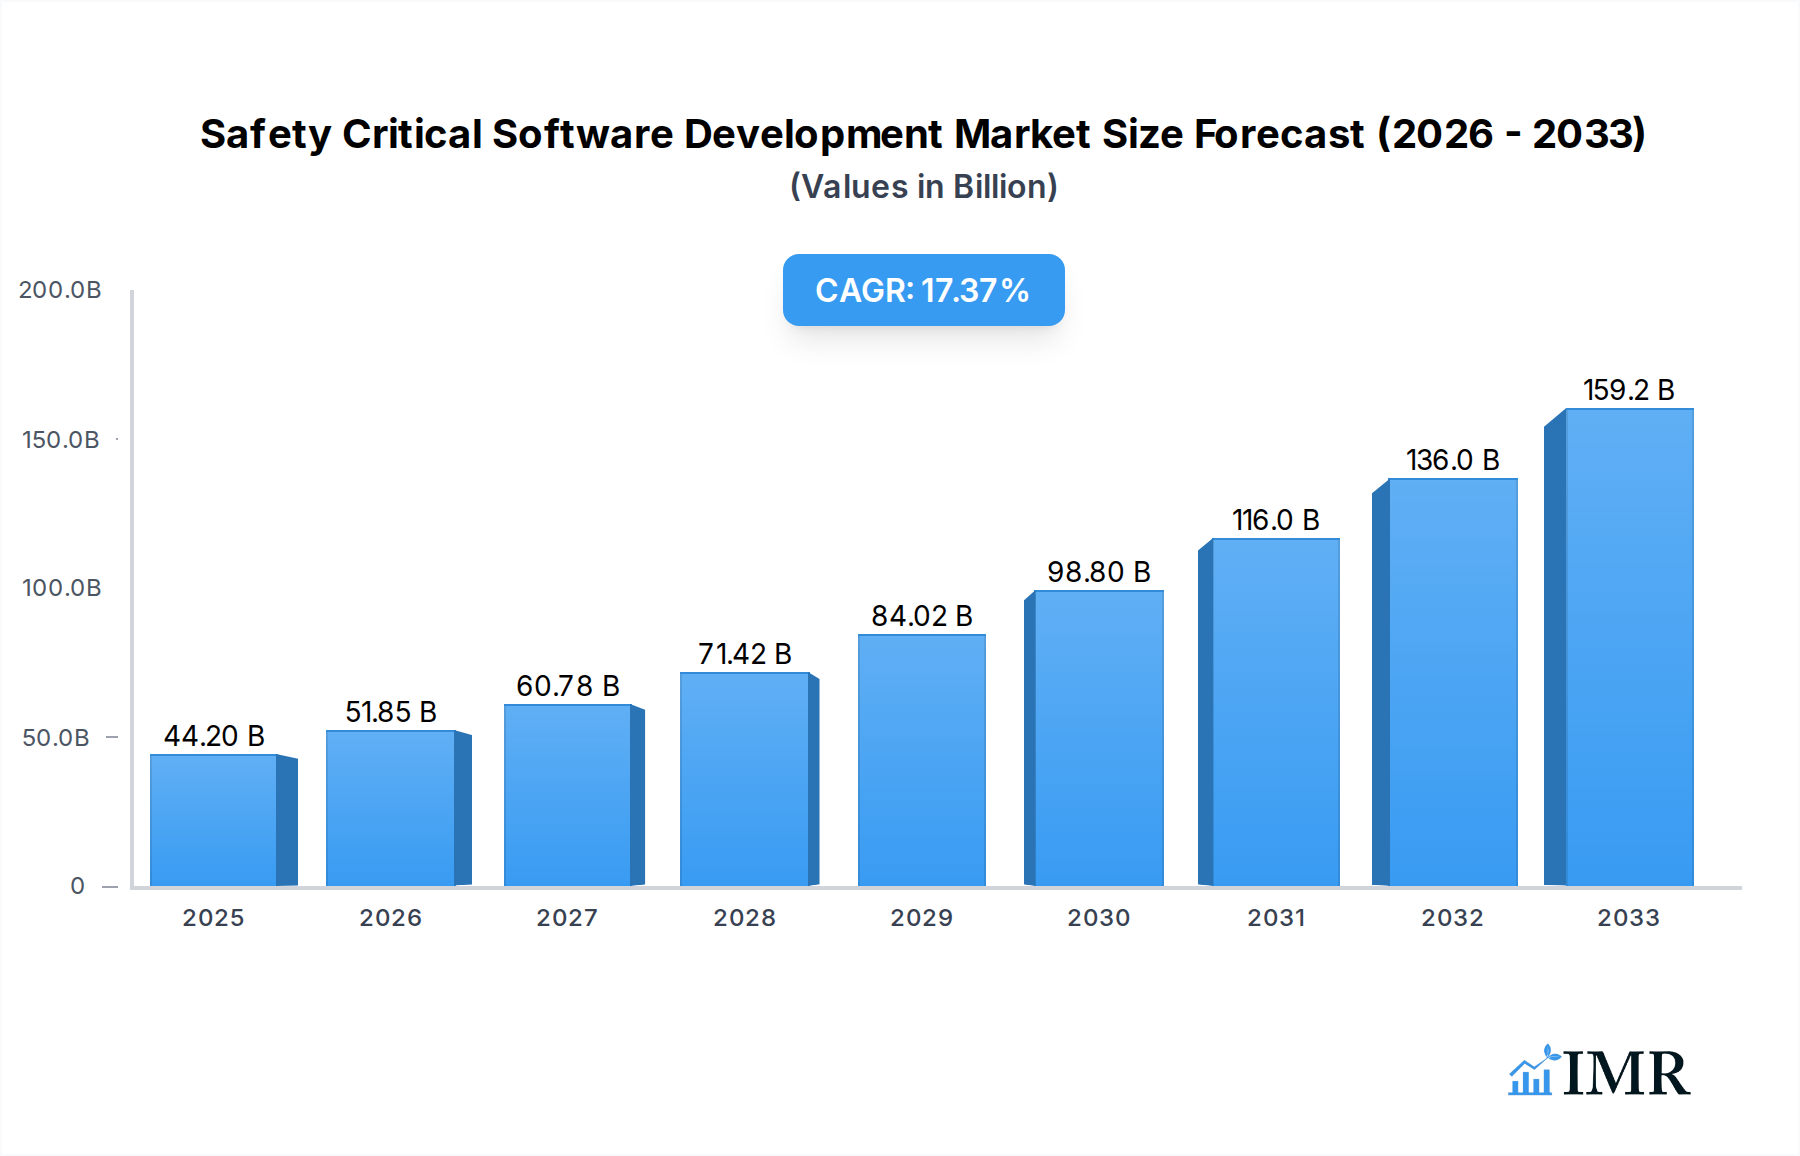
The global Safety Critical Software Development market is poised for substantial expansion, projected to reach USD 44.2 billion in 2025 with an impressive CAGR of 17.3% during the forecast period of 2025-2033. This robust growth is fueled by the escalating demand for highly reliable and secure software solutions across mission-critical sectors. Key drivers include the stringent regulatory landscape in industries like Aerospace and Defense, where software failure can have catastrophic consequences, leading to significant investments in safety-certified development processes and tools. The automotive sector's rapid adoption of advanced driver-assistance systems (ADAS) and autonomous driving technologies, inherently reliant on safety-critical software, further propels market expansion. Similarly, the medical devices industry, facing ever-increasing scrutiny for patient safety, demands sophisticated software that meets rigorous validation and verification standards. The energy sector's transition towards smarter grids and the growing complexity of industrial automation also contribute to this upward trend.

Safety Critical Software Development Market Size (In Billion)
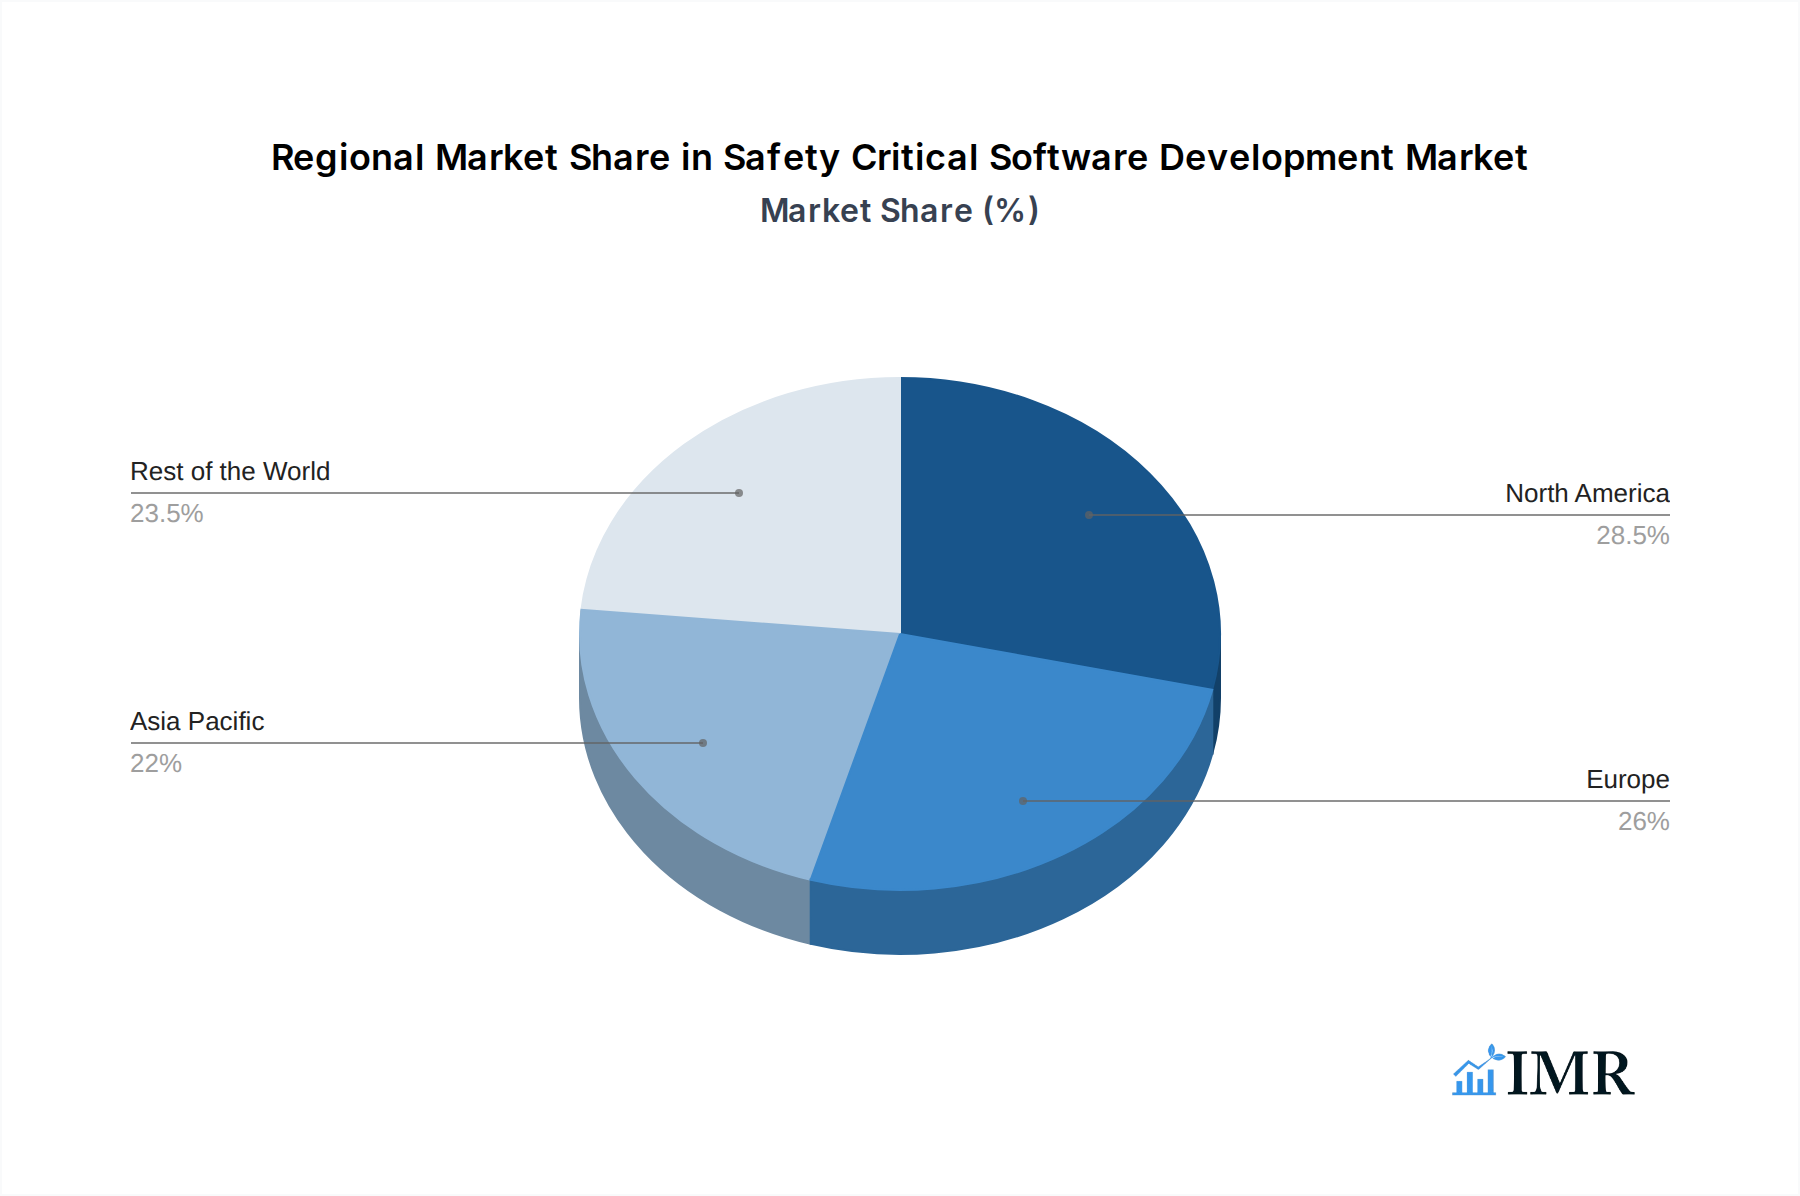
Emerging trends such as the increasing adoption of Artificial Intelligence (AI) and Machine Learning (ML) in safety-critical applications, alongside the growing utilization of custom software solutions tailored to specific industry needs, are shaping the market's trajectory. The market is segmented into standard and custom software types, with custom software likely to witness higher growth due to its ability to address unique safety requirements. Geographically, North America and Europe are expected to dominate the market, driven by established regulatory frameworks and significant R&D investments. Asia Pacific, particularly China and India, presents a substantial growth opportunity owing to the burgeoning manufacturing and technology sectors and increasing focus on safety standards. While the market is characterized by strong growth, challenges such as the high cost of development and stringent certification processes, along with the need for specialized expertise, may act as moderate restraints. However, the overarching imperative for safety and reliability across numerous vital industries ensures a promising outlook for safety-critical software development.
Safety Critical Software Development Company Market Share
This in-depth report delivers a thorough analysis of the global Safety Critical Software Development market, providing unparalleled insights for industry professionals, investors, and stakeholders. Covering a comprehensive study period from 2019 to 2033, with a base year of 2025, this report dissects market dynamics, growth trends, regional dominance, product landscape, key drivers, barriers, emerging opportunities, and future outlook. We meticulously examine the interplay between parent and child markets, offering a nuanced understanding of the ecosystem. With high-traffic keywords and targeted content, this report is optimized for maximum search engine visibility and engagement.
Safety Critical Software Development Market Dynamics & Structure
The Safety Critical Software Development market is characterized by a moderately concentrated structure, driven by the need for specialized expertise and rigorous quality assurance. Technological innovation remains the primary engine, with advancements in AI/ML for verification, model-based design, and automated testing significantly impacting development processes. The global market size for safety-critical software development was valued at approximately $XX billion in 2024, with projections indicating substantial growth. Regulatory frameworks such as DO-178C (Aerospace), ISO 26262 (Automotive), and IEC 62304 (Medical Devices) are paramount, dictating stringent development lifecycles and compliance requirements. Competitive product substitutes are largely non-existent in their purest form, given the domain's specificity; however, advancements in general software development tools and methodologies can indirectly influence efficiency.
- Market Concentration: Dominated by a mix of established players and niche specialists, with a growing trend towards consolidation.
- Technological Innovation Drivers: AI-powered testing, formal verification methods, continuous integration/continuous deployment (CI/CD) for safety-critical systems, and the rise of domain-specific languages are key.
- Regulatory Frameworks: Stringent adherence to international standards is non-negotiable, forming a significant entry barrier.
- End-User Demographics: Primarily comprised of large corporations in highly regulated industries, with increasing demand from emerging tech sectors adopting safety-critical principles.
- M&A Trends: A steady stream of acquisitions aimed at acquiring specialized talent, proprietary technologies, and market share within specific application segments. The volume of M&A deals in the safety-critical software sector was approximately X deals in 2024, with an estimated total value of $X billion.
Safety Critical Software Development Growth Trends & Insights
The safety-critical software development market is poised for robust expansion, projected to grow at a Compound Annual Growth Rate (CAGR) of XX% from 2025 to 2033. This growth is fueled by an escalating demand for highly reliable and secure software across a multitude of sectors, driven by increasingly sophisticated applications and stringent safety mandates. In 2025, the global market size is estimated to reach $XX billion. The adoption rate of safety-critical software development methodologies and tools is steadily increasing as organizations recognize the immense cost and reputational implications of software failures in high-stakes environments.
Technological disruptions, including the pervasive integration of artificial intelligence (AI) for predictive maintenance and autonomous systems, along with the expansion of the Internet of Things (IoT) in critical infrastructure, are creating new avenues for growth. Consumer behavior shifts are also playing a role, with a heightened awareness and expectation of safety and security in devices and services, particularly in the automotive and medical device sectors. The market penetration of specialized safety-critical software solutions is expanding beyond traditional aerospace and defense, with significant growth observed in automotive (especially with autonomous driving features) and medical devices (driven by connected health solutions).
Furthermore, the increasing complexity of software systems in sectors like railway and energy necessitates rigorous safety development practices. The continuous evolution of regulatory landscapes also acts as a catalyst, pushing companies to invest in advanced safety software development to ensure compliance and mitigate risks. The market's ability to adapt to evolving cyber threats while maintaining functional safety is a critical factor underpinning its sustained growth trajectory. Innovations in formal methods, model-based systems engineering (MBSE), and advanced verification techniques are further accelerating adoption and market penetration.
Dominant Regions, Countries, or Segments in Safety Critical Software Development
The Automotive segment is emerging as a dominant force in the safety-critical software development market, projected to account for approximately XX% of the global market share by 2025. This ascendancy is primarily driven by the rapid advancement of autonomous driving technologies, electric vehicles (EVs), and sophisticated driver-assistance systems (ADAS). The stringent safety standards like ISO 26262 mandate the development of highly reliable software for critical functions such as braking, steering, and perception systems. The sheer volume of vehicles produced globally, coupled with the increasing integration of complex software functionalities, makes this segment a prime growth engine. The global automotive safety-critical software market was valued at $XX billion in 2025.
Geographically, North America and Europe continue to hold significant sway, largely due to the presence of established automotive and aerospace manufacturers and robust regulatory bodies. However, Asia Pacific, particularly China and South Korea, is witnessing accelerated growth owing to its expanding automotive production base and significant investments in smart mobility solutions.
Among the Types, Custom Software development holds a substantial market share, estimated at XX% in 2025, reflecting the unique and often highly specific safety requirements of critical systems across all applications. While Standard Software plays a role in providing foundational components, the intricate nature of safety-critical applications frequently necessitates tailor-made solutions to meet exact performance, reliability, and compliance demands. The market for custom safety-critical software was valued at $XX billion in 2025.
- Dominant Application Segment: Automotive, driven by ADAS, autonomous driving, and electrification.
- Market share projection for Automotive: XX% by 2025.
- Key drivers: Stringent ISO 26262 standards, rapid technological advancements in vehicle autonomy.
- Leading Regions: North America and Europe (established markets), with Asia Pacific (especially China, South Korea) showing rapid growth.
- Economic policies supporting advanced manufacturing and R&D.
- Infrastructure development for connected and autonomous vehicles.
- Dominant Type: Custom Software, due to bespoke safety requirements.
- Market share projection for Custom Software: XX% by 2025.
- Growth potential: Continual innovation in application-specific needs.
Safety Critical Software Development Product Landscape
The safety-critical software development product landscape is characterized by sophisticated tools and platforms designed for rigorous verification, validation, and certification. Innovations focus on enhancing development efficiency, improving code quality, and ensuring compliance with stringent industry standards. Key product categories include development environments, static and dynamic analysis tools, model-based design and simulation software, and testing and verification suites. Performance metrics revolve around reducing defect rates, accelerating certification cycles, and enabling seamless integration of complex software components. Unique selling propositions often lie in specialized toolchains supporting specific safety standards and offering advanced features like formal verification, automated code generation, and runtime monitoring. Technological advancements are increasingly incorporating AI/ML for intelligent debugging and predictive quality analysis.
Key Drivers, Barriers & Challenges in Safety Critical Software Development
Key Drivers:
- Increasing Complexity of Systems: Modern systems in aerospace, automotive, and medical devices are inherently complex, demanding robust safety software.
- Stringent Regulatory Mandates: Evolving and strict safety regulations (e.g., DO-178C, ISO 26262) are non-negotiable drivers for adopting certified development practices.
- Technological Advancements: AI, ML, and advanced simulation techniques are enabling more efficient and reliable safety-critical software development.
- Growing Demand for Safety and Security: Heightened public and industry awareness of the consequences of software failures fuels investment.
Barriers & Challenges:
- High Development Costs: The rigorous testing, verification, and certification processes significantly increase development expenses.
- Talent Shortage: A scarcity of highly skilled engineers with expertise in safety-critical software development poses a significant hurdle.
- Long Development Cycles: Meeting stringent certification requirements often leads to extended product development timelines.
- Supply Chain Vulnerabilities: Reliance on third-party components and software can introduce risks if not managed meticulously. The estimated impact of supply chain disruptions on project timelines can range from X% to XX%.
- Cybersecurity Threats: Integrating robust cybersecurity measures alongside functional safety adds another layer of complexity and cost.
Emerging Opportunities in Safety Critical Software Development
Emerging opportunities lie in the burgeoning fields of autonomous systems and artificial intelligence within safety-critical domains. The expansion of connected vehicles and the development of next-generation medical devices present significant untapped markets. The increasing demand for software-defined vehicles, coupled with advancements in AI for predictive maintenance and enhanced driver safety, opens new avenues for specialized development. Furthermore, the integration of safety-critical principles into emerging technologies like drones, advanced robotics, and critical IoT infrastructure offers substantial growth potential. The evolving landscape of edge computing for real-time safety applications also presents innovative development opportunities.
Growth Accelerators in the Safety Critical Software Development Industry
Catalysts driving long-term growth in the safety-critical software development industry include breakthrough advancements in formal verification methodologies, which significantly reduce the risk of software defects. Strategic partnerships between software developers, hardware manufacturers, and regulatory bodies are accelerating the adoption of new safety standards and technologies. Market expansion strategies focused on serving underserved sectors and geographical regions are also key. The increasing adoption of cloud-based development platforms tailored for safety-critical applications and the integration of AI/ML for automated testing and code analysis are further accelerating growth by enhancing efficiency and reducing costs.
Key Players Shaping the Safety Critical Software Development Market
- Ansys
- Parasoft
- Bitwise
- General Digital
- SodiusWillert
- Promenade Software
- Performance
- Critical Software
- Ayesas
- Comatec
- CS Canada
- TES-i
- DDC-I
- Romsoft
- Mercury
- OAKSYS
- Ricardo
Notable Milestones in Safety Critical Software Development Sector
- 2019: Publication of updated guidelines for ISO 26262, emphasizing functional safety in automotive, leading to increased adoption of new development tools.
- 2020: Major advancements in AI-driven code analysis tools, enabling faster and more accurate identification of potential safety hazards.
- 2021: Increased M&A activity as larger tech firms acquired specialized safety-critical software companies to bolster their autonomous driving and medical device portfolios.
- 2022: Significant regulatory focus on cybersecurity integration within safety-critical systems, prompting new development standards and tool requirements.
- 2023: Widespread adoption of Model-Based Systems Engineering (MBSE) across various safety-critical sectors for improved design, simulation, and traceability.
- 2024: Emergence of cloud-native development platforms specifically designed for DO-178C and other safety standards, facilitating collaboration and scalability.
In-Depth Safety Critical Software Development Market Outlook
The future outlook for the safety-critical software development market remains exceptionally bright, driven by an unyielding commitment to safety and the relentless pace of technological innovation. Accelerated adoption of AI and machine learning in verification and validation processes, alongside the pervasive influence of model-based design, will further streamline development cycles and enhance software reliability. Strategic collaborations between industry leaders and innovative startups will unlock new market segments and foster the development of next-generation safety-critical applications. The increasing integration of safety-critical principles into emerging domains like advanced robotics and critical IoT infrastructure signifies substantial future growth potential. Organizations that prioritize continuous learning, adapt to evolving regulatory landscapes, and embrace cutting-edge development methodologies are best positioned to capitalize on the expanding opportunities within this vital sector.
Safety Critical Software Development Segmentation
-
1. Application
- 1.1. Aerospace and Defense
- 1.2. Automotive
- 1.3. Medical Devices
- 1.4. Railway Systems
- 1.5. Energy
- 1.6. Others
-
2. Types
- 2.1. Standard Software
- 2.2. Custom Software
Safety Critical Software Development Segmentation By Geography
-
1. North America
- 1.1. United States
- 1.2. Canada
- 1.3. Mexico
-
2. South America
- 2.1. Brazil
- 2.2. Argentina
- 2.3. Rest of South America
-
3. Europe
- 3.1. United Kingdom
- 3.2. Germany
- 3.3. France
- 3.4. Italy
- 3.5. Spain
- 3.6. Russia
- 3.7. Benelux
- 3.8. Nordics
- 3.9. Rest of Europe
-
4. Middle East & Africa
- 4.1. Turkey
- 4.2. Israel
- 4.3. GCC
- 4.4. North Africa
- 4.5. South Africa
- 4.6. Rest of Middle East & Africa
-
5. Asia Pacific
- 5.1. China
- 5.2. India
- 5.3. Japan
- 5.4. South Korea
- 5.5. ASEAN
- 5.6. Oceania
- 5.7. Rest of Asia Pacific
Safety Critical Software Development Regional Market Share
Geographic Coverage of Safety Critical Software Development
Safety Critical Software Development REPORT HIGHLIGHTS
| Aspects | Details |
|---|---|
| Study Period | 2020-2034 |
| Base Year | 2025 |
| Estimated Year | 2026 |
| Forecast Period | 2026-2034 |
| Historical Period | 2020-2025 |
| Growth Rate | CAGR of 17.3% from 2020-2034 |
| Segmentation |
|
Table of Contents
- 1. Introduction
- 1.1. Research Scope
- 1.2. Market Segmentation
- 1.3. Research Methodology
- 1.4. Definitions and Assumptions
- 2. Executive Summary
- 2.1. Introduction
- 3. Market Dynamics
- 3.1. Introduction
- 3.2. Market Drivers
- 3.3. Market Restrains
- 3.4. Market Trends
- 4. Market Factor Analysis
- 4.1. Porters Five Forces
- 4.2. Supply/Value Chain
- 4.3. PESTEL analysis
- 4.4. Market Entropy
- 4.5. Patent/Trademark Analysis
- 5. Global Safety Critical Software Development Analysis, Insights and Forecast, 2020-2032
- 5.1. Market Analysis, Insights and Forecast - by Application
- 5.1.1. Aerospace and Defense
- 5.1.2. Automotive
- 5.1.3. Medical Devices
- 5.1.4. Railway Systems
- 5.1.5. Energy
- 5.1.6. Others
- 5.2. Market Analysis, Insights and Forecast - by Types
- 5.2.1. Standard Software
- 5.2.2. Custom Software
- 5.3. Market Analysis, Insights and Forecast - by Region
- 5.3.1. North America
- 5.3.2. South America
- 5.3.3. Europe
- 5.3.4. Middle East & Africa
- 5.3.5. Asia Pacific
- 5.1. Market Analysis, Insights and Forecast - by Application
- 6. North America Safety Critical Software Development Analysis, Insights and Forecast, 2020-2032
- 6.1. Market Analysis, Insights and Forecast - by Application
- 6.1.1. Aerospace and Defense
- 6.1.2. Automotive
- 6.1.3. Medical Devices
- 6.1.4. Railway Systems
- 6.1.5. Energy
- 6.1.6. Others
- 6.2. Market Analysis, Insights and Forecast - by Types
- 6.2.1. Standard Software
- 6.2.2. Custom Software
- 6.1. Market Analysis, Insights and Forecast - by Application
- 7. South America Safety Critical Software Development Analysis, Insights and Forecast, 2020-2032
- 7.1. Market Analysis, Insights and Forecast - by Application
- 7.1.1. Aerospace and Defense
- 7.1.2. Automotive
- 7.1.3. Medical Devices
- 7.1.4. Railway Systems
- 7.1.5. Energy
- 7.1.6. Others
- 7.2. Market Analysis, Insights and Forecast - by Types
- 7.2.1. Standard Software
- 7.2.2. Custom Software
- 7.1. Market Analysis, Insights and Forecast - by Application
- 8. Europe Safety Critical Software Development Analysis, Insights and Forecast, 2020-2032
- 8.1. Market Analysis, Insights and Forecast - by Application
- 8.1.1. Aerospace and Defense
- 8.1.2. Automotive
- 8.1.3. Medical Devices
- 8.1.4. Railway Systems
- 8.1.5. Energy
- 8.1.6. Others
- 8.2. Market Analysis, Insights and Forecast - by Types
- 8.2.1. Standard Software
- 8.2.2. Custom Software
- 8.1. Market Analysis, Insights and Forecast - by Application
- 9. Middle East & Africa Safety Critical Software Development Analysis, Insights and Forecast, 2020-2032
- 9.1. Market Analysis, Insights and Forecast - by Application
- 9.1.1. Aerospace and Defense
- 9.1.2. Automotive
- 9.1.3. Medical Devices
- 9.1.4. Railway Systems
- 9.1.5. Energy
- 9.1.6. Others
- 9.2. Market Analysis, Insights and Forecast - by Types
- 9.2.1. Standard Software
- 9.2.2. Custom Software
- 9.1. Market Analysis, Insights and Forecast - by Application
- 10. Asia Pacific Safety Critical Software Development Analysis, Insights and Forecast, 2020-2032
- 10.1. Market Analysis, Insights and Forecast - by Application
- 10.1.1. Aerospace and Defense
- 10.1.2. Automotive
- 10.1.3. Medical Devices
- 10.1.4. Railway Systems
- 10.1.5. Energy
- 10.1.6. Others
- 10.2. Market Analysis, Insights and Forecast - by Types
- 10.2.1. Standard Software
- 10.2.2. Custom Software
- 10.1. Market Analysis, Insights and Forecast - by Application
- 11. Competitive Analysis
- 11.1. Global Market Share Analysis 2025
- 11.2. Company Profiles
- 11.2.1 Bitwise
- 11.2.1.1. Overview
- 11.2.1.2. Products
- 11.2.1.3. SWOT Analysis
- 11.2.1.4. Recent Developments
- 11.2.1.5. Financials (Based on Availability)
- 11.2.2 General Digital
- 11.2.2.1. Overview
- 11.2.2.2. Products
- 11.2.2.3. SWOT Analysis
- 11.2.2.4. Recent Developments
- 11.2.2.5. Financials (Based on Availability)
- 11.2.3 SodiusWillert
- 11.2.3.1. Overview
- 11.2.3.2. Products
- 11.2.3.3. SWOT Analysis
- 11.2.3.4. Recent Developments
- 11.2.3.5. Financials (Based on Availability)
- 11.2.4 Promenade Software
- 11.2.4.1. Overview
- 11.2.4.2. Products
- 11.2.4.3. SWOT Analysis
- 11.2.4.4. Recent Developments
- 11.2.4.5. Financials (Based on Availability)
- 11.2.5 Ansys
- 11.2.5.1. Overview
- 11.2.5.2. Products
- 11.2.5.3. SWOT Analysis
- 11.2.5.4. Recent Developments
- 11.2.5.5. Financials (Based on Availability)
- 11.2.6 Parasoft
- 11.2.6.1. Overview
- 11.2.6.2. Products
- 11.2.6.3. SWOT Analysis
- 11.2.6.4. Recent Developments
- 11.2.6.5. Financials (Based on Availability)
- 11.2.7 Performance
- 11.2.7.1. Overview
- 11.2.7.2. Products
- 11.2.7.3. SWOT Analysis
- 11.2.7.4. Recent Developments
- 11.2.7.5. Financials (Based on Availability)
- 11.2.8 Critical Software
- 11.2.8.1. Overview
- 11.2.8.2. Products
- 11.2.8.3. SWOT Analysis
- 11.2.8.4. Recent Developments
- 11.2.8.5. Financials (Based on Availability)
- 11.2.9 Ayesas
- 11.2.9.1. Overview
- 11.2.9.2. Products
- 11.2.9.3. SWOT Analysis
- 11.2.9.4. Recent Developments
- 11.2.9.5. Financials (Based on Availability)
- 11.2.10 Comatec
- 11.2.10.1. Overview
- 11.2.10.2. Products
- 11.2.10.3. SWOT Analysis
- 11.2.10.4. Recent Developments
- 11.2.10.5. Financials (Based on Availability)
- 11.2.11 CS Canada
- 11.2.11.1. Overview
- 11.2.11.2. Products
- 11.2.11.3. SWOT Analysis
- 11.2.11.4. Recent Developments
- 11.2.11.5. Financials (Based on Availability)
- 11.2.12 TES-i
- 11.2.12.1. Overview
- 11.2.12.2. Products
- 11.2.12.3. SWOT Analysis
- 11.2.12.4. Recent Developments
- 11.2.12.5. Financials (Based on Availability)
- 11.2.13 DDC-I
- 11.2.13.1. Overview
- 11.2.13.2. Products
- 11.2.13.3. SWOT Analysis
- 11.2.13.4. Recent Developments
- 11.2.13.5. Financials (Based on Availability)
- 11.2.14 Romsoft
- 11.2.14.1. Overview
- 11.2.14.2. Products
- 11.2.14.3. SWOT Analysis
- 11.2.14.4. Recent Developments
- 11.2.14.5. Financials (Based on Availability)
- 11.2.15 Mercury
- 11.2.15.1. Overview
- 11.2.15.2. Products
- 11.2.15.3. SWOT Analysis
- 11.2.15.4. Recent Developments
- 11.2.15.5. Financials (Based on Availability)
- 11.2.16 OAKSYS
- 11.2.16.1. Overview
- 11.2.16.2. Products
- 11.2.16.3. SWOT Analysis
- 11.2.16.4. Recent Developments
- 11.2.16.5. Financials (Based on Availability)
- 11.2.17 Ricardo
- 11.2.17.1. Overview
- 11.2.17.2. Products
- 11.2.17.3. SWOT Analysis
- 11.2.17.4. Recent Developments
- 11.2.17.5. Financials (Based on Availability)
- 11.2.1 Bitwise
List of Figures
- Figure 1: Global Safety Critical Software Development Revenue Breakdown (billion, %) by Region 2025 & 2033
- Figure 2: North America Safety Critical Software Development Revenue (billion), by Application 2025 & 2033
- Figure 3: North America Safety Critical Software Development Revenue Share (%), by Application 2025 & 2033
- Figure 4: North America Safety Critical Software Development Revenue (billion), by Types 2025 & 2033
- Figure 5: North America Safety Critical Software Development Revenue Share (%), by Types 2025 & 2033
- Figure 6: North America Safety Critical Software Development Revenue (billion), by Country 2025 & 2033
- Figure 7: North America Safety Critical Software Development Revenue Share (%), by Country 2025 & 2033
- Figure 8: South America Safety Critical Software Development Revenue (billion), by Application 2025 & 2033
- Figure 9: South America Safety Critical Software Development Revenue Share (%), by Application 2025 & 2033
- Figure 10: South America Safety Critical Software Development Revenue (billion), by Types 2025 & 2033
- Figure 11: South America Safety Critical Software Development Revenue Share (%), by Types 2025 & 2033
- Figure 12: South America Safety Critical Software Development Revenue (billion), by Country 2025 & 2033
- Figure 13: South America Safety Critical Software Development Revenue Share (%), by Country 2025 & 2033
- Figure 14: Europe Safety Critical Software Development Revenue (billion), by Application 2025 & 2033
- Figure 15: Europe Safety Critical Software Development Revenue Share (%), by Application 2025 & 2033
- Figure 16: Europe Safety Critical Software Development Revenue (billion), by Types 2025 & 2033
- Figure 17: Europe Safety Critical Software Development Revenue Share (%), by Types 2025 & 2033
- Figure 18: Europe Safety Critical Software Development Revenue (billion), by Country 2025 & 2033
- Figure 19: Europe Safety Critical Software Development Revenue Share (%), by Country 2025 & 2033
- Figure 20: Middle East & Africa Safety Critical Software Development Revenue (billion), by Application 2025 & 2033
- Figure 21: Middle East & Africa Safety Critical Software Development Revenue Share (%), by Application 2025 & 2033
- Figure 22: Middle East & Africa Safety Critical Software Development Revenue (billion), by Types 2025 & 2033
- Figure 23: Middle East & Africa Safety Critical Software Development Revenue Share (%), by Types 2025 & 2033
- Figure 24: Middle East & Africa Safety Critical Software Development Revenue (billion), by Country 2025 & 2033
- Figure 25: Middle East & Africa Safety Critical Software Development Revenue Share (%), by Country 2025 & 2033
- Figure 26: Asia Pacific Safety Critical Software Development Revenue (billion), by Application 2025 & 2033
- Figure 27: Asia Pacific Safety Critical Software Development Revenue Share (%), by Application 2025 & 2033
- Figure 28: Asia Pacific Safety Critical Software Development Revenue (billion), by Types 2025 & 2033
- Figure 29: Asia Pacific Safety Critical Software Development Revenue Share (%), by Types 2025 & 2033
- Figure 30: Asia Pacific Safety Critical Software Development Revenue (billion), by Country 2025 & 2033
- Figure 31: Asia Pacific Safety Critical Software Development Revenue Share (%), by Country 2025 & 2033
List of Tables
- Table 1: Global Safety Critical Software Development Revenue billion Forecast, by Application 2020 & 2033
- Table 2: Global Safety Critical Software Development Revenue billion Forecast, by Types 2020 & 2033
- Table 3: Global Safety Critical Software Development Revenue billion Forecast, by Region 2020 & 2033
- Table 4: Global Safety Critical Software Development Revenue billion Forecast, by Application 2020 & 2033
- Table 5: Global Safety Critical Software Development Revenue billion Forecast, by Types 2020 & 2033
- Table 6: Global Safety Critical Software Development Revenue billion Forecast, by Country 2020 & 2033
- Table 7: United States Safety Critical Software Development Revenue (billion) Forecast, by Application 2020 & 2033
- Table 8: Canada Safety Critical Software Development Revenue (billion) Forecast, by Application 2020 & 2033
- Table 9: Mexico Safety Critical Software Development Revenue (billion) Forecast, by Application 2020 & 2033
- Table 10: Global Safety Critical Software Development Revenue billion Forecast, by Application 2020 & 2033
- Table 11: Global Safety Critical Software Development Revenue billion Forecast, by Types 2020 & 2033
- Table 12: Global Safety Critical Software Development Revenue billion Forecast, by Country 2020 & 2033
- Table 13: Brazil Safety Critical Software Development Revenue (billion) Forecast, by Application 2020 & 2033
- Table 14: Argentina Safety Critical Software Development Revenue (billion) Forecast, by Application 2020 & 2033
- Table 15: Rest of South America Safety Critical Software Development Revenue (billion) Forecast, by Application 2020 & 2033
- Table 16: Global Safety Critical Software Development Revenue billion Forecast, by Application 2020 & 2033
- Table 17: Global Safety Critical Software Development Revenue billion Forecast, by Types 2020 & 2033
- Table 18: Global Safety Critical Software Development Revenue billion Forecast, by Country 2020 & 2033
- Table 19: United Kingdom Safety Critical Software Development Revenue (billion) Forecast, by Application 2020 & 2033
- Table 20: Germany Safety Critical Software Development Revenue (billion) Forecast, by Application 2020 & 2033
- Table 21: France Safety Critical Software Development Revenue (billion) Forecast, by Application 2020 & 2033
- Table 22: Italy Safety Critical Software Development Revenue (billion) Forecast, by Application 2020 & 2033
- Table 23: Spain Safety Critical Software Development Revenue (billion) Forecast, by Application 2020 & 2033
- Table 24: Russia Safety Critical Software Development Revenue (billion) Forecast, by Application 2020 & 2033
- Table 25: Benelux Safety Critical Software Development Revenue (billion) Forecast, by Application 2020 & 2033
- Table 26: Nordics Safety Critical Software Development Revenue (billion) Forecast, by Application 2020 & 2033
- Table 27: Rest of Europe Safety Critical Software Development Revenue (billion) Forecast, by Application 2020 & 2033
- Table 28: Global Safety Critical Software Development Revenue billion Forecast, by Application 2020 & 2033
- Table 29: Global Safety Critical Software Development Revenue billion Forecast, by Types 2020 & 2033
- Table 30: Global Safety Critical Software Development Revenue billion Forecast, by Country 2020 & 2033
- Table 31: Turkey Safety Critical Software Development Revenue (billion) Forecast, by Application 2020 & 2033
- Table 32: Israel Safety Critical Software Development Revenue (billion) Forecast, by Application 2020 & 2033
- Table 33: GCC Safety Critical Software Development Revenue (billion) Forecast, by Application 2020 & 2033
- Table 34: North Africa Safety Critical Software Development Revenue (billion) Forecast, by Application 2020 & 2033
- Table 35: South Africa Safety Critical Software Development Revenue (billion) Forecast, by Application 2020 & 2033
- Table 36: Rest of Middle East & Africa Safety Critical Software Development Revenue (billion) Forecast, by Application 2020 & 2033
- Table 37: Global Safety Critical Software Development Revenue billion Forecast, by Application 2020 & 2033
- Table 38: Global Safety Critical Software Development Revenue billion Forecast, by Types 2020 & 2033
- Table 39: Global Safety Critical Software Development Revenue billion Forecast, by Country 2020 & 2033
- Table 40: China Safety Critical Software Development Revenue (billion) Forecast, by Application 2020 & 2033
- Table 41: India Safety Critical Software Development Revenue (billion) Forecast, by Application 2020 & 2033
- Table 42: Japan Safety Critical Software Development Revenue (billion) Forecast, by Application 2020 & 2033
- Table 43: South Korea Safety Critical Software Development Revenue (billion) Forecast, by Application 2020 & 2033
- Table 44: ASEAN Safety Critical Software Development Revenue (billion) Forecast, by Application 2020 & 2033
- Table 45: Oceania Safety Critical Software Development Revenue (billion) Forecast, by Application 2020 & 2033
- Table 46: Rest of Asia Pacific Safety Critical Software Development Revenue (billion) Forecast, by Application 2020 & 2033
Frequently Asked Questions
1. What is the projected Compound Annual Growth Rate (CAGR) of the Safety Critical Software Development?
The projected CAGR is approximately 17.3%.
2. Which companies are prominent players in the Safety Critical Software Development?
Key companies in the market include Bitwise, General Digital, SodiusWillert, Promenade Software, Ansys, Parasoft, Performance, Critical Software, Ayesas, Comatec, CS Canada, TES-i, DDC-I, Romsoft, Mercury, OAKSYS, Ricardo.
3. What are the main segments of the Safety Critical Software Development?
The market segments include Application, Types.
4. Can you provide details about the market size?
The market size is estimated to be USD 44.2 billion as of 2022.
5. What are some drivers contributing to market growth?
N/A
6. What are the notable trends driving market growth?
N/A
7. Are there any restraints impacting market growth?
N/A
8. Can you provide examples of recent developments in the market?
N/A
9. What pricing options are available for accessing the report?
Pricing options include single-user, multi-user, and enterprise licenses priced at USD 2900.00, USD 4350.00, and USD 5800.00 respectively.
10. Is the market size provided in terms of value or volume?
The market size is provided in terms of value, measured in billion.
11. Are there any specific market keywords associated with the report?
Yes, the market keyword associated with the report is "Safety Critical Software Development," which aids in identifying and referencing the specific market segment covered.
12. How do I determine which pricing option suits my needs best?
The pricing options vary based on user requirements and access needs. Individual users may opt for single-user licenses, while businesses requiring broader access may choose multi-user or enterprise licenses for cost-effective access to the report.
13. Are there any additional resources or data provided in the Safety Critical Software Development report?
While the report offers comprehensive insights, it's advisable to review the specific contents or supplementary materials provided to ascertain if additional resources or data are available.
14. How can I stay updated on further developments or reports in the Safety Critical Software Development?
To stay informed about further developments, trends, and reports in the Safety Critical Software Development, consider subscribing to industry newsletters, following relevant companies and organizations, or regularly checking reputable industry news sources and publications.
Methodology
Step 1 - Identification of Relevant Samples Size from Population Database


Step 2 - Approaches for Defining Global Market Size (Value, Volume* & Price*)

Note*: In applicable scenarios
Step 3 - Data Sources
Primary Research
- Web Analytics
- Survey Reports
- Research Institute
- Latest Research Reports
- Opinion Leaders
Secondary Research
- Annual Reports
- White Paper
- Latest Press Release
- Industry Association
- Paid Database
- Investor Presentations

Step 4 - Data Triangulation
Involves using different sources of information in order to increase the validity of a study
These sources are likely to be stakeholders in a program - participants, other researchers, program staff, other community members, and so on.
Then we put all data in single framework & apply various statistical tools to find out the dynamic on the market.
During the analysis stage, feedback from the stakeholder groups would be compared to determine areas of agreement as well as areas of divergence