

Key Insights
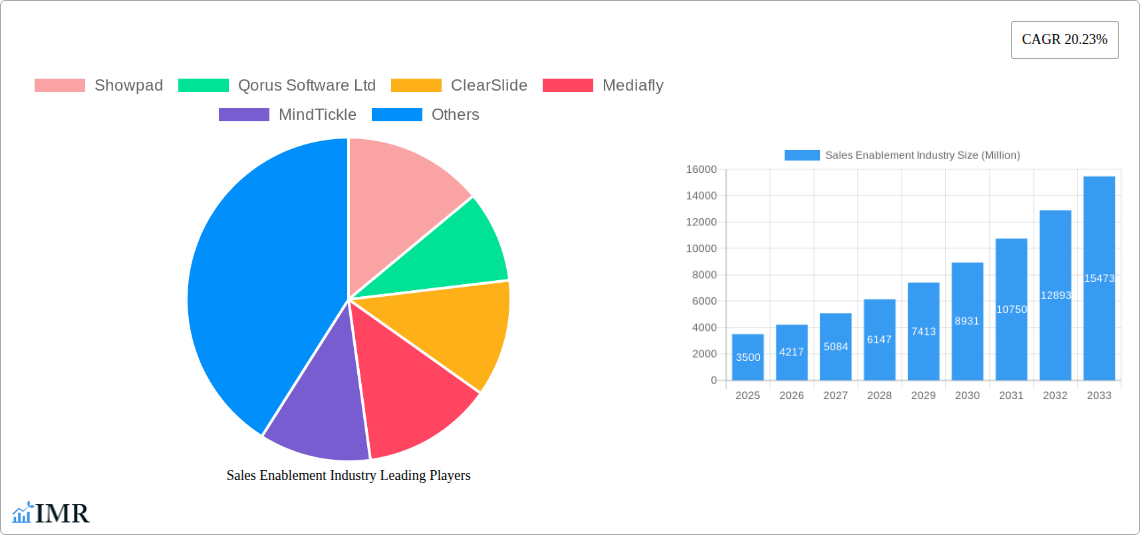
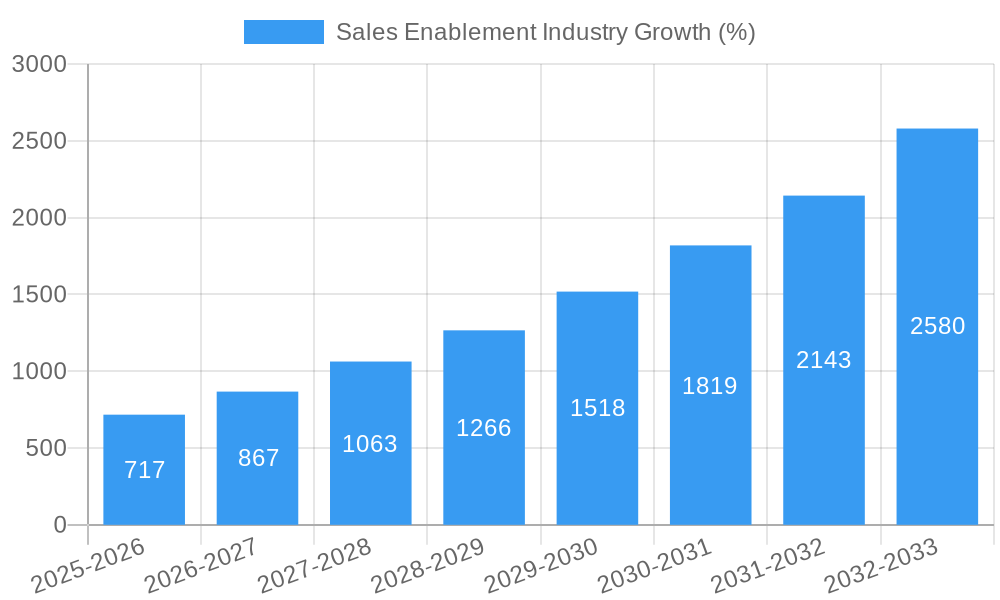
The global Sales Enablement market, valued at $3.5 billion in 2025, is experiencing robust growth, projected to expand at a Compound Annual Growth Rate (CAGR) of 20.23% from 2025 to 2033. This rapid expansion is driven by several key factors. The increasing need for improved sales productivity and enhanced customer experiences is pushing businesses to adopt sophisticated sales enablement solutions. Furthermore, the rise of digital transformation initiatives across various industries, including BFSI, retail, and healthcare, is fueling demand for cloud-based sales enablement platforms that offer scalability, accessibility, and real-time data analytics. The integration of AI and machine learning into sales enablement tools is also a significant driver, enabling more effective sales training, content personalization, and predictive analytics. The market is segmented by component (platform and services), organization size (large enterprises and SMEs), deployment mode (cloud-based and on-premises), and end-user industry. Cloud-based solutions dominate the deployment mode segment due to their flexibility and cost-effectiveness. Large enterprises represent a significant portion of the market due to their higher budgets and complex sales processes.
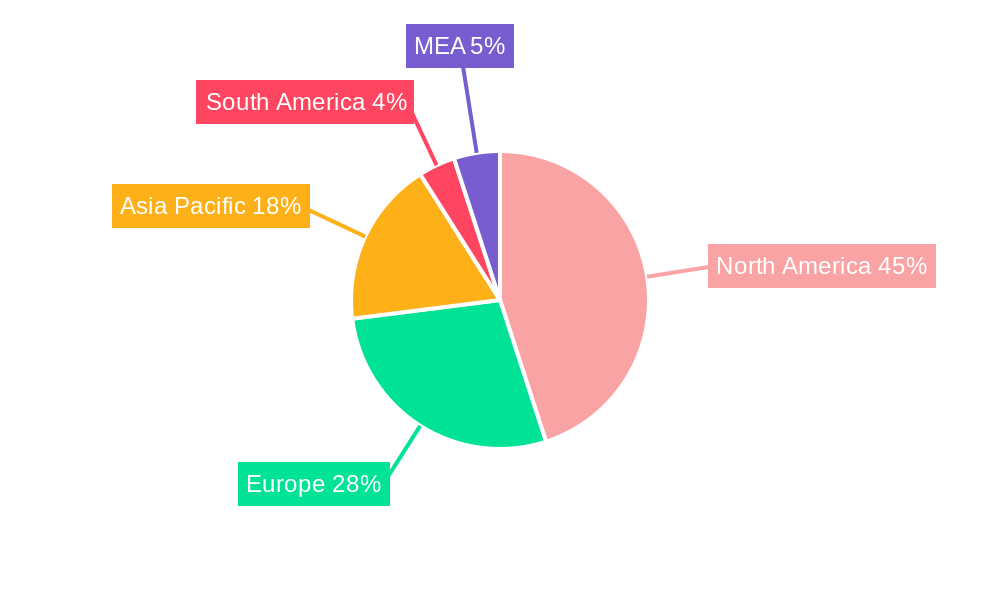
The competitive landscape is characterized by a mix of established players and emerging startups, each offering unique strengths in terms of functionality, pricing, and target market. North America currently holds the largest market share, driven by early adoption of advanced technologies and strong digital infrastructure. However, the Asia-Pacific region is poised for significant growth in the coming years, fueled by increasing digitalization and rising investments in sales enablement technologies. While the market faces certain restraints such as high initial investment costs and integration complexities, the overall growth trajectory remains highly positive. The continued focus on improving sales performance metrics, personalized customer interactions, and data-driven decision-making will continue to propel the expansion of the sales enablement market. The forecast period suggests a substantial market expansion, with increasing adoption across various industry sectors and geographies.
Sales Enablement Industry Market Report: 2019-2033
This comprehensive report provides an in-depth analysis of the Sales Enablement market, encompassing market dynamics, growth trends, regional analysis, product landscape, key players, and future outlook. The study period covers 2019-2033, with 2025 as the base and estimated year. The report is crucial for industry professionals, investors, and strategists seeking a clear understanding of this rapidly evolving sector. The market is segmented by component (Platform, Services), organization size (Large Enterprises, Small and Medium-Sized Enterprises), deployment mode (Cloud-based, On-premises), and end-user industry (BFSI, Consumer Goods and Retail, IT and Telecom, Media and Entertainment, Healthcare and Life Sciences, Manufacturing, Other). The total market size is projected to reach xx Million by 2033.
Sales Enablement Industry Market Dynamics & Structure
The Sales Enablement market is characterized by moderate concentration, with several key players vying for market share. Technological innovation, particularly in AI and automation, is a significant driver, while regulatory frameworks concerning data privacy and security influence market practices. Competitive substitutes include traditional sales training methods and CRM systems with integrated sales tools. The end-user demographic is broad, encompassing enterprises of all sizes across diverse industries. M&A activity has been notable, reflecting consolidation and expansion strategies within the sector. In the historical period (2019-2024), an estimated xx Million worth of M&A deals occurred, with a projected increase to xx Million during the forecast period (2025-2033).
- Market Concentration: Moderately concentrated, with top 5 players holding approximately xx% market share in 2024.
- Technological Innovation: AI-powered content personalization, sales coaching platforms, and gamified learning experiences drive growth.
- Regulatory Frameworks: GDPR, CCPA, and other data privacy regulations impact data usage and vendor compliance.
- Competitive Substitutes: Traditional training, CRM functionalities, and generic sales tools pose competition.
- End-User Demographics: Diverse range of enterprises across various sectors, including BFSI, Retail, and Technology.
- M&A Trends: Increasing consolidation, with larger players acquiring smaller firms to expand capabilities and market reach.
Sales Enablement Industry Growth Trends & Insights
The global Sales Enablement market experienced substantial growth during the historical period (2019-2024), driven by increasing demand for improved sales productivity and enhanced customer experiences. The market is projected to maintain robust growth during the forecast period (2025-2033), fueled by the ongoing adoption of cloud-based solutions, the integration of AI and machine learning, and the growing demand for personalized sales experiences. The CAGR is estimated at xx% during 2025-2033, with market penetration expected to increase from xx% in 2024 to xx% by 2033. This growth is further boosted by the shift towards digital sales strategies and the need for data-driven insights to optimize sales performance. Increasing adoption among SMEs is also driving significant growth.
Dominant Regions, Countries, or Segments in Sales Enablement Industry
North America currently holds the largest market share in the Sales Enablement industry, driven by high technology adoption rates and the presence of major players. However, the Asia-Pacific region is projected to witness significant growth in the coming years, fueled by increasing digitalization and economic expansion. Within segments, the Cloud-based deployment mode dominates, reflecting the preference for scalability, accessibility, and cost-effectiveness. Large Enterprises represent a substantial segment, given their greater resources and higher need for advanced sales enablement capabilities. BFSI, IT & Telecom and Consumer Goods and Retail sectors show the highest adoption rates.
- Key Drivers: Increased digital transformation initiatives, rising investments in sales technology, and supportive government policies.
- Dominance Factors: Early adoption, strong technological infrastructure, and presence of major players contribute to North America's market leadership.
- Growth Potential: Asia-Pacific presents significant growth opportunities due to rapid technological advancements and expanding business activities.
- Segment Dominance: Cloud-based solutions lead due to flexibility and cost-effectiveness; Large Enterprises contribute significantly due to higher budgets and complex sales processes.
Sales Enablement Industry Product Landscape
The Sales Enablement product landscape is characterized by a diverse range of platforms and services, including content management systems, sales training platforms, sales performance management tools, and analytics dashboards. Recent innovations encompass AI-powered content personalization, gamified learning modules, and advanced analytics capabilities designed to provide insights into sales performance and drive improvements. These solutions offer unique selling propositions such as improved sales productivity, enhanced team collaboration, and data-driven decision-making. Key technological advancements include integration with CRM systems, mobile accessibility, and the use of machine learning algorithms for sales forecasting and personalized content delivery.
Key Drivers, Barriers & Challenges in Sales Enablement Industry
Key Drivers:
- Growing demand for improved sales productivity and efficiency.
- Increased adoption of cloud-based solutions and digital sales strategies.
- Technological advancements in AI, machine learning, and big data analytics.
- Growing need for data-driven insights to optimize sales performance.
Key Challenges & Restraints:
- High initial investment costs for implementation and integration.
- Difficulty in integrating with existing sales systems and processes.
- Concerns regarding data security and privacy.
- Lack of skilled personnel to manage and utilize sales enablement platforms effectively.
Emerging Opportunities in Sales Enablement Industry
- Expanding into untapped markets in developing economies.
- Developing specialized solutions for niche industries and segments.
- Leveraging emerging technologies such as AR/VR for immersive sales training.
- Integrating sales enablement solutions with other business applications and platforms.
Growth Accelerators in the Sales Enablement Industry
Continued technological innovation, strategic partnerships between sales enablement vendors and other technology providers, and expansion into new geographical markets will significantly drive long-term growth within the sales enablement sector. The increasing demand for data-driven insights and the rising adoption of cloud-based solutions will also play a crucial role in fueling market expansion.
Key Players Shaping the Sales Enablement Industry Market
- Showpad
- Qorus Software Ltd
- ClearSlide
- Mediafly
- MindTickle
- Rallyware Inc
- Accent Technologies
- Seismic Software Inc
- Highspot Inc
- Quark
- DocSend Inc
- Upland Software
- GetAccept Inc
- Pitcher
- Brainshark
- Bigtincan Holdings
- Qstream Inc
- Outreach
Notable Milestones in Sales Enablement Industry Sector
- February 2022: Semrush acquires Kompyte, expanding its capabilities in competitive intelligence and sales enablement.
- March 2022: Ceros partners with Highspot and Showpad, creating an integrated suite for interactive content design.
In-Depth Sales Enablement Industry Market Outlook
The future of the Sales Enablement market is bright, with continued growth projected across all segments. Technological advancements, strategic partnerships, and increasing adoption of cloud-based solutions will drive market expansion. Companies that can leverage data-driven insights to personalize sales experiences and improve sales productivity will be well-positioned for success in this dynamic market. The focus will remain on enhancing sales efficiency, improving team collaboration, and providing data-driven decision-making capabilities to sales organizations of all sizes.
Sales Enablement Industry Segmentation
-
1. Component
- 1.1. Platform
- 1.2. Services
-
2. Organization Size
- 2.1. Large Enterprises
- 2.2. Small and Medium-Sized Enterprises
-
3. Deployment Mode
- 3.1. Cloud-based
- 3.2. On-premises
-
4. End-user Industry
- 4.1. BFSI
- 4.2. Consumer Goods and Retail
- 4.3. IT and Telecom
- 4.4. Media and Entertainment
- 4.5. Healthcare and Life Sciences
- 4.6. Manufacturing
- 4.7. Other End-user Industries
Sales Enablement Industry Segmentation By Geography
- 1. North America
- 2. Europe
- 3. Asia Pacific
- 4. Latin America
- 5. Middle East and Africa
Sales Enablement Industry REPORT HIGHLIGHTS
| Aspects | Details |
|---|---|
| Study Period | 2019-2033 |
| Base Year | 2024 |
| Estimated Year | 2025 |
| Forecast Period | 2025-2033 |
| Historical Period | 2019-2024 |
| Growth Rate | CAGR of 20.23% from 2019-2033 |
| Segmentation |
|
Table of Contents
- 1. Introduction
- 1.1. Research Scope
- 1.2. Market Segmentation
- 1.3. Research Methodology
- 1.4. Definitions and Assumptions
- 2. Executive Summary
- 2.1. Introduction
- 3. Market Dynamics
- 3.1. Introduction
- 3.2. Market Drivers
- 3.2.1. Rising Need to Improve the Internal Business Process; Scaling Sales Efforts With the Help of Advanced Technology
- 3.3. Market Restrains
- 3.3.1. Inconsistent User Experience Across Various Access Channels
- 3.4. Market Trends
- 3.4.1. Consumer Goods and Retail Industry to Exhibit Significant Growth
- 4. Market Factor Analysis
- 4.1. Porters Five Forces
- 4.2. Supply/Value Chain
- 4.3. PESTEL analysis
- 4.4. Market Entropy
- 4.5. Patent/Trademark Analysis
- 5. Global Sales Enablement Industry Analysis, Insights and Forecast, 2019-2031
- 5.1. Market Analysis, Insights and Forecast - by Component
- 5.1.1. Platform
- 5.1.2. Services
- 5.2. Market Analysis, Insights and Forecast - by Organization Size
- 5.2.1. Large Enterprises
- 5.2.2. Small and Medium-Sized Enterprises
- 5.3. Market Analysis, Insights and Forecast - by Deployment Mode
- 5.3.1. Cloud-based
- 5.3.2. On-premises
- 5.4. Market Analysis, Insights and Forecast - by End-user Industry
- 5.4.1. BFSI
- 5.4.2. Consumer Goods and Retail
- 5.4.3. IT and Telecom
- 5.4.4. Media and Entertainment
- 5.4.5. Healthcare and Life Sciences
- 5.4.6. Manufacturing
- 5.4.7. Other End-user Industries
- 5.5. Market Analysis, Insights and Forecast - by Region
- 5.5.1. North America
- 5.5.2. Europe
- 5.5.3. Asia Pacific
- 5.5.4. Latin America
- 5.5.5. Middle East and Africa
- 5.1. Market Analysis, Insights and Forecast - by Component
- 6. North America Sales Enablement Industry Analysis, Insights and Forecast, 2019-2031
- 6.1. Market Analysis, Insights and Forecast - by Component
- 6.1.1. Platform
- 6.1.2. Services
- 6.2. Market Analysis, Insights and Forecast - by Organization Size
- 6.2.1. Large Enterprises
- 6.2.2. Small and Medium-Sized Enterprises
- 6.3. Market Analysis, Insights and Forecast - by Deployment Mode
- 6.3.1. Cloud-based
- 6.3.2. On-premises
- 6.4. Market Analysis, Insights and Forecast - by End-user Industry
- 6.4.1. BFSI
- 6.4.2. Consumer Goods and Retail
- 6.4.3. IT and Telecom
- 6.4.4. Media and Entertainment
- 6.4.5. Healthcare and Life Sciences
- 6.4.6. Manufacturing
- 6.4.7. Other End-user Industries
- 6.1. Market Analysis, Insights and Forecast - by Component
- 7. Europe Sales Enablement Industry Analysis, Insights and Forecast, 2019-2031
- 7.1. Market Analysis, Insights and Forecast - by Component
- 7.1.1. Platform
- 7.1.2. Services
- 7.2. Market Analysis, Insights and Forecast - by Organization Size
- 7.2.1. Large Enterprises
- 7.2.2. Small and Medium-Sized Enterprises
- 7.3. Market Analysis, Insights and Forecast - by Deployment Mode
- 7.3.1. Cloud-based
- 7.3.2. On-premises
- 7.4. Market Analysis, Insights and Forecast - by End-user Industry
- 7.4.1. BFSI
- 7.4.2. Consumer Goods and Retail
- 7.4.3. IT and Telecom
- 7.4.4. Media and Entertainment
- 7.4.5. Healthcare and Life Sciences
- 7.4.6. Manufacturing
- 7.4.7. Other End-user Industries
- 7.1. Market Analysis, Insights and Forecast - by Component
- 8. Asia Pacific Sales Enablement Industry Analysis, Insights and Forecast, 2019-2031
- 8.1. Market Analysis, Insights and Forecast - by Component
- 8.1.1. Platform
- 8.1.2. Services
- 8.2. Market Analysis, Insights and Forecast - by Organization Size
- 8.2.1. Large Enterprises
- 8.2.2. Small and Medium-Sized Enterprises
- 8.3. Market Analysis, Insights and Forecast - by Deployment Mode
- 8.3.1. Cloud-based
- 8.3.2. On-premises
- 8.4. Market Analysis, Insights and Forecast - by End-user Industry
- 8.4.1. BFSI
- 8.4.2. Consumer Goods and Retail
- 8.4.3. IT and Telecom
- 8.4.4. Media and Entertainment
- 8.4.5. Healthcare and Life Sciences
- 8.4.6. Manufacturing
- 8.4.7. Other End-user Industries
- 8.1. Market Analysis, Insights and Forecast - by Component
- 9. Latin America Sales Enablement Industry Analysis, Insights and Forecast, 2019-2031
- 9.1. Market Analysis, Insights and Forecast - by Component
- 9.1.1. Platform
- 9.1.2. Services
- 9.2. Market Analysis, Insights and Forecast - by Organization Size
- 9.2.1. Large Enterprises
- 9.2.2. Small and Medium-Sized Enterprises
- 9.3. Market Analysis, Insights and Forecast - by Deployment Mode
- 9.3.1. Cloud-based
- 9.3.2. On-premises
- 9.4. Market Analysis, Insights and Forecast - by End-user Industry
- 9.4.1. BFSI
- 9.4.2. Consumer Goods and Retail
- 9.4.3. IT and Telecom
- 9.4.4. Media and Entertainment
- 9.4.5. Healthcare and Life Sciences
- 9.4.6. Manufacturing
- 9.4.7. Other End-user Industries
- 9.1. Market Analysis, Insights and Forecast - by Component
- 10. Middle East and Africa Sales Enablement Industry Analysis, Insights and Forecast, 2019-2031
- 10.1. Market Analysis, Insights and Forecast - by Component
- 10.1.1. Platform
- 10.1.2. Services
- 10.2. Market Analysis, Insights and Forecast - by Organization Size
- 10.2.1. Large Enterprises
- 10.2.2. Small and Medium-Sized Enterprises
- 10.3. Market Analysis, Insights and Forecast - by Deployment Mode
- 10.3.1. Cloud-based
- 10.3.2. On-premises
- 10.4. Market Analysis, Insights and Forecast - by End-user Industry
- 10.4.1. BFSI
- 10.4.2. Consumer Goods and Retail
- 10.4.3. IT and Telecom
- 10.4.4. Media and Entertainment
- 10.4.5. Healthcare and Life Sciences
- 10.4.6. Manufacturing
- 10.4.7. Other End-user Industries
- 10.1. Market Analysis, Insights and Forecast - by Component
- 11. North America Sales Enablement Industry Analysis, Insights and Forecast, 2019-2031
- 11.1. Market Analysis, Insights and Forecast - By Country/Sub-region
- 11.1.1 United States
- 11.1.2 Canada
- 11.1.3 Mexico
- 12. Europe Sales Enablement Industry Analysis, Insights and Forecast, 2019-2031
- 12.1. Market Analysis, Insights and Forecast - By Country/Sub-region
- 12.1.1 Germany
- 12.1.2 United Kingdom
- 12.1.3 France
- 12.1.4 Spain
- 12.1.5 Italy
- 12.1.6 Spain
- 12.1.7 Belgium
- 12.1.8 Netherland
- 12.1.9 Nordics
- 12.1.10 Rest of Europe
- 13. Asia Pacific Sales Enablement Industry Analysis, Insights and Forecast, 2019-2031
- 13.1. Market Analysis, Insights and Forecast - By Country/Sub-region
- 13.1.1 China
- 13.1.2 Japan
- 13.1.3 India
- 13.1.4 South Korea
- 13.1.5 Southeast Asia
- 13.1.6 Australia
- 13.1.7 Indonesia
- 13.1.8 Phillipes
- 13.1.9 Singapore
- 13.1.10 Thailandc
- 13.1.11 Rest of Asia Pacific
- 14. South America Sales Enablement Industry Analysis, Insights and Forecast, 2019-2031
- 14.1. Market Analysis, Insights and Forecast - By Country/Sub-region
- 14.1.1 Brazil
- 14.1.2 Argentina
- 14.1.3 Peru
- 14.1.4 Chile
- 14.1.5 Colombia
- 14.1.6 Ecuador
- 14.1.7 Venezuela
- 14.1.8 Rest of South America
- 15. North America Sales Enablement Industry Analysis, Insights and Forecast, 2019-2031
- 15.1. Market Analysis, Insights and Forecast - By Country/Sub-region
- 15.1.1 United States
- 15.1.2 Canada
- 15.1.3 Mexico
- 16. MEA Sales Enablement Industry Analysis, Insights and Forecast, 2019-2031
- 16.1. Market Analysis, Insights and Forecast - By Country/Sub-region
- 16.1.1 United Arab Emirates
- 16.1.2 Saudi Arabia
- 16.1.3 South Africa
- 16.1.4 Rest of Middle East and Africa
- 17. Competitive Analysis
- 17.1. Global Market Share Analysis 2024
- 17.2. Company Profiles
- 17.2.1 Showpad
- 17.2.1.1. Overview
- 17.2.1.2. Products
- 17.2.1.3. SWOT Analysis
- 17.2.1.4. Recent Developments
- 17.2.1.5. Financials (Based on Availability)
- 17.2.2 Qorus Software Ltd
- 17.2.2.1. Overview
- 17.2.2.2. Products
- 17.2.2.3. SWOT Analysis
- 17.2.2.4. Recent Developments
- 17.2.2.5. Financials (Based on Availability)
- 17.2.3 ClearSlide
- 17.2.3.1. Overview
- 17.2.3.2. Products
- 17.2.3.3. SWOT Analysis
- 17.2.3.4. Recent Developments
- 17.2.3.5. Financials (Based on Availability)
- 17.2.4 Mediafly
- 17.2.4.1. Overview
- 17.2.4.2. Products
- 17.2.4.3. SWOT Analysis
- 17.2.4.4. Recent Developments
- 17.2.4.5. Financials (Based on Availability)
- 17.2.5 MindTickle
- 17.2.5.1. Overview
- 17.2.5.2. Products
- 17.2.5.3. SWOT Analysis
- 17.2.5.4. Recent Developments
- 17.2.5.5. Financials (Based on Availability)
- 17.2.6 Rallyware Inc
- 17.2.6.1. Overview
- 17.2.6.2. Products
- 17.2.6.3. SWOT Analysis
- 17.2.6.4. Recent Developments
- 17.2.6.5. Financials (Based on Availability)
- 17.2.7 Accent Technologies
- 17.2.7.1. Overview
- 17.2.7.2. Products
- 17.2.7.3. SWOT Analysis
- 17.2.7.4. Recent Developments
- 17.2.7.5. Financials (Based on Availability)
- 17.2.8 Seismic Software Inc
- 17.2.8.1. Overview
- 17.2.8.2. Products
- 17.2.8.3. SWOT Analysis
- 17.2.8.4. Recent Developments
- 17.2.8.5. Financials (Based on Availability)
- 17.2.9 Highspot Inc
- 17.2.9.1. Overview
- 17.2.9.2. Products
- 17.2.9.3. SWOT Analysis
- 17.2.9.4. Recent Developments
- 17.2.9.5. Financials (Based on Availability)
- 17.2.10 Quark
- 17.2.10.1. Overview
- 17.2.10.2. Products
- 17.2.10.3. SWOT Analysis
- 17.2.10.4. Recent Developments
- 17.2.10.5. Financials (Based on Availability)
- 17.2.11 DocSend Inc
- 17.2.11.1. Overview
- 17.2.11.2. Products
- 17.2.11.3. SWOT Analysis
- 17.2.11.4. Recent Developments
- 17.2.11.5. Financials (Based on Availability)
- 17.2.12 Upland Software
- 17.2.12.1. Overview
- 17.2.12.2. Products
- 17.2.12.3. SWOT Analysis
- 17.2.12.4. Recent Developments
- 17.2.12.5. Financials (Based on Availability)
- 17.2.13 GetAccept Inc
- 17.2.13.1. Overview
- 17.2.13.2. Products
- 17.2.13.3. SWOT Analysis
- 17.2.13.4. Recent Developments
- 17.2.13.5. Financials (Based on Availability)
- 17.2.14 Pitcher
- 17.2.14.1. Overview
- 17.2.14.2. Products
- 17.2.14.3. SWOT Analysis
- 17.2.14.4. Recent Developments
- 17.2.14.5. Financials (Based on Availability)
- 17.2.15 Brainshark
- 17.2.15.1. Overview
- 17.2.15.2. Products
- 17.2.15.3. SWOT Analysis
- 17.2.15.4. Recent Developments
- 17.2.15.5. Financials (Based on Availability)
- 17.2.16 Bigtincan Holdings
- 17.2.16.1. Overview
- 17.2.16.2. Products
- 17.2.16.3. SWOT Analysis
- 17.2.16.4. Recent Developments
- 17.2.16.5. Financials (Based on Availability)
- 17.2.17 Qstream Inc
- 17.2.17.1. Overview
- 17.2.17.2. Products
- 17.2.17.3. SWOT Analysis
- 17.2.17.4. Recent Developments
- 17.2.17.5. Financials (Based on Availability)
- 17.2.18 Outreach
- 17.2.18.1. Overview
- 17.2.18.2. Products
- 17.2.18.3. SWOT Analysis
- 17.2.18.4. Recent Developments
- 17.2.18.5. Financials (Based on Availability)
- 17.2.1 Showpad
List of Figures
- Figure 1: Global Sales Enablement Industry Revenue Breakdown (Million, %) by Region 2024 & 2032
- Figure 2: North America Sales Enablement Industry Revenue (Million), by Country 2024 & 2032
- Figure 3: North America Sales Enablement Industry Revenue Share (%), by Country 2024 & 2032
- Figure 4: Europe Sales Enablement Industry Revenue (Million), by Country 2024 & 2032
- Figure 5: Europe Sales Enablement Industry Revenue Share (%), by Country 2024 & 2032
- Figure 6: Asia Pacific Sales Enablement Industry Revenue (Million), by Country 2024 & 2032
- Figure 7: Asia Pacific Sales Enablement Industry Revenue Share (%), by Country 2024 & 2032
- Figure 8: South America Sales Enablement Industry Revenue (Million), by Country 2024 & 2032
- Figure 9: South America Sales Enablement Industry Revenue Share (%), by Country 2024 & 2032
- Figure 10: North America Sales Enablement Industry Revenue (Million), by Country 2024 & 2032
- Figure 11: North America Sales Enablement Industry Revenue Share (%), by Country 2024 & 2032
- Figure 12: MEA Sales Enablement Industry Revenue (Million), by Country 2024 & 2032
- Figure 13: MEA Sales Enablement Industry Revenue Share (%), by Country 2024 & 2032
- Figure 14: North America Sales Enablement Industry Revenue (Million), by Component 2024 & 2032
- Figure 15: North America Sales Enablement Industry Revenue Share (%), by Component 2024 & 2032
- Figure 16: North America Sales Enablement Industry Revenue (Million), by Organization Size 2024 & 2032
- Figure 17: North America Sales Enablement Industry Revenue Share (%), by Organization Size 2024 & 2032
- Figure 18: North America Sales Enablement Industry Revenue (Million), by Deployment Mode 2024 & 2032
- Figure 19: North America Sales Enablement Industry Revenue Share (%), by Deployment Mode 2024 & 2032
- Figure 20: North America Sales Enablement Industry Revenue (Million), by End-user Industry 2024 & 2032
- Figure 21: North America Sales Enablement Industry Revenue Share (%), by End-user Industry 2024 & 2032
- Figure 22: North America Sales Enablement Industry Revenue (Million), by Country 2024 & 2032
- Figure 23: North America Sales Enablement Industry Revenue Share (%), by Country 2024 & 2032
- Figure 24: Europe Sales Enablement Industry Revenue (Million), by Component 2024 & 2032
- Figure 25: Europe Sales Enablement Industry Revenue Share (%), by Component 2024 & 2032
- Figure 26: Europe Sales Enablement Industry Revenue (Million), by Organization Size 2024 & 2032
- Figure 27: Europe Sales Enablement Industry Revenue Share (%), by Organization Size 2024 & 2032
- Figure 28: Europe Sales Enablement Industry Revenue (Million), by Deployment Mode 2024 & 2032
- Figure 29: Europe Sales Enablement Industry Revenue Share (%), by Deployment Mode 2024 & 2032
- Figure 30: Europe Sales Enablement Industry Revenue (Million), by End-user Industry 2024 & 2032
- Figure 31: Europe Sales Enablement Industry Revenue Share (%), by End-user Industry 2024 & 2032
- Figure 32: Europe Sales Enablement Industry Revenue (Million), by Country 2024 & 2032
- Figure 33: Europe Sales Enablement Industry Revenue Share (%), by Country 2024 & 2032
- Figure 34: Asia Pacific Sales Enablement Industry Revenue (Million), by Component 2024 & 2032
- Figure 35: Asia Pacific Sales Enablement Industry Revenue Share (%), by Component 2024 & 2032
- Figure 36: Asia Pacific Sales Enablement Industry Revenue (Million), by Organization Size 2024 & 2032
- Figure 37: Asia Pacific Sales Enablement Industry Revenue Share (%), by Organization Size 2024 & 2032
- Figure 38: Asia Pacific Sales Enablement Industry Revenue (Million), by Deployment Mode 2024 & 2032
- Figure 39: Asia Pacific Sales Enablement Industry Revenue Share (%), by Deployment Mode 2024 & 2032
- Figure 40: Asia Pacific Sales Enablement Industry Revenue (Million), by End-user Industry 2024 & 2032
- Figure 41: Asia Pacific Sales Enablement Industry Revenue Share (%), by End-user Industry 2024 & 2032
- Figure 42: Asia Pacific Sales Enablement Industry Revenue (Million), by Country 2024 & 2032
- Figure 43: Asia Pacific Sales Enablement Industry Revenue Share (%), by Country 2024 & 2032
- Figure 44: Latin America Sales Enablement Industry Revenue (Million), by Component 2024 & 2032
- Figure 45: Latin America Sales Enablement Industry Revenue Share (%), by Component 2024 & 2032
- Figure 46: Latin America Sales Enablement Industry Revenue (Million), by Organization Size 2024 & 2032
- Figure 47: Latin America Sales Enablement Industry Revenue Share (%), by Organization Size 2024 & 2032
- Figure 48: Latin America Sales Enablement Industry Revenue (Million), by Deployment Mode 2024 & 2032
- Figure 49: Latin America Sales Enablement Industry Revenue Share (%), by Deployment Mode 2024 & 2032
- Figure 50: Latin America Sales Enablement Industry Revenue (Million), by End-user Industry 2024 & 2032
- Figure 51: Latin America Sales Enablement Industry Revenue Share (%), by End-user Industry 2024 & 2032
- Figure 52: Latin America Sales Enablement Industry Revenue (Million), by Country 2024 & 2032
- Figure 53: Latin America Sales Enablement Industry Revenue Share (%), by Country 2024 & 2032
- Figure 54: Middle East and Africa Sales Enablement Industry Revenue (Million), by Component 2024 & 2032
- Figure 55: Middle East and Africa Sales Enablement Industry Revenue Share (%), by Component 2024 & 2032
- Figure 56: Middle East and Africa Sales Enablement Industry Revenue (Million), by Organization Size 2024 & 2032
- Figure 57: Middle East and Africa Sales Enablement Industry Revenue Share (%), by Organization Size 2024 & 2032
- Figure 58: Middle East and Africa Sales Enablement Industry Revenue (Million), by Deployment Mode 2024 & 2032
- Figure 59: Middle East and Africa Sales Enablement Industry Revenue Share (%), by Deployment Mode 2024 & 2032
- Figure 60: Middle East and Africa Sales Enablement Industry Revenue (Million), by End-user Industry 2024 & 2032
- Figure 61: Middle East and Africa Sales Enablement Industry Revenue Share (%), by End-user Industry 2024 & 2032
- Figure 62: Middle East and Africa Sales Enablement Industry Revenue (Million), by Country 2024 & 2032
- Figure 63: Middle East and Africa Sales Enablement Industry Revenue Share (%), by Country 2024 & 2032
List of Tables
- Table 1: Global Sales Enablement Industry Revenue Million Forecast, by Region 2019 & 2032
- Table 2: Global Sales Enablement Industry Revenue Million Forecast, by Component 2019 & 2032
- Table 3: Global Sales Enablement Industry Revenue Million Forecast, by Organization Size 2019 & 2032
- Table 4: Global Sales Enablement Industry Revenue Million Forecast, by Deployment Mode 2019 & 2032
- Table 5: Global Sales Enablement Industry Revenue Million Forecast, by End-user Industry 2019 & 2032
- Table 6: Global Sales Enablement Industry Revenue Million Forecast, by Region 2019 & 2032
- Table 7: Global Sales Enablement Industry Revenue Million Forecast, by Country 2019 & 2032
- Table 8: United States Sales Enablement Industry Revenue (Million) Forecast, by Application 2019 & 2032
- Table 9: Canada Sales Enablement Industry Revenue (Million) Forecast, by Application 2019 & 2032
- Table 10: Mexico Sales Enablement Industry Revenue (Million) Forecast, by Application 2019 & 2032
- Table 11: Global Sales Enablement Industry Revenue Million Forecast, by Country 2019 & 2032
- Table 12: Germany Sales Enablement Industry Revenue (Million) Forecast, by Application 2019 & 2032
- Table 13: United Kingdom Sales Enablement Industry Revenue (Million) Forecast, by Application 2019 & 2032
- Table 14: France Sales Enablement Industry Revenue (Million) Forecast, by Application 2019 & 2032
- Table 15: Spain Sales Enablement Industry Revenue (Million) Forecast, by Application 2019 & 2032
- Table 16: Italy Sales Enablement Industry Revenue (Million) Forecast, by Application 2019 & 2032
- Table 17: Spain Sales Enablement Industry Revenue (Million) Forecast, by Application 2019 & 2032
- Table 18: Belgium Sales Enablement Industry Revenue (Million) Forecast, by Application 2019 & 2032
- Table 19: Netherland Sales Enablement Industry Revenue (Million) Forecast, by Application 2019 & 2032
- Table 20: Nordics Sales Enablement Industry Revenue (Million) Forecast, by Application 2019 & 2032
- Table 21: Rest of Europe Sales Enablement Industry Revenue (Million) Forecast, by Application 2019 & 2032
- Table 22: Global Sales Enablement Industry Revenue Million Forecast, by Country 2019 & 2032
- Table 23: China Sales Enablement Industry Revenue (Million) Forecast, by Application 2019 & 2032
- Table 24: Japan Sales Enablement Industry Revenue (Million) Forecast, by Application 2019 & 2032
- Table 25: India Sales Enablement Industry Revenue (Million) Forecast, by Application 2019 & 2032
- Table 26: South Korea Sales Enablement Industry Revenue (Million) Forecast, by Application 2019 & 2032
- Table 27: Southeast Asia Sales Enablement Industry Revenue (Million) Forecast, by Application 2019 & 2032
- Table 28: Australia Sales Enablement Industry Revenue (Million) Forecast, by Application 2019 & 2032
- Table 29: Indonesia Sales Enablement Industry Revenue (Million) Forecast, by Application 2019 & 2032
- Table 30: Phillipes Sales Enablement Industry Revenue (Million) Forecast, by Application 2019 & 2032
- Table 31: Singapore Sales Enablement Industry Revenue (Million) Forecast, by Application 2019 & 2032
- Table 32: Thailandc Sales Enablement Industry Revenue (Million) Forecast, by Application 2019 & 2032
- Table 33: Rest of Asia Pacific Sales Enablement Industry Revenue (Million) Forecast, by Application 2019 & 2032
- Table 34: Global Sales Enablement Industry Revenue Million Forecast, by Country 2019 & 2032
- Table 35: Brazil Sales Enablement Industry Revenue (Million) Forecast, by Application 2019 & 2032
- Table 36: Argentina Sales Enablement Industry Revenue (Million) Forecast, by Application 2019 & 2032
- Table 37: Peru Sales Enablement Industry Revenue (Million) Forecast, by Application 2019 & 2032
- Table 38: Chile Sales Enablement Industry Revenue (Million) Forecast, by Application 2019 & 2032
- Table 39: Colombia Sales Enablement Industry Revenue (Million) Forecast, by Application 2019 & 2032
- Table 40: Ecuador Sales Enablement Industry Revenue (Million) Forecast, by Application 2019 & 2032
- Table 41: Venezuela Sales Enablement Industry Revenue (Million) Forecast, by Application 2019 & 2032
- Table 42: Rest of South America Sales Enablement Industry Revenue (Million) Forecast, by Application 2019 & 2032
- Table 43: Global Sales Enablement Industry Revenue Million Forecast, by Country 2019 & 2032
- Table 44: United States Sales Enablement Industry Revenue (Million) Forecast, by Application 2019 & 2032
- Table 45: Canada Sales Enablement Industry Revenue (Million) Forecast, by Application 2019 & 2032
- Table 46: Mexico Sales Enablement Industry Revenue (Million) Forecast, by Application 2019 & 2032
- Table 47: Global Sales Enablement Industry Revenue Million Forecast, by Country 2019 & 2032
- Table 48: United Arab Emirates Sales Enablement Industry Revenue (Million) Forecast, by Application 2019 & 2032
- Table 49: Saudi Arabia Sales Enablement Industry Revenue (Million) Forecast, by Application 2019 & 2032
- Table 50: South Africa Sales Enablement Industry Revenue (Million) Forecast, by Application 2019 & 2032
- Table 51: Rest of Middle East and Africa Sales Enablement Industry Revenue (Million) Forecast, by Application 2019 & 2032
- Table 52: Global Sales Enablement Industry Revenue Million Forecast, by Component 2019 & 2032
- Table 53: Global Sales Enablement Industry Revenue Million Forecast, by Organization Size 2019 & 2032
- Table 54: Global Sales Enablement Industry Revenue Million Forecast, by Deployment Mode 2019 & 2032
- Table 55: Global Sales Enablement Industry Revenue Million Forecast, by End-user Industry 2019 & 2032
- Table 56: Global Sales Enablement Industry Revenue Million Forecast, by Country 2019 & 2032
- Table 57: Global Sales Enablement Industry Revenue Million Forecast, by Component 2019 & 2032
- Table 58: Global Sales Enablement Industry Revenue Million Forecast, by Organization Size 2019 & 2032
- Table 59: Global Sales Enablement Industry Revenue Million Forecast, by Deployment Mode 2019 & 2032
- Table 60: Global Sales Enablement Industry Revenue Million Forecast, by End-user Industry 2019 & 2032
- Table 61: Global Sales Enablement Industry Revenue Million Forecast, by Country 2019 & 2032
- Table 62: Global Sales Enablement Industry Revenue Million Forecast, by Component 2019 & 2032
- Table 63: Global Sales Enablement Industry Revenue Million Forecast, by Organization Size 2019 & 2032
- Table 64: Global Sales Enablement Industry Revenue Million Forecast, by Deployment Mode 2019 & 2032
- Table 65: Global Sales Enablement Industry Revenue Million Forecast, by End-user Industry 2019 & 2032
- Table 66: Global Sales Enablement Industry Revenue Million Forecast, by Country 2019 & 2032
- Table 67: Global Sales Enablement Industry Revenue Million Forecast, by Component 2019 & 2032
- Table 68: Global Sales Enablement Industry Revenue Million Forecast, by Organization Size 2019 & 2032
- Table 69: Global Sales Enablement Industry Revenue Million Forecast, by Deployment Mode 2019 & 2032
- Table 70: Global Sales Enablement Industry Revenue Million Forecast, by End-user Industry 2019 & 2032
- Table 71: Global Sales Enablement Industry Revenue Million Forecast, by Country 2019 & 2032
- Table 72: Global Sales Enablement Industry Revenue Million Forecast, by Component 2019 & 2032
- Table 73: Global Sales Enablement Industry Revenue Million Forecast, by Organization Size 2019 & 2032
- Table 74: Global Sales Enablement Industry Revenue Million Forecast, by Deployment Mode 2019 & 2032
- Table 75: Global Sales Enablement Industry Revenue Million Forecast, by End-user Industry 2019 & 2032
- Table 76: Global Sales Enablement Industry Revenue Million Forecast, by Country 2019 & 2032
Frequently Asked Questions
1. What is the projected Compound Annual Growth Rate (CAGR) of the Sales Enablement Industry?
The projected CAGR is approximately 20.23%.
2. Which companies are prominent players in the Sales Enablement Industry?
Key companies in the market include Showpad, Qorus Software Ltd, ClearSlide, Mediafly, MindTickle, Rallyware Inc, Accent Technologies, Seismic Software Inc, Highspot Inc, Quark, DocSend Inc, Upland Software, GetAccept Inc, Pitcher, Brainshark, Bigtincan Holdings, Qstream Inc, Outreach.
3. What are the main segments of the Sales Enablement Industry?
The market segments include Component, Organization Size, Deployment Mode, End-user Industry.
4. Can you provide details about the market size?
The market size is estimated to be USD 3.50 Million as of 2022.
5. What are some drivers contributing to market growth?
Rising Need to Improve the Internal Business Process; Scaling Sales Efforts With the Help of Advanced Technology.
6. What are the notable trends driving market growth?
Consumer Goods and Retail Industry to Exhibit Significant Growth.
7. Are there any restraints impacting market growth?
Inconsistent User Experience Across Various Access Channels.
8. Can you provide examples of recent developments in the market?
March 2022 - Ceros, the cloud-based, no-code design platform for interactive content, today announced its partnership with Highspot and Showpad, sales enablement vendors. These partnerships will provide the company achieve its mission to create an innovative integrated suite for all designers and marketers, from enterprise clients to citizen creators.
9. What pricing options are available for accessing the report?
Pricing options include single-user, multi-user, and enterprise licenses priced at USD 4750, USD 5250, and USD 8750 respectively.
10. Is the market size provided in terms of value or volume?
The market size is provided in terms of value, measured in Million.
11. Are there any specific market keywords associated with the report?
Yes, the market keyword associated with the report is "Sales Enablement Industry," which aids in identifying and referencing the specific market segment covered.
12. How do I determine which pricing option suits my needs best?
The pricing options vary based on user requirements and access needs. Individual users may opt for single-user licenses, while businesses requiring broader access may choose multi-user or enterprise licenses for cost-effective access to the report.
13. Are there any additional resources or data provided in the Sales Enablement Industry report?
While the report offers comprehensive insights, it's advisable to review the specific contents or supplementary materials provided to ascertain if additional resources or data are available.
14. How can I stay updated on further developments or reports in the Sales Enablement Industry?
To stay informed about further developments, trends, and reports in the Sales Enablement Industry, consider subscribing to industry newsletters, following relevant companies and organizations, or regularly checking reputable industry news sources and publications.
Methodology
Step 1 - Identification of Relevant Samples Size from Population Database


Step 2 - Approaches for Defining Global Market Size (Value, Volume* & Price*)

Note*: In applicable scenarios
Step 3 - Data Sources
Primary Research
- Web Analytics
- Survey Reports
- Research Institute
- Latest Research Reports
- Opinion Leaders
Secondary Research
- Annual Reports
- White Paper
- Latest Press Release
- Industry Association
- Paid Database
- Investor Presentations

Step 4 - Data Triangulation
Involves using different sources of information in order to increase the validity of a study
These sources are likely to be stakeholders in a program - participants, other researchers, program staff, other community members, and so on.
Then we put all data in single framework & apply various statistical tools to find out the dynamic on the market.
During the analysis stage, feedback from the stakeholder groups would be compared to determine areas of agreement as well as areas of divergence
