

Key Insights
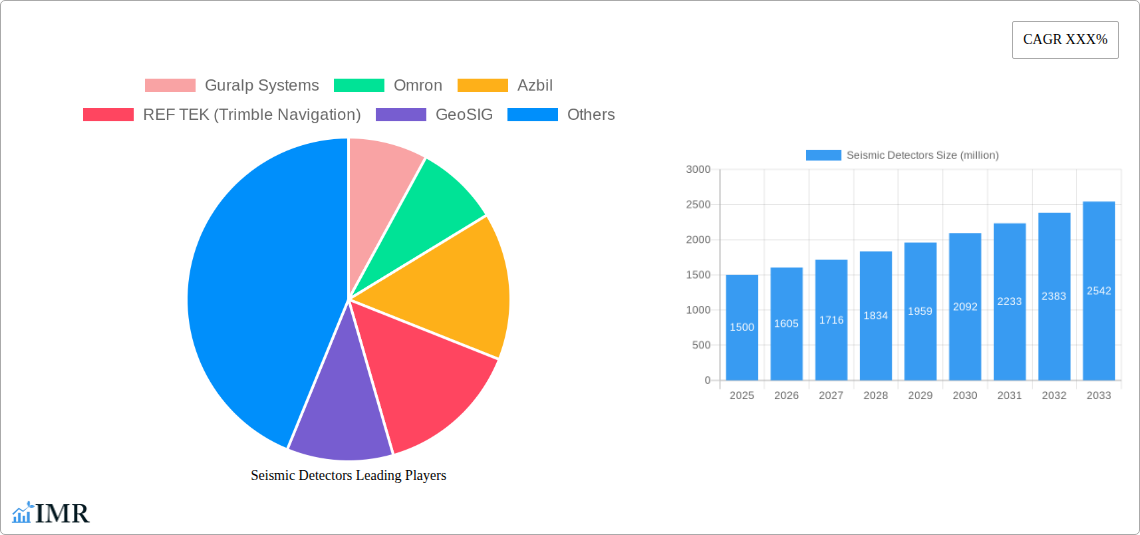
The global seismic detector market is experiencing robust growth, driven by increasing infrastructure development, particularly in seismically active regions, and the rising demand for accurate earthquake monitoring and prediction. Advancements in sensor technology, including the development of more sensitive and reliable instruments, are further fueling market expansion. The integration of seismic detectors with sophisticated data analysis and communication systems enhances their capabilities, enabling real-time monitoring and rapid response to seismic events. This has led to significant investments in research and development, contributing to the market's overall dynamism. We estimate the market size in 2025 to be approximately $1.5 billion, based on industry reports and observed growth trends in related sectors. This robust growth is projected to continue, with a Compound Annual Growth Rate (CAGR) estimated at 7% for the forecast period of 2025 to 2033, reaching an estimated $2.7 billion by 2033. The market is segmented based on sensor type (e.g., accelerometer, geophone), application (e.g., earthquake monitoring, structural health monitoring), and end-user (e.g., government agencies, research institutions, private companies).
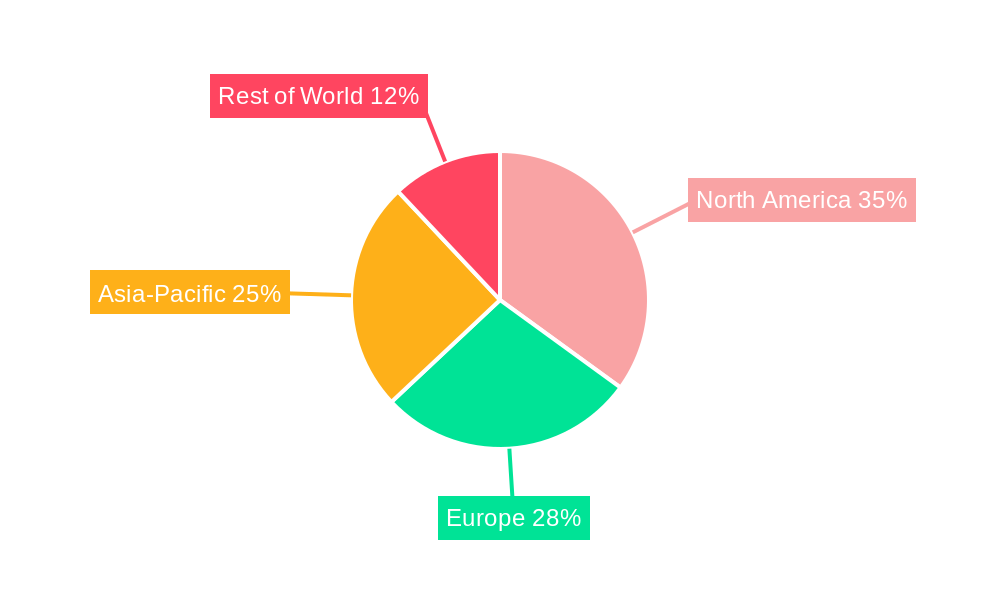
Key restraints include the high initial investment costs associated with deploying seismic detector networks and the need for specialized expertise in data analysis and interpretation. However, ongoing technological advancements and government initiatives aimed at improving infrastructure resilience and mitigating seismic risks are expected to partially offset these limitations. Competition is intense among established players, including Guralp Systems, Omron, and Azbil, and several smaller specialized companies. The market is witnessing increased collaboration between technology providers and research institutions to develop innovative seismic monitoring solutions. This collaborative approach is fostering innovation and driving market expansion. The North American and Asian markets are currently the largest contributors to market revenue, driven by significant investments in infrastructure and seismic monitoring networks.
Seismic Detectors Market Report: 2019-2033
This comprehensive report provides an in-depth analysis of the global seismic detectors market, encompassing market dynamics, growth trends, regional dominance, product landscape, and key player strategies. The study period covers 2019-2033, with 2025 as the base and estimated year. The forecast period extends from 2025-2033, and the historical period analyzed is 2019-2024. This report is crucial for industry professionals, investors, and researchers seeking to understand and capitalize on opportunities within this vital sector. The market is segmented by type, application, and region, offering a granular view of this dynamic landscape. The total addressable market (TAM) is projected to reach xx million units by 2033.
Seismic Detectors Market Dynamics & Structure
The global seismic detectors market is characterized by moderate concentration, with a few major players holding significant market share. Technological innovation, particularly in sensor technology and data processing, is a key driver. Stringent regulatory frameworks governing seismic monitoring, especially in earthquake-prone regions, shape market demand. Competitive pressures arise from substitute technologies and the increasing sophistication of seismic monitoring systems. The end-user demographics include government agencies, research institutions, oil and gas companies, and construction firms. M&A activity has been relatively moderate in recent years, with xx deals recorded between 2019 and 2024, representing a total value of xx million USD.
- Market Concentration: Moderately concentrated, with top 5 players holding approximately xx% market share in 2024.
- Technological Innovation: Advancements in MEMS sensors, AI-powered data analysis, and wireless communication are key drivers.
- Regulatory Landscape: Stringent regulations in high-risk seismic zones drive market demand.
- Competitive Substitutes: Limited direct substitutes, but competition exists from alternative monitoring techniques.
- End-User Demographics: Government agencies (xx%), Research institutions (xx%), Oil & Gas (xx%), Construction (xx%).
- M&A Activity: xx deals between 2019-2024, totaling xx million USD. Innovation barriers include high R&D costs and the need for specialized expertise.
Seismic Detectors Growth Trends & Insights
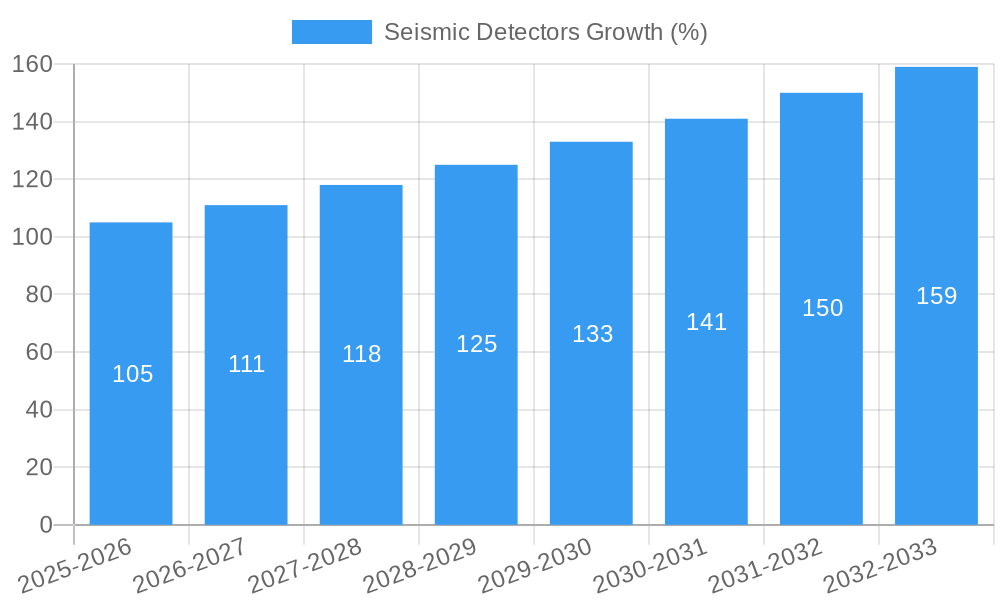
The global seismic detectors market experienced a CAGR of xx% during the historical period (2019-2024), reaching a market size of xx million units in 2024. This growth is projected to continue at a CAGR of xx% during the forecast period (2025-2033), driven by increasing infrastructure development in earthquake-prone regions, rising awareness of seismic hazards, and advancements in sensor technology. Market penetration is currently at xx% in developed economies and is expected to increase significantly in developing nations. Technological disruptions, such as the adoption of IoT and cloud-based data analytics, are further accelerating market growth. Consumer behavior shifts towards greater reliance on precise seismic data for risk mitigation are fueling market demand. The increasing adoption of sophisticated early warning systems is a key factor driving the market.
Dominant Regions, Countries, or Segments in Seismic Detectors
The [Specify region, e.g., Asia-Pacific] region dominated the seismic detectors market in 2024, holding a market share of approximately xx%. This dominance is primarily attributed to rapid infrastructure development, significant investments in seismic monitoring infrastructure, and a high concentration of earthquake-prone areas. [Specify country, e.g., Japan] emerged as a key national market within this region, driven by stringent building codes and a high awareness of seismic risks.
- Key Drivers in Asia-Pacific: Rapid urbanization, stringent building codes, government investments in infrastructure.
- Dominance Factors: High seismic activity, robust government funding for disaster preparedness, and a strong focus on infrastructure development.
- Growth Potential: Significant untapped potential in developing nations within the region.
Seismic Detectors Product Landscape
Seismic detectors encompass a range of products, from basic seismometers to advanced broadband sensors and sophisticated monitoring systems. Recent innovations focus on enhanced sensitivity, wider frequency ranges, and improved data processing capabilities. Key performance metrics include sensitivity, dynamic range, and noise floor. Unique selling propositions often involve proprietary sensor technology, advanced data analytics algorithms, and robust system integration capabilities. The market is witnessing a shift towards compact, cost-effective sensors for broader applications.
Key Drivers, Barriers & Challenges in Seismic Detectors
Key Drivers: Increasing awareness of seismic hazards, stringent building codes in earthquake-prone regions, government investments in early warning systems, and technological advancements in sensor technology.
Challenges & Restraints: High initial investment costs for sophisticated systems, complex installation requirements, the need for skilled personnel for maintenance and data analysis, and supply chain disruptions due to global events. Furthermore, competition from alternative monitoring technologies and regulatory hurdles in certain regions pose additional challenges. Supply chain complexities have led to xx% increase in manufacturing costs in the past year.
Emerging Opportunities in Seismic Detectors
Emerging opportunities include expanding into untapped markets, particularly in developing nations with high seismic risks. The integration of seismic data with other environmental monitoring systems (e.g., weather) presents significant growth potential. The development of low-cost, portable sensors for broader applications, such as infrastructure monitoring and oil exploration, offers further opportunities. The increasing use of AI and machine learning for data analysis is also driving innovation.
Growth Accelerators in the Seismic Detectors Industry
Long-term growth will be fueled by continued technological advancements, strategic partnerships between sensor manufacturers and data analytics providers, and market expansion into developing economies. Governments' increasing emphasis on disaster preparedness and mitigation will also contribute to market expansion. Strategic acquisitions of smaller technology companies by larger industry players will further accelerate innovation and market consolidation.
Key Players Shaping the Seismic Detectors Market
- Guralp Systems
- Omron
- Azbil
- REF TEK (Trimble Navigation)
- GeoSIG
- Dai-ichi Seiko
- Jds Products
- Dynamic Technologies
- Ubukata Industries
- Colibrys
- DJB Instruments
- Dytran Instruments
- Tokyo Sokushin
- Sercel
- QMI Manufacturing
- Senba Denki Kazai
Notable Milestones in Seismic Detectors Sector
- 2020: Introduction of a new generation of MEMS-based seismic sensors by [Company Name] significantly reducing production costs.
- 2022: Strategic partnership between [Company A] and [Company B] for the development of integrated seismic monitoring systems for smart cities.
- 2023: Acquisition of [Company C] by [Company D], enhancing the latter’s portfolio of seismic monitoring solutions.
In-Depth Seismic Detectors Market Outlook
The future of the seismic detectors market is promising, driven by a convergence of technological advancements, increasing awareness of seismic risks, and government investments in disaster preparedness. Strategic opportunities exist for companies focused on innovation in sensor technology, data analytics, and system integration. The market is poised for sustained growth, particularly in developing economies with significant infrastructure development needs and high seismic activity.
Seismic Detectors Segmentation
-
1. Application
- 1.1. House
- 1.2. Apartment
- 1.3. Office Building
- 1.4. Others
-
2. Type
- 2.1. Normal
- 2.2. Intelligent
Seismic Detectors Segmentation By Geography
-
1. North America
- 1.1. United States
- 1.2. Canada
- 1.3. Mexico
-
2. South America
- 2.1. Brazil
- 2.2. Argentina
- 2.3. Rest of South America
-
3. Europe
- 3.1. United Kingdom
- 3.2. Germany
- 3.3. France
- 3.4. Italy
- 3.5. Spain
- 3.6. Russia
- 3.7. Benelux
- 3.8. Nordics
- 3.9. Rest of Europe
-
4. Middle East & Africa
- 4.1. Turkey
- 4.2. Israel
- 4.3. GCC
- 4.4. North Africa
- 4.5. South Africa
- 4.6. Rest of Middle East & Africa
-
5. Asia Pacific
- 5.1. China
- 5.2. India
- 5.3. Japan
- 5.4. South Korea
- 5.5. ASEAN
- 5.6. Oceania
- 5.7. Rest of Asia Pacific
Seismic Detectors REPORT HIGHLIGHTS
| Aspects | Details |
|---|---|
| Study Period | 2019-2033 |
| Base Year | 2024 |
| Estimated Year | 2025 |
| Forecast Period | 2025-2033 |
| Historical Period | 2019-2024 |
| Growth Rate | CAGR of XXX% from 2019-2033 |
| Segmentation |
|
Table of Contents
- 1. Introduction
- 1.1. Research Scope
- 1.2. Market Segmentation
- 1.3. Research Methodology
- 1.4. Definitions and Assumptions
- 2. Executive Summary
- 2.1. Introduction
- 3. Market Dynamics
- 3.1. Introduction
- 3.2. Market Drivers
- 3.3. Market Restrains
- 3.4. Market Trends
- 4. Market Factor Analysis
- 4.1. Porters Five Forces
- 4.2. Supply/Value Chain
- 4.3. PESTEL analysis
- 4.4. Market Entropy
- 4.5. Patent/Trademark Analysis
- 5. Global Seismic Detectors Analysis, Insights and Forecast, 2019-2031
- 5.1. Market Analysis, Insights and Forecast - by Application
- 5.1.1. House
- 5.1.2. Apartment
- 5.1.3. Office Building
- 5.1.4. Others
- 5.2. Market Analysis, Insights and Forecast - by Type
- 5.2.1. Normal
- 5.2.2. Intelligent
- 5.3. Market Analysis, Insights and Forecast - by Region
- 5.3.1. North America
- 5.3.2. South America
- 5.3.3. Europe
- 5.3.4. Middle East & Africa
- 5.3.5. Asia Pacific
- 5.1. Market Analysis, Insights and Forecast - by Application
- 6. North America Seismic Detectors Analysis, Insights and Forecast, 2019-2031
- 6.1. Market Analysis, Insights and Forecast - by Application
- 6.1.1. House
- 6.1.2. Apartment
- 6.1.3. Office Building
- 6.1.4. Others
- 6.2. Market Analysis, Insights and Forecast - by Type
- 6.2.1. Normal
- 6.2.2. Intelligent
- 6.1. Market Analysis, Insights and Forecast - by Application
- 7. South America Seismic Detectors Analysis, Insights and Forecast, 2019-2031
- 7.1. Market Analysis, Insights and Forecast - by Application
- 7.1.1. House
- 7.1.2. Apartment
- 7.1.3. Office Building
- 7.1.4. Others
- 7.2. Market Analysis, Insights and Forecast - by Type
- 7.2.1. Normal
- 7.2.2. Intelligent
- 7.1. Market Analysis, Insights and Forecast - by Application
- 8. Europe Seismic Detectors Analysis, Insights and Forecast, 2019-2031
- 8.1. Market Analysis, Insights and Forecast - by Application
- 8.1.1. House
- 8.1.2. Apartment
- 8.1.3. Office Building
- 8.1.4. Others
- 8.2. Market Analysis, Insights and Forecast - by Type
- 8.2.1. Normal
- 8.2.2. Intelligent
- 8.1. Market Analysis, Insights and Forecast - by Application
- 9. Middle East & Africa Seismic Detectors Analysis, Insights and Forecast, 2019-2031
- 9.1. Market Analysis, Insights and Forecast - by Application
- 9.1.1. House
- 9.1.2. Apartment
- 9.1.3. Office Building
- 9.1.4. Others
- 9.2. Market Analysis, Insights and Forecast - by Type
- 9.2.1. Normal
- 9.2.2. Intelligent
- 9.1. Market Analysis, Insights and Forecast - by Application
- 10. Asia Pacific Seismic Detectors Analysis, Insights and Forecast, 2019-2031
- 10.1. Market Analysis, Insights and Forecast - by Application
- 10.1.1. House
- 10.1.2. Apartment
- 10.1.3. Office Building
- 10.1.4. Others
- 10.2. Market Analysis, Insights and Forecast - by Type
- 10.2.1. Normal
- 10.2.2. Intelligent
- 10.1. Market Analysis, Insights and Forecast - by Application
- 11. Competitive Analysis
- 11.1. Global Market Share Analysis 2024
- 11.2. Company Profiles
- 11.2.1 Guralp Systems
- 11.2.1.1. Overview
- 11.2.1.2. Products
- 11.2.1.3. SWOT Analysis
- 11.2.1.4. Recent Developments
- 11.2.1.5. Financials (Based on Availability)
- 11.2.2 Omron
- 11.2.2.1. Overview
- 11.2.2.2. Products
- 11.2.2.3. SWOT Analysis
- 11.2.2.4. Recent Developments
- 11.2.2.5. Financials (Based on Availability)
- 11.2.3 Azbil
- 11.2.3.1. Overview
- 11.2.3.2. Products
- 11.2.3.3. SWOT Analysis
- 11.2.3.4. Recent Developments
- 11.2.3.5. Financials (Based on Availability)
- 11.2.4 REF TEK (Trimble Navigation)
- 11.2.4.1. Overview
- 11.2.4.2. Products
- 11.2.4.3. SWOT Analysis
- 11.2.4.4. Recent Developments
- 11.2.4.5. Financials (Based on Availability)
- 11.2.5 GeoSIG
- 11.2.5.1. Overview
- 11.2.5.2. Products
- 11.2.5.3. SWOT Analysis
- 11.2.5.4. Recent Developments
- 11.2.5.5. Financials (Based on Availability)
- 11.2.6 Dai-ichi Seiko
- 11.2.6.1. Overview
- 11.2.6.2. Products
- 11.2.6.3. SWOT Analysis
- 11.2.6.4. Recent Developments
- 11.2.6.5. Financials (Based on Availability)
- 11.2.7 Jds Products
- 11.2.7.1. Overview
- 11.2.7.2. Products
- 11.2.7.3. SWOT Analysis
- 11.2.7.4. Recent Developments
- 11.2.7.5. Financials (Based on Availability)
- 11.2.8 Dynamic Technologies
- 11.2.8.1. Overview
- 11.2.8.2. Products
- 11.2.8.3. SWOT Analysis
- 11.2.8.4. Recent Developments
- 11.2.8.5. Financials (Based on Availability)
- 11.2.9 Ubukata Industries
- 11.2.9.1. Overview
- 11.2.9.2. Products
- 11.2.9.3. SWOT Analysis
- 11.2.9.4. Recent Developments
- 11.2.9.5. Financials (Based on Availability)
- 11.2.10 Colibrys
- 11.2.10.1. Overview
- 11.2.10.2. Products
- 11.2.10.3. SWOT Analysis
- 11.2.10.4. Recent Developments
- 11.2.10.5. Financials (Based on Availability)
- 11.2.11 DJB Instruments
- 11.2.11.1. Overview
- 11.2.11.2. Products
- 11.2.11.3. SWOT Analysis
- 11.2.11.4. Recent Developments
- 11.2.11.5. Financials (Based on Availability)
- 11.2.12 Dytran Instruments
- 11.2.12.1. Overview
- 11.2.12.2. Products
- 11.2.12.3. SWOT Analysis
- 11.2.12.4. Recent Developments
- 11.2.12.5. Financials (Based on Availability)
- 11.2.13 Tokyo Sokushin
- 11.2.13.1. Overview
- 11.2.13.2. Products
- 11.2.13.3. SWOT Analysis
- 11.2.13.4. Recent Developments
- 11.2.13.5. Financials (Based on Availability)
- 11.2.14 Sercel
- 11.2.14.1. Overview
- 11.2.14.2. Products
- 11.2.14.3. SWOT Analysis
- 11.2.14.4. Recent Developments
- 11.2.14.5. Financials (Based on Availability)
- 11.2.15 QMI Manufacturing
- 11.2.15.1. Overview
- 11.2.15.2. Products
- 11.2.15.3. SWOT Analysis
- 11.2.15.4. Recent Developments
- 11.2.15.5. Financials (Based on Availability)
- 11.2.16 Senba Denki Kazai
- 11.2.16.1. Overview
- 11.2.16.2. Products
- 11.2.16.3. SWOT Analysis
- 11.2.16.4. Recent Developments
- 11.2.16.5. Financials (Based on Availability)
- 11.2.1 Guralp Systems
List of Figures
- Figure 1: Global Seismic Detectors Revenue Breakdown (million, %) by Region 2024 & 2032
- Figure 2: North America Seismic Detectors Revenue (million), by Application 2024 & 2032
- Figure 3: North America Seismic Detectors Revenue Share (%), by Application 2024 & 2032
- Figure 4: North America Seismic Detectors Revenue (million), by Type 2024 & 2032
- Figure 5: North America Seismic Detectors Revenue Share (%), by Type 2024 & 2032
- Figure 6: North America Seismic Detectors Revenue (million), by Country 2024 & 2032
- Figure 7: North America Seismic Detectors Revenue Share (%), by Country 2024 & 2032
- Figure 8: South America Seismic Detectors Revenue (million), by Application 2024 & 2032
- Figure 9: South America Seismic Detectors Revenue Share (%), by Application 2024 & 2032
- Figure 10: South America Seismic Detectors Revenue (million), by Type 2024 & 2032
- Figure 11: South America Seismic Detectors Revenue Share (%), by Type 2024 & 2032
- Figure 12: South America Seismic Detectors Revenue (million), by Country 2024 & 2032
- Figure 13: South America Seismic Detectors Revenue Share (%), by Country 2024 & 2032
- Figure 14: Europe Seismic Detectors Revenue (million), by Application 2024 & 2032
- Figure 15: Europe Seismic Detectors Revenue Share (%), by Application 2024 & 2032
- Figure 16: Europe Seismic Detectors Revenue (million), by Type 2024 & 2032
- Figure 17: Europe Seismic Detectors Revenue Share (%), by Type 2024 & 2032
- Figure 18: Europe Seismic Detectors Revenue (million), by Country 2024 & 2032
- Figure 19: Europe Seismic Detectors Revenue Share (%), by Country 2024 & 2032
- Figure 20: Middle East & Africa Seismic Detectors Revenue (million), by Application 2024 & 2032
- Figure 21: Middle East & Africa Seismic Detectors Revenue Share (%), by Application 2024 & 2032
- Figure 22: Middle East & Africa Seismic Detectors Revenue (million), by Type 2024 & 2032
- Figure 23: Middle East & Africa Seismic Detectors Revenue Share (%), by Type 2024 & 2032
- Figure 24: Middle East & Africa Seismic Detectors Revenue (million), by Country 2024 & 2032
- Figure 25: Middle East & Africa Seismic Detectors Revenue Share (%), by Country 2024 & 2032
- Figure 26: Asia Pacific Seismic Detectors Revenue (million), by Application 2024 & 2032
- Figure 27: Asia Pacific Seismic Detectors Revenue Share (%), by Application 2024 & 2032
- Figure 28: Asia Pacific Seismic Detectors Revenue (million), by Type 2024 & 2032
- Figure 29: Asia Pacific Seismic Detectors Revenue Share (%), by Type 2024 & 2032
- Figure 30: Asia Pacific Seismic Detectors Revenue (million), by Country 2024 & 2032
- Figure 31: Asia Pacific Seismic Detectors Revenue Share (%), by Country 2024 & 2032
List of Tables
- Table 1: Global Seismic Detectors Revenue million Forecast, by Region 2019 & 2032
- Table 2: Global Seismic Detectors Revenue million Forecast, by Application 2019 & 2032
- Table 3: Global Seismic Detectors Revenue million Forecast, by Type 2019 & 2032
- Table 4: Global Seismic Detectors Revenue million Forecast, by Region 2019 & 2032
- Table 5: Global Seismic Detectors Revenue million Forecast, by Application 2019 & 2032
- Table 6: Global Seismic Detectors Revenue million Forecast, by Type 2019 & 2032
- Table 7: Global Seismic Detectors Revenue million Forecast, by Country 2019 & 2032
- Table 8: United States Seismic Detectors Revenue (million) Forecast, by Application 2019 & 2032
- Table 9: Canada Seismic Detectors Revenue (million) Forecast, by Application 2019 & 2032
- Table 10: Mexico Seismic Detectors Revenue (million) Forecast, by Application 2019 & 2032
- Table 11: Global Seismic Detectors Revenue million Forecast, by Application 2019 & 2032
- Table 12: Global Seismic Detectors Revenue million Forecast, by Type 2019 & 2032
- Table 13: Global Seismic Detectors Revenue million Forecast, by Country 2019 & 2032
- Table 14: Brazil Seismic Detectors Revenue (million) Forecast, by Application 2019 & 2032
- Table 15: Argentina Seismic Detectors Revenue (million) Forecast, by Application 2019 & 2032
- Table 16: Rest of South America Seismic Detectors Revenue (million) Forecast, by Application 2019 & 2032
- Table 17: Global Seismic Detectors Revenue million Forecast, by Application 2019 & 2032
- Table 18: Global Seismic Detectors Revenue million Forecast, by Type 2019 & 2032
- Table 19: Global Seismic Detectors Revenue million Forecast, by Country 2019 & 2032
- Table 20: United Kingdom Seismic Detectors Revenue (million) Forecast, by Application 2019 & 2032
- Table 21: Germany Seismic Detectors Revenue (million) Forecast, by Application 2019 & 2032
- Table 22: France Seismic Detectors Revenue (million) Forecast, by Application 2019 & 2032
- Table 23: Italy Seismic Detectors Revenue (million) Forecast, by Application 2019 & 2032
- Table 24: Spain Seismic Detectors Revenue (million) Forecast, by Application 2019 & 2032
- Table 25: Russia Seismic Detectors Revenue (million) Forecast, by Application 2019 & 2032
- Table 26: Benelux Seismic Detectors Revenue (million) Forecast, by Application 2019 & 2032
- Table 27: Nordics Seismic Detectors Revenue (million) Forecast, by Application 2019 & 2032
- Table 28: Rest of Europe Seismic Detectors Revenue (million) Forecast, by Application 2019 & 2032
- Table 29: Global Seismic Detectors Revenue million Forecast, by Application 2019 & 2032
- Table 30: Global Seismic Detectors Revenue million Forecast, by Type 2019 & 2032
- Table 31: Global Seismic Detectors Revenue million Forecast, by Country 2019 & 2032
- Table 32: Turkey Seismic Detectors Revenue (million) Forecast, by Application 2019 & 2032
- Table 33: Israel Seismic Detectors Revenue (million) Forecast, by Application 2019 & 2032
- Table 34: GCC Seismic Detectors Revenue (million) Forecast, by Application 2019 & 2032
- Table 35: North Africa Seismic Detectors Revenue (million) Forecast, by Application 2019 & 2032
- Table 36: South Africa Seismic Detectors Revenue (million) Forecast, by Application 2019 & 2032
- Table 37: Rest of Middle East & Africa Seismic Detectors Revenue (million) Forecast, by Application 2019 & 2032
- Table 38: Global Seismic Detectors Revenue million Forecast, by Application 2019 & 2032
- Table 39: Global Seismic Detectors Revenue million Forecast, by Type 2019 & 2032
- Table 40: Global Seismic Detectors Revenue million Forecast, by Country 2019 & 2032
- Table 41: China Seismic Detectors Revenue (million) Forecast, by Application 2019 & 2032
- Table 42: India Seismic Detectors Revenue (million) Forecast, by Application 2019 & 2032
- Table 43: Japan Seismic Detectors Revenue (million) Forecast, by Application 2019 & 2032
- Table 44: South Korea Seismic Detectors Revenue (million) Forecast, by Application 2019 & 2032
- Table 45: ASEAN Seismic Detectors Revenue (million) Forecast, by Application 2019 & 2032
- Table 46: Oceania Seismic Detectors Revenue (million) Forecast, by Application 2019 & 2032
- Table 47: Rest of Asia Pacific Seismic Detectors Revenue (million) Forecast, by Application 2019 & 2032
Frequently Asked Questions
1. What is the projected Compound Annual Growth Rate (CAGR) of the Seismic Detectors?
The projected CAGR is approximately XXX%.
2. Which companies are prominent players in the Seismic Detectors?
Key companies in the market include Guralp Systems, Omron, Azbil, REF TEK (Trimble Navigation), GeoSIG, Dai-ichi Seiko, Jds Products, Dynamic Technologies, Ubukata Industries, Colibrys, DJB Instruments, Dytran Instruments, Tokyo Sokushin, Sercel, QMI Manufacturing, Senba Denki Kazai.
3. What are the main segments of the Seismic Detectors?
The market segments include Application, Type.
4. Can you provide details about the market size?
The market size is estimated to be USD XXX million as of 2022.
5. What are some drivers contributing to market growth?
N/A
6. What are the notable trends driving market growth?
N/A
7. Are there any restraints impacting market growth?
N/A
8. Can you provide examples of recent developments in the market?
N/A
9. What pricing options are available for accessing the report?
Pricing options include single-user, multi-user, and enterprise licenses priced at USD 2900.00, USD 4350.00, and USD 5800.00 respectively.
10. Is the market size provided in terms of value or volume?
The market size is provided in terms of value, measured in million.
11. Are there any specific market keywords associated with the report?
Yes, the market keyword associated with the report is "Seismic Detectors," which aids in identifying and referencing the specific market segment covered.
12. How do I determine which pricing option suits my needs best?
The pricing options vary based on user requirements and access needs. Individual users may opt for single-user licenses, while businesses requiring broader access may choose multi-user or enterprise licenses for cost-effective access to the report.
13. Are there any additional resources or data provided in the Seismic Detectors report?
While the report offers comprehensive insights, it's advisable to review the specific contents or supplementary materials provided to ascertain if additional resources or data are available.
14. How can I stay updated on further developments or reports in the Seismic Detectors?
To stay informed about further developments, trends, and reports in the Seismic Detectors, consider subscribing to industry newsletters, following relevant companies and organizations, or regularly checking reputable industry news sources and publications.
Methodology
Step 1 - Identification of Relevant Samples Size from Population Database


Step 2 - Approaches for Defining Global Market Size (Value, Volume* & Price*)

Note*: In applicable scenarios
Step 3 - Data Sources
Primary Research
- Web Analytics
- Survey Reports
- Research Institute
- Latest Research Reports
- Opinion Leaders
Secondary Research
- Annual Reports
- White Paper
- Latest Press Release
- Industry Association
- Paid Database
- Investor Presentations

Step 4 - Data Triangulation
Involves using different sources of information in order to increase the validity of a study
These sources are likely to be stakeholders in a program - participants, other researchers, program staff, other community members, and so on.
Then we put all data in single framework & apply various statistical tools to find out the dynamic on the market.
During the analysis stage, feedback from the stakeholder groups would be compared to determine areas of agreement as well as areas of divergence
