

Key Insights
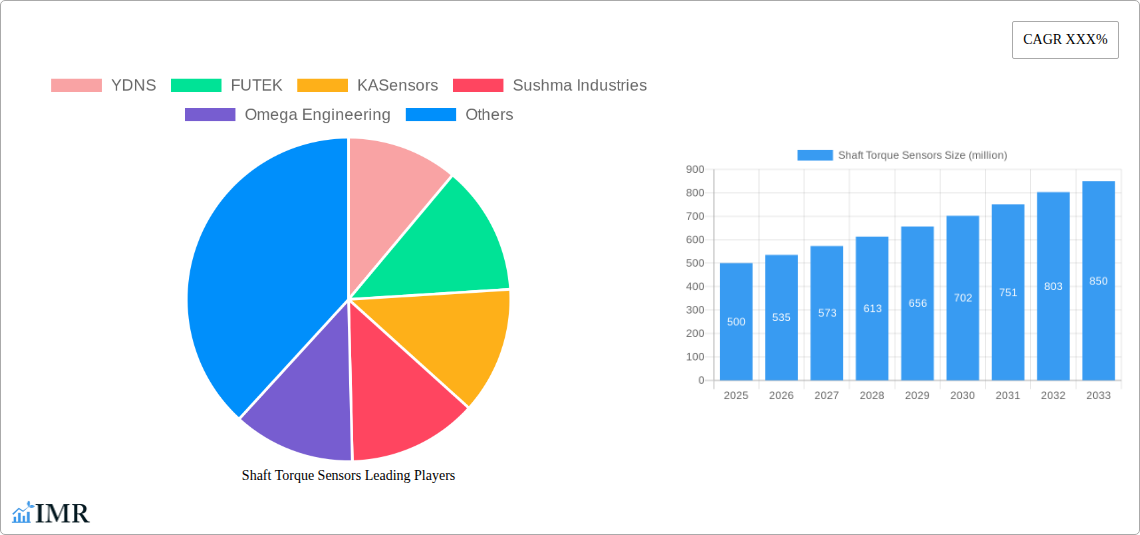
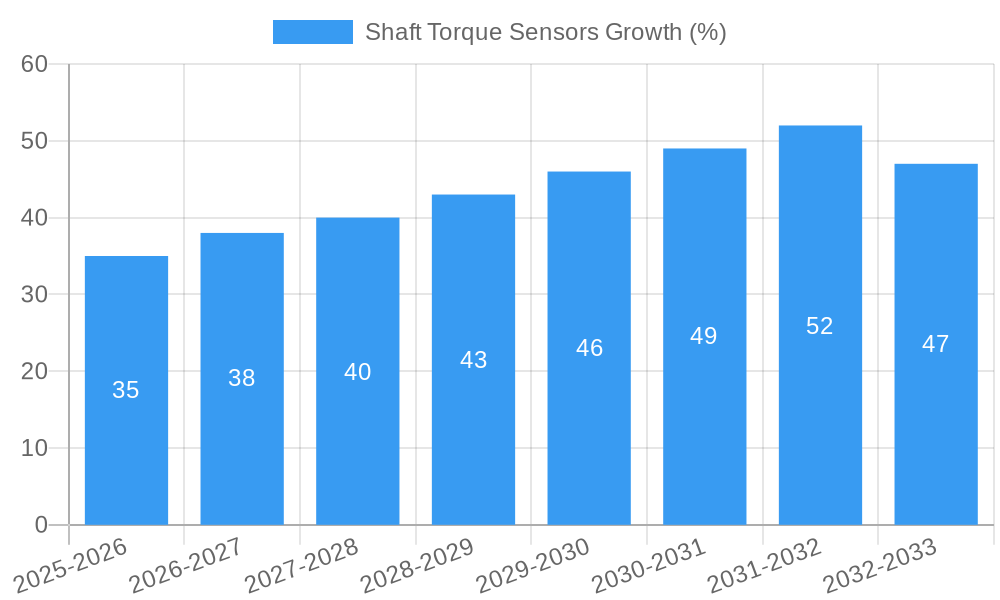
The global shaft torque sensor market is experiencing robust growth, driven by increasing automation across various industries and the rising demand for precise process control. The market, estimated at $500 million in 2025, is projected to expand at a Compound Annual Growth Rate (CAGR) of 7% from 2025 to 2033, reaching approximately $850 million by 2033. This growth is fueled by several key factors: the expanding adoption of electric vehicles (EVs) and hybrid electric vehicles (HEVs), which rely heavily on accurate torque measurement for optimal performance and efficiency; the increasing demand for precise control systems in industrial automation, robotics, and manufacturing processes; and the growing need for improved energy efficiency and predictive maintenance in various applications. Key players like YDNS, FUTEK, and Kistler are actively shaping the market through technological innovation and strategic partnerships, further contributing to market expansion.
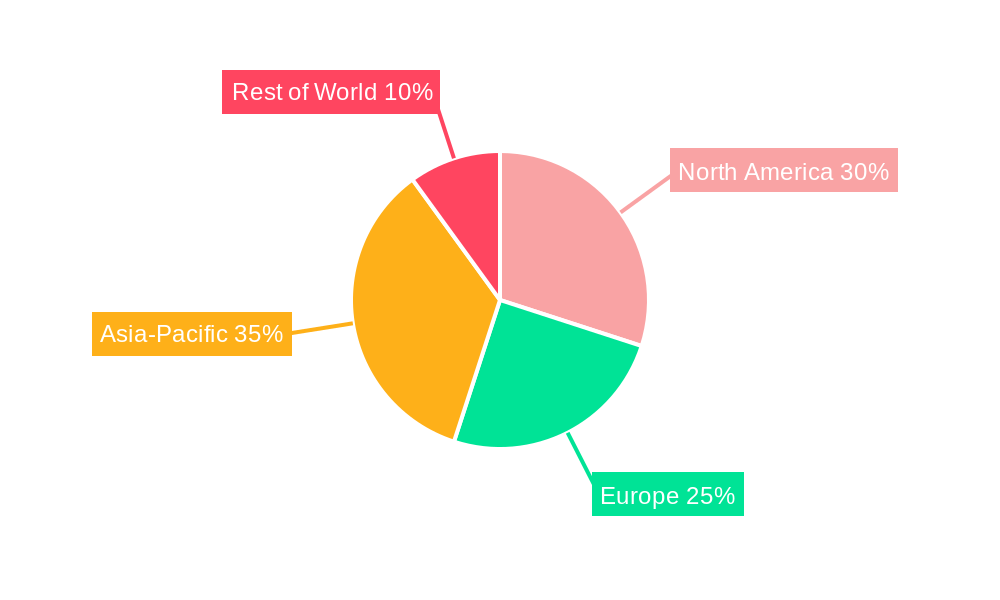
Growth is further facilitated by advancements in sensor technology, leading to smaller, more precise, and cost-effective shaft torque sensors. However, challenges such as the high initial investment cost of implementing these sensors and the complexity associated with integrating them into existing systems can act as market restraints. Market segmentation reveals strong demand across automotive, industrial automation, aerospace, and energy sectors. The regional distribution of the market is expected to show significant growth in Asia-Pacific, driven by increasing industrialization and manufacturing activities in countries like China and India. North America and Europe will also remain key regions, contributing significantly to the market's overall value due to established automotive and industrial automation sectors. Future market development will likely focus on the integration of advanced analytics and IoT capabilities within shaft torque sensors for improved data collection and predictive maintenance.
Shaft Torque Sensors Market Report: 2019-2033
This comprehensive report provides a detailed analysis of the global Shaft Torque Sensors market, offering invaluable insights for industry professionals, investors, and strategic decision-makers. The report covers the period 2019-2033, with a focus on the forecast period 2025-2033, using 2025 as the base year. The study encompasses a detailed examination of market dynamics, growth trends, regional segmentation, product landscape, key players, and emerging opportunities within the parent market of industrial sensors and the child market of power transmission monitoring. The report projects a market size of xx million units by 2033.
Shaft Torque Sensors Market Dynamics & Structure
The global shaft torque sensor market is characterized by moderate concentration, with key players holding significant market share. The market is driven by technological advancements in sensor technology, miniaturization, and improved accuracy. Stringent regulatory frameworks regarding safety and emissions in various industries are also shaping market growth. Competitive substitutes include strain gauges and load cells, but shaft torque sensors offer superior precision and ease of integration. The end-user demographic is diverse, spanning automotive, aerospace, robotics, and energy sectors. M&A activity has been moderate, with approximately xx deals recorded in the historical period (2019-2024), primarily focused on strategic acquisitions to expand product portfolios and geographical reach.
- Market Concentration: Moderately concentrated, with top 5 players holding approximately xx% market share in 2025.
- Technological Innovation: Significant advancements in MEMS technology, wireless communication, and data analytics are driving innovation.
- Regulatory Landscape: Stringent safety and emission regulations in automotive and industrial sectors are fueling demand.
- Competitive Substitutes: Strain gauges and load cells pose competition, but shaft torque sensors offer higher accuracy and integration advantages.
- End-User Demographics: Automotive, aerospace, robotics, energy, and industrial automation are key end-use segments.
- M&A Activity: xx M&A deals in 2019-2024, driven by expansion strategies and technological integration.
Shaft Torque Sensors Growth Trends & Insights
The global shaft torque sensor market experienced a Compound Annual Growth Rate (CAGR) of xx% during the historical period (2019-2024), driven by increasing automation across various industries. Market penetration is expected to increase significantly in the forecast period (2025-2033), fueled by the growing adoption of Industry 4.0 technologies and the demand for precise real-time process monitoring. Technological disruptions, such as the introduction of IoT-enabled sensors and advanced data analytics, are further accelerating market growth. Consumer behavior shifts towards greater emphasis on energy efficiency and predictive maintenance are also significant growth drivers. The market is expected to reach xx million units by 2033, representing a CAGR of xx% during the forecast period.
Dominant Regions, Countries, or Segments in Shaft Torque Sensors
North America currently holds the largest market share, driven by robust industrial automation and automotive sectors. Europe and Asia-Pacific are also experiencing significant growth, fueled by government initiatives promoting renewable energy and industrial modernization. Within these regions, countries like the United States, Germany, China, and Japan are leading the market.
- Key Drivers in North America: Strong industrial base, high adoption of automation technologies, and stringent emission regulations.
- Key Drivers in Europe: Focus on renewable energy, industrial automation initiatives, and robust automotive industry.
- Key Drivers in Asia-Pacific: Rapid industrialization, expanding automotive and manufacturing sectors, and government investments in infrastructure.
- Market Share: North America holds approximately xx% market share, followed by Europe at xx% and Asia-Pacific at xx% in 2025.
- Growth Potential: Asia-Pacific is projected to witness the highest growth rate during the forecast period due to rapid economic development and increasing industrialization.
Shaft Torque Sensors Product Landscape
The shaft torque sensor market offers a range of products, including rotary and static sensors, with varying levels of accuracy, communication protocols, and functionalities. Recent innovations include miniaturized sensors, wireless communication capabilities, and integrated data processing units, enhancing performance and ease of integration. Unique selling propositions often center on accuracy, durability, and ease of installation. Technological advancements are primarily focused on improving measurement precision, expanding operational temperature ranges, and integrating advanced data analytics.
Key Drivers, Barriers & Challenges in Shaft Torque Sensors
Key Drivers:
- Increasing automation across industries
- Growing demand for precise real-time process monitoring
- Technological advancements in sensor technology
- Stringent emission and safety regulations
Challenges & Restraints:
- High initial investment costs for advanced sensor technologies.
- Complex integration processes in some applications.
- Potential supply chain disruptions due to geopolitical factors.
- Competitive pressure from alternative measurement technologies.
Emerging Opportunities in Shaft Torque Sensors
- Expanding applications in renewable energy sectors (wind, solar).
- Growth in robotics and automation in diverse industries.
- Development of IoT-enabled sensors for predictive maintenance.
- Increasing demand for high-accuracy sensors in specialized applications (aerospace, medical).
Growth Accelerators in the Shaft Torque Sensors Industry
Technological breakthroughs in sensor miniaturization, wireless communication, and data analytics are creating new opportunities. Strategic partnerships between sensor manufacturers and system integrators are driving market expansion. Expansion into new markets, particularly in developing economies with growing industrial sectors, is also a significant growth catalyst.
Key Players Shaping the Shaft Torque Sensors Market
- YDNS
- FUTEK
- KASensors
- Sushma Industries
- Omega Engineering
- Texense
- HBM
- Kistler
- Forsentek
- HITEC Sensors
- peacosupport
- ATO
- Applied Measurements
Notable Milestones in Shaft Torque Sensors Sector
- 2021-Q3: YDNS launched a new line of miniaturized wireless shaft torque sensors.
- 2022-Q1: FUTEK acquired a smaller sensor company specializing in high-temperature applications.
- 2023-Q2: New industry standards for torque sensor accuracy were introduced.
- 2024-Q4: A significant partnership formed between KASensors and a major automotive manufacturer.
In-Depth Shaft Torque Sensors Market Outlook
The future of the shaft torque sensor market is bright, with continuous technological innovation driving growth. The increasing adoption of automation and Industry 4.0 technologies will fuel demand across various sectors. Strategic investments in research and development, coupled with expansion into new markets, will further shape the market landscape in the coming years. The market is poised for substantial growth, driven by the increasing demand for accurate and reliable torque measurement solutions.
Shaft Torque Sensors Segmentation
-
1. Application
- 1.1. Automobile
- 1.2. Machinery
- 1.3. Others
-
2. Type
- 2.1. Static
- 2.2. Dynamic
Shaft Torque Sensors Segmentation By Geography
-
1. North America
- 1.1. United States
- 1.2. Canada
- 1.3. Mexico
-
2. South America
- 2.1. Brazil
- 2.2. Argentina
- 2.3. Rest of South America
-
3. Europe
- 3.1. United Kingdom
- 3.2. Germany
- 3.3. France
- 3.4. Italy
- 3.5. Spain
- 3.6. Russia
- 3.7. Benelux
- 3.8. Nordics
- 3.9. Rest of Europe
-
4. Middle East & Africa
- 4.1. Turkey
- 4.2. Israel
- 4.3. GCC
- 4.4. North Africa
- 4.5. South Africa
- 4.6. Rest of Middle East & Africa
-
5. Asia Pacific
- 5.1. China
- 5.2. India
- 5.3. Japan
- 5.4. South Korea
- 5.5. ASEAN
- 5.6. Oceania
- 5.7. Rest of Asia Pacific
Shaft Torque Sensors REPORT HIGHLIGHTS
| Aspects | Details |
|---|---|
| Study Period | 2019-2033 |
| Base Year | 2024 |
| Estimated Year | 2025 |
| Forecast Period | 2025-2033 |
| Historical Period | 2019-2024 |
| Growth Rate | CAGR of XXX% from 2019-2033 |
| Segmentation |
|
Table of Contents
- 1. Introduction
- 1.1. Research Scope
- 1.2. Market Segmentation
- 1.3. Research Methodology
- 1.4. Definitions and Assumptions
- 2. Executive Summary
- 2.1. Introduction
- 3. Market Dynamics
- 3.1. Introduction
- 3.2. Market Drivers
- 3.3. Market Restrains
- 3.4. Market Trends
- 4. Market Factor Analysis
- 4.1. Porters Five Forces
- 4.2. Supply/Value Chain
- 4.3. PESTEL analysis
- 4.4. Market Entropy
- 4.5. Patent/Trademark Analysis
- 5. Global Shaft Torque Sensors Analysis, Insights and Forecast, 2019-2031
- 5.1. Market Analysis, Insights and Forecast - by Application
- 5.1.1. Automobile
- 5.1.2. Machinery
- 5.1.3. Others
- 5.2. Market Analysis, Insights and Forecast - by Type
- 5.2.1. Static
- 5.2.2. Dynamic
- 5.3. Market Analysis, Insights and Forecast - by Region
- 5.3.1. North America
- 5.3.2. South America
- 5.3.3. Europe
- 5.3.4. Middle East & Africa
- 5.3.5. Asia Pacific
- 5.1. Market Analysis, Insights and Forecast - by Application
- 6. North America Shaft Torque Sensors Analysis, Insights and Forecast, 2019-2031
- 6.1. Market Analysis, Insights and Forecast - by Application
- 6.1.1. Automobile
- 6.1.2. Machinery
- 6.1.3. Others
- 6.2. Market Analysis, Insights and Forecast - by Type
- 6.2.1. Static
- 6.2.2. Dynamic
- 6.1. Market Analysis, Insights and Forecast - by Application
- 7. South America Shaft Torque Sensors Analysis, Insights and Forecast, 2019-2031
- 7.1. Market Analysis, Insights and Forecast - by Application
- 7.1.1. Automobile
- 7.1.2. Machinery
- 7.1.3. Others
- 7.2. Market Analysis, Insights and Forecast - by Type
- 7.2.1. Static
- 7.2.2. Dynamic
- 7.1. Market Analysis, Insights and Forecast - by Application
- 8. Europe Shaft Torque Sensors Analysis, Insights and Forecast, 2019-2031
- 8.1. Market Analysis, Insights and Forecast - by Application
- 8.1.1. Automobile
- 8.1.2. Machinery
- 8.1.3. Others
- 8.2. Market Analysis, Insights and Forecast - by Type
- 8.2.1. Static
- 8.2.2. Dynamic
- 8.1. Market Analysis, Insights and Forecast - by Application
- 9. Middle East & Africa Shaft Torque Sensors Analysis, Insights and Forecast, 2019-2031
- 9.1. Market Analysis, Insights and Forecast - by Application
- 9.1.1. Automobile
- 9.1.2. Machinery
- 9.1.3. Others
- 9.2. Market Analysis, Insights and Forecast - by Type
- 9.2.1. Static
- 9.2.2. Dynamic
- 9.1. Market Analysis, Insights and Forecast - by Application
- 10. Asia Pacific Shaft Torque Sensors Analysis, Insights and Forecast, 2019-2031
- 10.1. Market Analysis, Insights and Forecast - by Application
- 10.1.1. Automobile
- 10.1.2. Machinery
- 10.1.3. Others
- 10.2. Market Analysis, Insights and Forecast - by Type
- 10.2.1. Static
- 10.2.2. Dynamic
- 10.1. Market Analysis, Insights and Forecast - by Application
- 11. Competitive Analysis
- 11.1. Global Market Share Analysis 2024
- 11.2. Company Profiles
- 11.2.1 YDNS
- 11.2.1.1. Overview
- 11.2.1.2. Products
- 11.2.1.3. SWOT Analysis
- 11.2.1.4. Recent Developments
- 11.2.1.5. Financials (Based on Availability)
- 11.2.2 FUTEK
- 11.2.2.1. Overview
- 11.2.2.2. Products
- 11.2.2.3. SWOT Analysis
- 11.2.2.4. Recent Developments
- 11.2.2.5. Financials (Based on Availability)
- 11.2.3 KASensors
- 11.2.3.1. Overview
- 11.2.3.2. Products
- 11.2.3.3. SWOT Analysis
- 11.2.3.4. Recent Developments
- 11.2.3.5. Financials (Based on Availability)
- 11.2.4 Sushma Industries
- 11.2.4.1. Overview
- 11.2.4.2. Products
- 11.2.4.3. SWOT Analysis
- 11.2.4.4. Recent Developments
- 11.2.4.5. Financials (Based on Availability)
- 11.2.5 Omega Engineering
- 11.2.5.1. Overview
- 11.2.5.2. Products
- 11.2.5.3. SWOT Analysis
- 11.2.5.4. Recent Developments
- 11.2.5.5. Financials (Based on Availability)
- 11.2.6 Texense
- 11.2.6.1. Overview
- 11.2.6.2. Products
- 11.2.6.3. SWOT Analysis
- 11.2.6.4. Recent Developments
- 11.2.6.5. Financials (Based on Availability)
- 11.2.7 HBM
- 11.2.7.1. Overview
- 11.2.7.2. Products
- 11.2.7.3. SWOT Analysis
- 11.2.7.4. Recent Developments
- 11.2.7.5. Financials (Based on Availability)
- 11.2.8 Kistler
- 11.2.8.1. Overview
- 11.2.8.2. Products
- 11.2.8.3. SWOT Analysis
- 11.2.8.4. Recent Developments
- 11.2.8.5. Financials (Based on Availability)
- 11.2.9 Forsentek
- 11.2.9.1. Overview
- 11.2.9.2. Products
- 11.2.9.3. SWOT Analysis
- 11.2.9.4. Recent Developments
- 11.2.9.5. Financials (Based on Availability)
- 11.2.10 HITEC Sensors
- 11.2.10.1. Overview
- 11.2.10.2. Products
- 11.2.10.3. SWOT Analysis
- 11.2.10.4. Recent Developments
- 11.2.10.5. Financials (Based on Availability)
- 11.2.11 peacosupport
- 11.2.11.1. Overview
- 11.2.11.2. Products
- 11.2.11.3. SWOT Analysis
- 11.2.11.4. Recent Developments
- 11.2.11.5. Financials (Based on Availability)
- 11.2.12 ATO
- 11.2.12.1. Overview
- 11.2.12.2. Products
- 11.2.12.3. SWOT Analysis
- 11.2.12.4. Recent Developments
- 11.2.12.5. Financials (Based on Availability)
- 11.2.13 Applied Measurements
- 11.2.13.1. Overview
- 11.2.13.2. Products
- 11.2.13.3. SWOT Analysis
- 11.2.13.4. Recent Developments
- 11.2.13.5. Financials (Based on Availability)
- 11.2.1 YDNS
List of Figures
- Figure 1: Global Shaft Torque Sensors Revenue Breakdown (million, %) by Region 2024 & 2032
- Figure 2: Global Shaft Torque Sensors Volume Breakdown (K, %) by Region 2024 & 2032
- Figure 3: North America Shaft Torque Sensors Revenue (million), by Application 2024 & 2032
- Figure 4: North America Shaft Torque Sensors Volume (K), by Application 2024 & 2032
- Figure 5: North America Shaft Torque Sensors Revenue Share (%), by Application 2024 & 2032
- Figure 6: North America Shaft Torque Sensors Volume Share (%), by Application 2024 & 2032
- Figure 7: North America Shaft Torque Sensors Revenue (million), by Type 2024 & 2032
- Figure 8: North America Shaft Torque Sensors Volume (K), by Type 2024 & 2032
- Figure 9: North America Shaft Torque Sensors Revenue Share (%), by Type 2024 & 2032
- Figure 10: North America Shaft Torque Sensors Volume Share (%), by Type 2024 & 2032
- Figure 11: North America Shaft Torque Sensors Revenue (million), by Country 2024 & 2032
- Figure 12: North America Shaft Torque Sensors Volume (K), by Country 2024 & 2032
- Figure 13: North America Shaft Torque Sensors Revenue Share (%), by Country 2024 & 2032
- Figure 14: North America Shaft Torque Sensors Volume Share (%), by Country 2024 & 2032
- Figure 15: South America Shaft Torque Sensors Revenue (million), by Application 2024 & 2032
- Figure 16: South America Shaft Torque Sensors Volume (K), by Application 2024 & 2032
- Figure 17: South America Shaft Torque Sensors Revenue Share (%), by Application 2024 & 2032
- Figure 18: South America Shaft Torque Sensors Volume Share (%), by Application 2024 & 2032
- Figure 19: South America Shaft Torque Sensors Revenue (million), by Type 2024 & 2032
- Figure 20: South America Shaft Torque Sensors Volume (K), by Type 2024 & 2032
- Figure 21: South America Shaft Torque Sensors Revenue Share (%), by Type 2024 & 2032
- Figure 22: South America Shaft Torque Sensors Volume Share (%), by Type 2024 & 2032
- Figure 23: South America Shaft Torque Sensors Revenue (million), by Country 2024 & 2032
- Figure 24: South America Shaft Torque Sensors Volume (K), by Country 2024 & 2032
- Figure 25: South America Shaft Torque Sensors Revenue Share (%), by Country 2024 & 2032
- Figure 26: South America Shaft Torque Sensors Volume Share (%), by Country 2024 & 2032
- Figure 27: Europe Shaft Torque Sensors Revenue (million), by Application 2024 & 2032
- Figure 28: Europe Shaft Torque Sensors Volume (K), by Application 2024 & 2032
- Figure 29: Europe Shaft Torque Sensors Revenue Share (%), by Application 2024 & 2032
- Figure 30: Europe Shaft Torque Sensors Volume Share (%), by Application 2024 & 2032
- Figure 31: Europe Shaft Torque Sensors Revenue (million), by Type 2024 & 2032
- Figure 32: Europe Shaft Torque Sensors Volume (K), by Type 2024 & 2032
- Figure 33: Europe Shaft Torque Sensors Revenue Share (%), by Type 2024 & 2032
- Figure 34: Europe Shaft Torque Sensors Volume Share (%), by Type 2024 & 2032
- Figure 35: Europe Shaft Torque Sensors Revenue (million), by Country 2024 & 2032
- Figure 36: Europe Shaft Torque Sensors Volume (K), by Country 2024 & 2032
- Figure 37: Europe Shaft Torque Sensors Revenue Share (%), by Country 2024 & 2032
- Figure 38: Europe Shaft Torque Sensors Volume Share (%), by Country 2024 & 2032
- Figure 39: Middle East & Africa Shaft Torque Sensors Revenue (million), by Application 2024 & 2032
- Figure 40: Middle East & Africa Shaft Torque Sensors Volume (K), by Application 2024 & 2032
- Figure 41: Middle East & Africa Shaft Torque Sensors Revenue Share (%), by Application 2024 & 2032
- Figure 42: Middle East & Africa Shaft Torque Sensors Volume Share (%), by Application 2024 & 2032
- Figure 43: Middle East & Africa Shaft Torque Sensors Revenue (million), by Type 2024 & 2032
- Figure 44: Middle East & Africa Shaft Torque Sensors Volume (K), by Type 2024 & 2032
- Figure 45: Middle East & Africa Shaft Torque Sensors Revenue Share (%), by Type 2024 & 2032
- Figure 46: Middle East & Africa Shaft Torque Sensors Volume Share (%), by Type 2024 & 2032
- Figure 47: Middle East & Africa Shaft Torque Sensors Revenue (million), by Country 2024 & 2032
- Figure 48: Middle East & Africa Shaft Torque Sensors Volume (K), by Country 2024 & 2032
- Figure 49: Middle East & Africa Shaft Torque Sensors Revenue Share (%), by Country 2024 & 2032
- Figure 50: Middle East & Africa Shaft Torque Sensors Volume Share (%), by Country 2024 & 2032
- Figure 51: Asia Pacific Shaft Torque Sensors Revenue (million), by Application 2024 & 2032
- Figure 52: Asia Pacific Shaft Torque Sensors Volume (K), by Application 2024 & 2032
- Figure 53: Asia Pacific Shaft Torque Sensors Revenue Share (%), by Application 2024 & 2032
- Figure 54: Asia Pacific Shaft Torque Sensors Volume Share (%), by Application 2024 & 2032
- Figure 55: Asia Pacific Shaft Torque Sensors Revenue (million), by Type 2024 & 2032
- Figure 56: Asia Pacific Shaft Torque Sensors Volume (K), by Type 2024 & 2032
- Figure 57: Asia Pacific Shaft Torque Sensors Revenue Share (%), by Type 2024 & 2032
- Figure 58: Asia Pacific Shaft Torque Sensors Volume Share (%), by Type 2024 & 2032
- Figure 59: Asia Pacific Shaft Torque Sensors Revenue (million), by Country 2024 & 2032
- Figure 60: Asia Pacific Shaft Torque Sensors Volume (K), by Country 2024 & 2032
- Figure 61: Asia Pacific Shaft Torque Sensors Revenue Share (%), by Country 2024 & 2032
- Figure 62: Asia Pacific Shaft Torque Sensors Volume Share (%), by Country 2024 & 2032
List of Tables
- Table 1: Global Shaft Torque Sensors Revenue million Forecast, by Region 2019 & 2032
- Table 2: Global Shaft Torque Sensors Volume K Forecast, by Region 2019 & 2032
- Table 3: Global Shaft Torque Sensors Revenue million Forecast, by Application 2019 & 2032
- Table 4: Global Shaft Torque Sensors Volume K Forecast, by Application 2019 & 2032
- Table 5: Global Shaft Torque Sensors Revenue million Forecast, by Type 2019 & 2032
- Table 6: Global Shaft Torque Sensors Volume K Forecast, by Type 2019 & 2032
- Table 7: Global Shaft Torque Sensors Revenue million Forecast, by Region 2019 & 2032
- Table 8: Global Shaft Torque Sensors Volume K Forecast, by Region 2019 & 2032
- Table 9: Global Shaft Torque Sensors Revenue million Forecast, by Application 2019 & 2032
- Table 10: Global Shaft Torque Sensors Volume K Forecast, by Application 2019 & 2032
- Table 11: Global Shaft Torque Sensors Revenue million Forecast, by Type 2019 & 2032
- Table 12: Global Shaft Torque Sensors Volume K Forecast, by Type 2019 & 2032
- Table 13: Global Shaft Torque Sensors Revenue million Forecast, by Country 2019 & 2032
- Table 14: Global Shaft Torque Sensors Volume K Forecast, by Country 2019 & 2032
- Table 15: United States Shaft Torque Sensors Revenue (million) Forecast, by Application 2019 & 2032
- Table 16: United States Shaft Torque Sensors Volume (K) Forecast, by Application 2019 & 2032
- Table 17: Canada Shaft Torque Sensors Revenue (million) Forecast, by Application 2019 & 2032
- Table 18: Canada Shaft Torque Sensors Volume (K) Forecast, by Application 2019 & 2032
- Table 19: Mexico Shaft Torque Sensors Revenue (million) Forecast, by Application 2019 & 2032
- Table 20: Mexico Shaft Torque Sensors Volume (K) Forecast, by Application 2019 & 2032
- Table 21: Global Shaft Torque Sensors Revenue million Forecast, by Application 2019 & 2032
- Table 22: Global Shaft Torque Sensors Volume K Forecast, by Application 2019 & 2032
- Table 23: Global Shaft Torque Sensors Revenue million Forecast, by Type 2019 & 2032
- Table 24: Global Shaft Torque Sensors Volume K Forecast, by Type 2019 & 2032
- Table 25: Global Shaft Torque Sensors Revenue million Forecast, by Country 2019 & 2032
- Table 26: Global Shaft Torque Sensors Volume K Forecast, by Country 2019 & 2032
- Table 27: Brazil Shaft Torque Sensors Revenue (million) Forecast, by Application 2019 & 2032
- Table 28: Brazil Shaft Torque Sensors Volume (K) Forecast, by Application 2019 & 2032
- Table 29: Argentina Shaft Torque Sensors Revenue (million) Forecast, by Application 2019 & 2032
- Table 30: Argentina Shaft Torque Sensors Volume (K) Forecast, by Application 2019 & 2032
- Table 31: Rest of South America Shaft Torque Sensors Revenue (million) Forecast, by Application 2019 & 2032
- Table 32: Rest of South America Shaft Torque Sensors Volume (K) Forecast, by Application 2019 & 2032
- Table 33: Global Shaft Torque Sensors Revenue million Forecast, by Application 2019 & 2032
- Table 34: Global Shaft Torque Sensors Volume K Forecast, by Application 2019 & 2032
- Table 35: Global Shaft Torque Sensors Revenue million Forecast, by Type 2019 & 2032
- Table 36: Global Shaft Torque Sensors Volume K Forecast, by Type 2019 & 2032
- Table 37: Global Shaft Torque Sensors Revenue million Forecast, by Country 2019 & 2032
- Table 38: Global Shaft Torque Sensors Volume K Forecast, by Country 2019 & 2032
- Table 39: United Kingdom Shaft Torque Sensors Revenue (million) Forecast, by Application 2019 & 2032
- Table 40: United Kingdom Shaft Torque Sensors Volume (K) Forecast, by Application 2019 & 2032
- Table 41: Germany Shaft Torque Sensors Revenue (million) Forecast, by Application 2019 & 2032
- Table 42: Germany Shaft Torque Sensors Volume (K) Forecast, by Application 2019 & 2032
- Table 43: France Shaft Torque Sensors Revenue (million) Forecast, by Application 2019 & 2032
- Table 44: France Shaft Torque Sensors Volume (K) Forecast, by Application 2019 & 2032
- Table 45: Italy Shaft Torque Sensors Revenue (million) Forecast, by Application 2019 & 2032
- Table 46: Italy Shaft Torque Sensors Volume (K) Forecast, by Application 2019 & 2032
- Table 47: Spain Shaft Torque Sensors Revenue (million) Forecast, by Application 2019 & 2032
- Table 48: Spain Shaft Torque Sensors Volume (K) Forecast, by Application 2019 & 2032
- Table 49: Russia Shaft Torque Sensors Revenue (million) Forecast, by Application 2019 & 2032
- Table 50: Russia Shaft Torque Sensors Volume (K) Forecast, by Application 2019 & 2032
- Table 51: Benelux Shaft Torque Sensors Revenue (million) Forecast, by Application 2019 & 2032
- Table 52: Benelux Shaft Torque Sensors Volume (K) Forecast, by Application 2019 & 2032
- Table 53: Nordics Shaft Torque Sensors Revenue (million) Forecast, by Application 2019 & 2032
- Table 54: Nordics Shaft Torque Sensors Volume (K) Forecast, by Application 2019 & 2032
- Table 55: Rest of Europe Shaft Torque Sensors Revenue (million) Forecast, by Application 2019 & 2032
- Table 56: Rest of Europe Shaft Torque Sensors Volume (K) Forecast, by Application 2019 & 2032
- Table 57: Global Shaft Torque Sensors Revenue million Forecast, by Application 2019 & 2032
- Table 58: Global Shaft Torque Sensors Volume K Forecast, by Application 2019 & 2032
- Table 59: Global Shaft Torque Sensors Revenue million Forecast, by Type 2019 & 2032
- Table 60: Global Shaft Torque Sensors Volume K Forecast, by Type 2019 & 2032
- Table 61: Global Shaft Torque Sensors Revenue million Forecast, by Country 2019 & 2032
- Table 62: Global Shaft Torque Sensors Volume K Forecast, by Country 2019 & 2032
- Table 63: Turkey Shaft Torque Sensors Revenue (million) Forecast, by Application 2019 & 2032
- Table 64: Turkey Shaft Torque Sensors Volume (K) Forecast, by Application 2019 & 2032
- Table 65: Israel Shaft Torque Sensors Revenue (million) Forecast, by Application 2019 & 2032
- Table 66: Israel Shaft Torque Sensors Volume (K) Forecast, by Application 2019 & 2032
- Table 67: GCC Shaft Torque Sensors Revenue (million) Forecast, by Application 2019 & 2032
- Table 68: GCC Shaft Torque Sensors Volume (K) Forecast, by Application 2019 & 2032
- Table 69: North Africa Shaft Torque Sensors Revenue (million) Forecast, by Application 2019 & 2032
- Table 70: North Africa Shaft Torque Sensors Volume (K) Forecast, by Application 2019 & 2032
- Table 71: South Africa Shaft Torque Sensors Revenue (million) Forecast, by Application 2019 & 2032
- Table 72: South Africa Shaft Torque Sensors Volume (K) Forecast, by Application 2019 & 2032
- Table 73: Rest of Middle East & Africa Shaft Torque Sensors Revenue (million) Forecast, by Application 2019 & 2032
- Table 74: Rest of Middle East & Africa Shaft Torque Sensors Volume (K) Forecast, by Application 2019 & 2032
- Table 75: Global Shaft Torque Sensors Revenue million Forecast, by Application 2019 & 2032
- Table 76: Global Shaft Torque Sensors Volume K Forecast, by Application 2019 & 2032
- Table 77: Global Shaft Torque Sensors Revenue million Forecast, by Type 2019 & 2032
- Table 78: Global Shaft Torque Sensors Volume K Forecast, by Type 2019 & 2032
- Table 79: Global Shaft Torque Sensors Revenue million Forecast, by Country 2019 & 2032
- Table 80: Global Shaft Torque Sensors Volume K Forecast, by Country 2019 & 2032
- Table 81: China Shaft Torque Sensors Revenue (million) Forecast, by Application 2019 & 2032
- Table 82: China Shaft Torque Sensors Volume (K) Forecast, by Application 2019 & 2032
- Table 83: India Shaft Torque Sensors Revenue (million) Forecast, by Application 2019 & 2032
- Table 84: India Shaft Torque Sensors Volume (K) Forecast, by Application 2019 & 2032
- Table 85: Japan Shaft Torque Sensors Revenue (million) Forecast, by Application 2019 & 2032
- Table 86: Japan Shaft Torque Sensors Volume (K) Forecast, by Application 2019 & 2032
- Table 87: South Korea Shaft Torque Sensors Revenue (million) Forecast, by Application 2019 & 2032
- Table 88: South Korea Shaft Torque Sensors Volume (K) Forecast, by Application 2019 & 2032
- Table 89: ASEAN Shaft Torque Sensors Revenue (million) Forecast, by Application 2019 & 2032
- Table 90: ASEAN Shaft Torque Sensors Volume (K) Forecast, by Application 2019 & 2032
- Table 91: Oceania Shaft Torque Sensors Revenue (million) Forecast, by Application 2019 & 2032
- Table 92: Oceania Shaft Torque Sensors Volume (K) Forecast, by Application 2019 & 2032
- Table 93: Rest of Asia Pacific Shaft Torque Sensors Revenue (million) Forecast, by Application 2019 & 2032
- Table 94: Rest of Asia Pacific Shaft Torque Sensors Volume (K) Forecast, by Application 2019 & 2032
Frequently Asked Questions
1. What is the projected Compound Annual Growth Rate (CAGR) of the Shaft Torque Sensors?
The projected CAGR is approximately XXX%.
2. Which companies are prominent players in the Shaft Torque Sensors?
Key companies in the market include YDNS, FUTEK, KASensors, Sushma Industries, Omega Engineering, Texense, HBM, Kistler, Forsentek, HITEC Sensors, peacosupport, ATO, Applied Measurements.
3. What are the main segments of the Shaft Torque Sensors?
The market segments include Application, Type.
4. Can you provide details about the market size?
The market size is estimated to be USD XXX million as of 2022.
5. What are some drivers contributing to market growth?
N/A
6. What are the notable trends driving market growth?
N/A
7. Are there any restraints impacting market growth?
N/A
8. Can you provide examples of recent developments in the market?
N/A
9. What pricing options are available for accessing the report?
Pricing options include single-user, multi-user, and enterprise licenses priced at USD 3950.00, USD 5925.00, and USD 7900.00 respectively.
10. Is the market size provided in terms of value or volume?
The market size is provided in terms of value, measured in million and volume, measured in K.
11. Are there any specific market keywords associated with the report?
Yes, the market keyword associated with the report is "Shaft Torque Sensors," which aids in identifying and referencing the specific market segment covered.
12. How do I determine which pricing option suits my needs best?
The pricing options vary based on user requirements and access needs. Individual users may opt for single-user licenses, while businesses requiring broader access may choose multi-user or enterprise licenses for cost-effective access to the report.
13. Are there any additional resources or data provided in the Shaft Torque Sensors report?
While the report offers comprehensive insights, it's advisable to review the specific contents or supplementary materials provided to ascertain if additional resources or data are available.
14. How can I stay updated on further developments or reports in the Shaft Torque Sensors?
To stay informed about further developments, trends, and reports in the Shaft Torque Sensors, consider subscribing to industry newsletters, following relevant companies and organizations, or regularly checking reputable industry news sources and publications.
Methodology
Step 1 - Identification of Relevant Samples Size from Population Database


Step 2 - Approaches for Defining Global Market Size (Value, Volume* & Price*)

Note*: In applicable scenarios
Step 3 - Data Sources
Primary Research
- Web Analytics
- Survey Reports
- Research Institute
- Latest Research Reports
- Opinion Leaders
Secondary Research
- Annual Reports
- White Paper
- Latest Press Release
- Industry Association
- Paid Database
- Investor Presentations

Step 4 - Data Triangulation
Involves using different sources of information in order to increase the validity of a study
These sources are likely to be stakeholders in a program - participants, other researchers, program staff, other community members, and so on.
Then we put all data in single framework & apply various statistical tools to find out the dynamic on the market.
During the analysis stage, feedback from the stakeholder groups would be compared to determine areas of agreement as well as areas of divergence
