

Key Insights
The Simultaneous Localization and Mapping (SLAM) market is experiencing robust growth, driven by increasing demand for autonomous systems across various sectors. The market's Compound Annual Growth Rate (CAGR) of 26.78% from 2019-2024 indicates a significant upward trajectory. This expansion is fueled by advancements in sensor technology, particularly LiDAR and computer vision, enabling more accurate and reliable mapping capabilities. Key application areas, such as autonomous vehicles, UAVs, and AR/VR, are significantly contributing to market expansion. The dominance of 3D SLAM solutions over 2D SLAM reflects the growing need for comprehensive spatial understanding in complex environments. Graph-based SLAM is emerging as a leading type, due to its ability to handle large-scale environments and incorporate loop closures effectively. While the market faces challenges like high computational costs associated with real-time processing and the need for robust algorithms to manage noisy sensor data, continuous innovation in these areas is mitigating these limitations. The competitive landscape features a mix of established tech giants and specialized SLAM solution providers, leading to a dynamic and evolving market. Geographic growth is widespread, with North America and Asia Pacific currently holding significant market shares due to high adoption rates in robotics and automotive industries.
Looking forward, the SLAM market is poised for continued expansion through 2033. The increasing integration of SLAM technology into smart homes, industrial automation, and healthcare robotics is expected to further fuel market growth. Continued R&D efforts focusing on improving accuracy, reducing latency, and enhancing the energy efficiency of SLAM algorithms will be crucial for maintaining the market's momentum. The rise of edge computing and the development of more sophisticated AI-driven algorithms will play a pivotal role in unlocking the full potential of SLAM technology across diverse applications. The market segmentation by application (UAVs and Robots, AR/VR, Autonomous Vehicles) will continue to evolve, with new applications and niche markets emerging as technology advances. The competitive landscape will likely see increased mergers and acquisitions, further consolidating the market.
Simultaneous Localization and Mapping (SLAM) Industry Market Report: 2019-2033
This comprehensive report provides an in-depth analysis of the Simultaneous Localization and Mapping (SLAM) industry, covering market dynamics, growth trends, dominant segments, product landscape, key players, and future outlook. The report covers the period from 2019 to 2033, with a focus on the 2025-2033 forecast period. The SLAM market, encompassing both the parent market of robotics and automation and its child market of navigation and mapping technologies, is poised for significant growth, driven by technological advancements and increasing adoption across diverse sectors. The market is expected to reach xx Million by 2033.
Simultaneous Localization and Mapping Industry Market Dynamics & Structure
The SLAM market exhibits a moderately fragmented structure with key players competing on innovation, application specialization, and cost-effectiveness. Technological innovation, particularly in sensor technologies (LiDAR, cameras, IMUs) and algorithm development (e.g., Graph-Based SLAM), are major drivers. Regulatory frameworks governing autonomous systems and data privacy influence market adoption, especially in sectors like autonomous vehicles. Competitive substitutes include traditional mapping techniques, but SLAM's real-time capabilities offer a significant advantage. End-user demographics span diverse industries, including robotics, AR/VR, automotive, and logistics. M&A activity has been relatively moderate (xx deals in the last 5 years), driven by the desire to acquire specialized technologies and expand market reach.
- Market Concentration: Moderately Fragmented (HHI: xx)
- Technological Innovation: Rapid advancements in sensor technology and SLAM algorithms.
- Regulatory Landscape: Varying regulations across regions impacting adoption rates.
- Competitive Substitutes: Traditional mapping methods, GPS.
- End-User Demographics: Diverse, including manufacturing, logistics, automotive, and consumer electronics.
- M&A Activity: xx deals in the past 5 years, primarily focused on technology acquisitions.
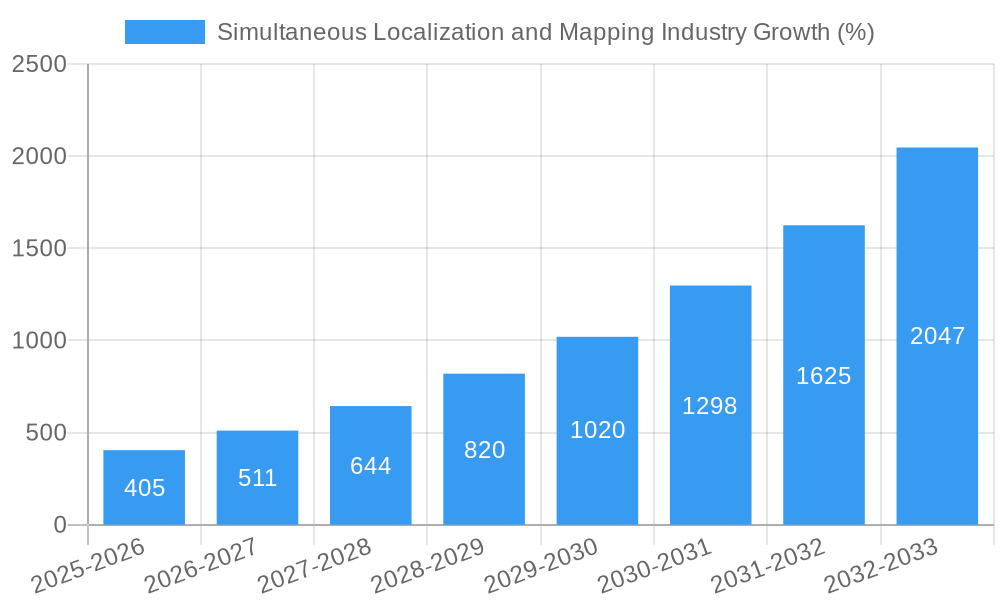
Simultaneous Localization and Mapping Industry Growth Trends & Insights
The SLAM market experienced substantial growth during the historical period (2019-2024), driven by increasing demand for autonomous systems and the decreasing cost of sensor technologies. This growth is projected to continue at a CAGR of xx% from 2025 to 2033, reaching a market size of xx Million by 2033. Market penetration is highest in the robotics and UAV segments, with significant growth potential in autonomous vehicles and AR/VR. Technological disruptions, such as the development of more accurate and affordable LiDAR sensors, are accelerating adoption. Consumer behavior shifts towards increased acceptance of autonomous systems further fuel market expansion. The increasing sophistication of SLAM algorithms, enabling more robust and reliable performance in challenging environments, also contributes to market expansion. The market is also witnessing an increased focus on cloud-based SLAM solutions which enables enhanced collaboration, data management, and scalability.
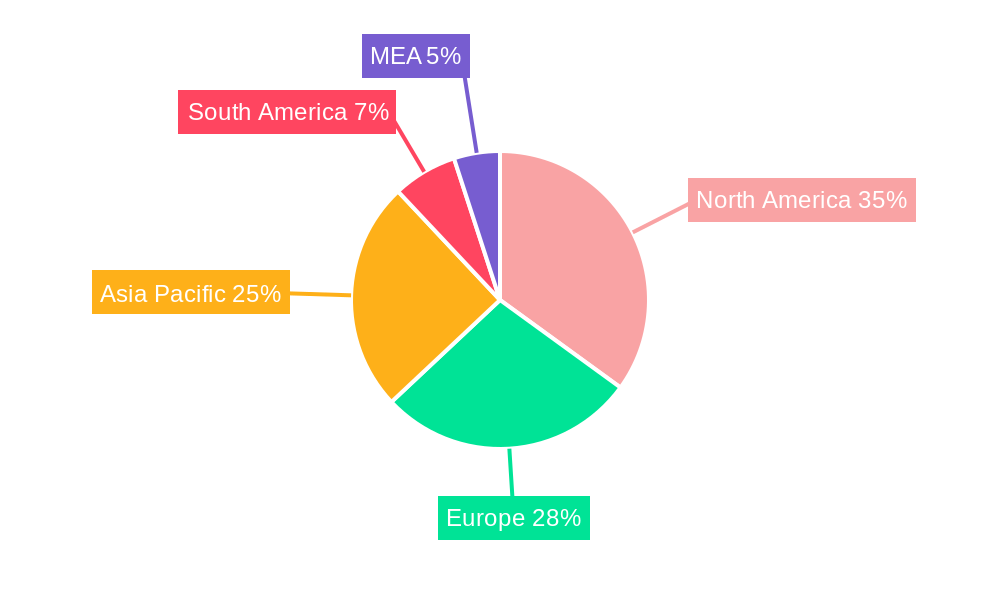
Dominant Regions, Countries, or Segments in Simultaneous Localization and Mapping Industry
North America currently holds the largest market share in the SLAM industry, followed by Europe and Asia-Pacific. This dominance is primarily attributed to early adoption of advanced technologies, significant investments in R&D, and a robust presence of key players. Within segments, 3D SLAM is experiencing faster growth than 2D SLAM due to its versatility in applications like autonomous vehicles and robotics. The UAV and Robots application segment dominates currently, driven by widespread adoption in logistics, inspection, and surveillance. However, the AR/VR and Autonomous Vehicles segments are expected to exhibit faster growth during the forecast period.
- Leading Region: North America (Market Share: xx%)
- Fastest-Growing Segment (By Type): 3D SLAM (CAGR: xx%)
- Fastest-Growing Segment (By Application): Autonomous Vehicles (CAGR: xx%)
- Key Growth Drivers: High government spending on R&D, growing demand for automated systems, and increasing investments in infrastructure.
Simultaneous Localization and Mapping Industry Product Landscape
The SLAM product landscape is characterized by a wide range of software and hardware solutions, including standalone SLAM units, integrated sensor systems, and cloud-based platforms. Key innovations include advancements in sensor fusion techniques, improved algorithm accuracy, and the development of robust real-time processing capabilities. These innovations enhance the reliability, accuracy, and efficiency of SLAM systems across various applications. Many companies are focused on developing user-friendly and easily integrable solutions, expanding the accessibility and affordability of SLAM technology. The focus is also on developing solutions which can handle increasingly complex environments and high volumes of data effectively.
Key Drivers, Barriers & Challenges in Simultaneous Localization and Mapping Industry
Key Drivers:
- Technological advancements in sensor technologies and algorithm development.
- Increasing demand for automation across various industries.
- Government initiatives promoting autonomous vehicle development.
Challenges:
- High initial investment costs for hardware and software.
- Algorithm limitations in complex and dynamic environments.
- Concerns about data privacy and security.
- Supply chain disruptions impacting the availability of key components (estimated impact: xx% reduction in production in 2023).
Emerging Opportunities in Simultaneous Localization and Mapping Industry
- Expansion into new applications, such as smart agriculture and healthcare robotics.
- Development of low-cost, energy-efficient SLAM solutions for consumer electronics.
- Integration of SLAM technology with other technologies like AI and machine learning.
- Rise of cloud-based SLAM solutions, facilitating data sharing and collaborative mapping.
Growth Accelerators in the Simultaneous Localization and Mapping Industry
The long-term growth of the SLAM market will be fueled by continuous technological innovation, strategic partnerships between hardware and software providers, and expansion into new, untapped markets. The increasing integration of SLAM with other emerging technologies like AI and machine learning will create a wider range of applications and opportunities, further accelerating market growth. Furthermore, government regulations and policies promoting autonomous systems and digitalization will provide a strong supportive environment for continued market expansion.
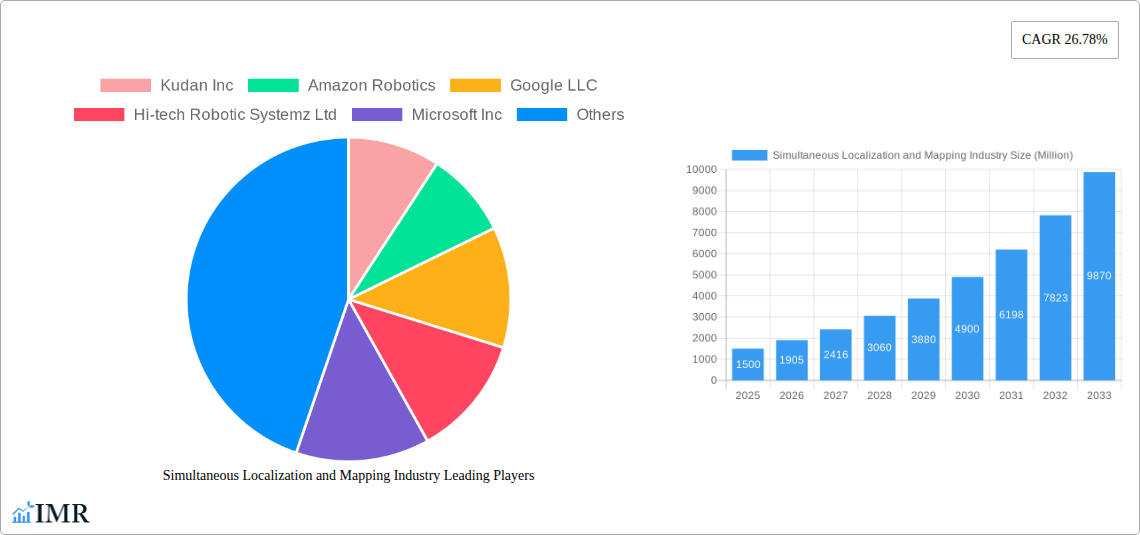
Key Players Shaping the Simultaneous Localization and Mapping Industry Market
- Kudan Inc
- Amazon Robotics
- Google LLC
- Hi-tech Robotic Systemz Ltd
- Microsoft Inc
- MAXST Developers
- Apple Inc
- Aethon Inc
- ClearPath Robotics
- Rethink Robotic
Notable Milestones in Simultaneous Localization and Mapping Industry Sector
- July 2022: Polymath Robotics launches SDK-integrated plug-and-play software for industrial vehicle automation.
- November 2022: dConstruct utilizes Ouster digital lidar for highly accurate SLAMs and point cloud maps in Singapore.
- February 2023: KUKA launches Intralogistics Robot with advanced safety features and 3D object detection.
In-Depth Simultaneous Localization and Mapping Industry Market Outlook
The future of the SLAM market looks bright, with significant growth potential driven by continued technological advancements, increasing demand for automation, and the expansion into new application areas. Strategic partnerships and collaborations among industry players are expected to play a crucial role in shaping the market landscape. The integration of SLAM with other emerging technologies will open up new avenues for innovation, creating a wider range of applications and opportunities. The market is expected to continue its trajectory of robust growth, with significant opportunities for companies that can deliver innovative, cost-effective, and reliable SLAM solutions.
Simultaneous Localization and Mapping Industry Segmentation
-
1. Type
- 1.1. EKF SLAM
- 1.2. Fast SLAM
- 1.3. Graph-Based SLAM
- 1.4. Others
-
2. Offering
- 2.1. 2D SLAM
- 2.2. 3D SLAM
-
3. Application
- 3.1. UAV and Robots
- 3.2. AR/VR
- 3.3. Autonomous Vehicles
- 3.4. Other Applications
Simultaneous Localization and Mapping Industry Segmentation By Geography
-
1. North America
- 1.1. United States
- 1.2. Canada
-
2. Europe
- 2.1. Germany
- 2.2. United Kingdoms
- 2.3. France
- 2.4. Rest of the Europe
-
3. Asia Pacific
- 3.1. China
- 3.2. India
- 3.3. Japan
- 3.4. Rest of Asia Pacific
- 4. Middle East and Africa
Simultaneous Localization and Mapping Industry REPORT HIGHLIGHTS
| Aspects | Details |
|---|---|
| Study Period | 2019-2033 |
| Base Year | 2024 |
| Estimated Year | 2025 |
| Forecast Period | 2025-2033 |
| Historical Period | 2019-2024 |
| Growth Rate | CAGR of 26.78% from 2019-2033 |
| Segmentation |
|
Table of Contents
- 1. Introduction
- 1.1. Research Scope
- 1.2. Market Segmentation
- 1.3. Research Methodology
- 1.4. Definitions and Assumptions
- 2. Executive Summary
- 2.1. Introduction
- 3. Market Dynamics
- 3.1. Introduction
- 3.2. Market Drivers
- 3.2.1. Growing Penetration of Mapping Technologies in Domestic Robots and UAV; Advancements in Visual SLAM Algorithm; Increasing Application of SLAM in Augmented Reality
- 3.3. Market Restrains
- 3.3.1. ; The Risk of Interference from Other Wireless Device
- 3.4. Market Trends
- 3.4.1. UAVs and Robots Will Experience Significant Growth in the Market
- 4. Market Factor Analysis
- 4.1. Porters Five Forces
- 4.2. Supply/Value Chain
- 4.3. PESTEL analysis
- 4.4. Market Entropy
- 4.5. Patent/Trademark Analysis
- 5. Global Simultaneous Localization and Mapping Industry Analysis, Insights and Forecast, 2019-2031
- 5.1. Market Analysis, Insights and Forecast - by Type
- 5.1.1. EKF SLAM
- 5.1.2. Fast SLAM
- 5.1.3. Graph-Based SLAM
- 5.1.4. Others
- 5.2. Market Analysis, Insights and Forecast - by Offering
- 5.2.1. 2D SLAM
- 5.2.2. 3D SLAM
- 5.3. Market Analysis, Insights and Forecast - by Application
- 5.3.1. UAV and Robots
- 5.3.2. AR/VR
- 5.3.3. Autonomous Vehicles
- 5.3.4. Other Applications
- 5.4. Market Analysis, Insights and Forecast - by Region
- 5.4.1. North America
- 5.4.2. Europe
- 5.4.3. Asia Pacific
- 5.4.4. Middle East and Africa
- 5.1. Market Analysis, Insights and Forecast - by Type
- 6. North America Simultaneous Localization and Mapping Industry Analysis, Insights and Forecast, 2019-2031
- 6.1. Market Analysis, Insights and Forecast - by Type
- 6.1.1. EKF SLAM
- 6.1.2. Fast SLAM
- 6.1.3. Graph-Based SLAM
- 6.1.4. Others
- 6.2. Market Analysis, Insights and Forecast - by Offering
- 6.2.1. 2D SLAM
- 6.2.2. 3D SLAM
- 6.3. Market Analysis, Insights and Forecast - by Application
- 6.3.1. UAV and Robots
- 6.3.2. AR/VR
- 6.3.3. Autonomous Vehicles
- 6.3.4. Other Applications
- 6.1. Market Analysis, Insights and Forecast - by Type
- 7. Europe Simultaneous Localization and Mapping Industry Analysis, Insights and Forecast, 2019-2031
- 7.1. Market Analysis, Insights and Forecast - by Type
- 7.1.1. EKF SLAM
- 7.1.2. Fast SLAM
- 7.1.3. Graph-Based SLAM
- 7.1.4. Others
- 7.2. Market Analysis, Insights and Forecast - by Offering
- 7.2.1. 2D SLAM
- 7.2.2. 3D SLAM
- 7.3. Market Analysis, Insights and Forecast - by Application
- 7.3.1. UAV and Robots
- 7.3.2. AR/VR
- 7.3.3. Autonomous Vehicles
- 7.3.4. Other Applications
- 7.1. Market Analysis, Insights and Forecast - by Type
- 8. Asia Pacific Simultaneous Localization and Mapping Industry Analysis, Insights and Forecast, 2019-2031
- 8.1. Market Analysis, Insights and Forecast - by Type
- 8.1.1. EKF SLAM
- 8.1.2. Fast SLAM
- 8.1.3. Graph-Based SLAM
- 8.1.4. Others
- 8.2. Market Analysis, Insights and Forecast - by Offering
- 8.2.1. 2D SLAM
- 8.2.2. 3D SLAM
- 8.3. Market Analysis, Insights and Forecast - by Application
- 8.3.1. UAV and Robots
- 8.3.2. AR/VR
- 8.3.3. Autonomous Vehicles
- 8.3.4. Other Applications
- 8.1. Market Analysis, Insights and Forecast - by Type
- 9. Middle East and Africa Simultaneous Localization and Mapping Industry Analysis, Insights and Forecast, 2019-2031
- 9.1. Market Analysis, Insights and Forecast - by Type
- 9.1.1. EKF SLAM
- 9.1.2. Fast SLAM
- 9.1.3. Graph-Based SLAM
- 9.1.4. Others
- 9.2. Market Analysis, Insights and Forecast - by Offering
- 9.2.1. 2D SLAM
- 9.2.2. 3D SLAM
- 9.3. Market Analysis, Insights and Forecast - by Application
- 9.3.1. UAV and Robots
- 9.3.2. AR/VR
- 9.3.3. Autonomous Vehicles
- 9.3.4. Other Applications
- 9.1. Market Analysis, Insights and Forecast - by Type
- 10. North America Simultaneous Localization and Mapping Industry Analysis, Insights and Forecast, 2019-2031
- 10.1. Market Analysis, Insights and Forecast - By Country/Sub-region
- 10.1.1 United States
- 10.1.2 Canada
- 10.1.3 Mexico
- 11. Europe Simultaneous Localization and Mapping Industry Analysis, Insights and Forecast, 2019-2031
- 11.1. Market Analysis, Insights and Forecast - By Country/Sub-region
- 11.1.1 Germany
- 11.1.2 United Kingdom
- 11.1.3 France
- 11.1.4 Spain
- 11.1.5 Italy
- 11.1.6 Spain
- 11.1.7 Belgium
- 11.1.8 Netherland
- 11.1.9 Nordics
- 11.1.10 Rest of Europe
- 12. Asia Pacific Simultaneous Localization and Mapping Industry Analysis, Insights and Forecast, 2019-2031
- 12.1. Market Analysis, Insights and Forecast - By Country/Sub-region
- 12.1.1 China
- 12.1.2 Japan
- 12.1.3 India
- 12.1.4 South Korea
- 12.1.5 Southeast Asia
- 12.1.6 Australia
- 12.1.7 Indonesia
- 12.1.8 Phillipes
- 12.1.9 Singapore
- 12.1.10 Thailandc
- 12.1.11 Rest of Asia Pacific
- 13. South America Simultaneous Localization and Mapping Industry Analysis, Insights and Forecast, 2019-2031
- 13.1. Market Analysis, Insights and Forecast - By Country/Sub-region
- 13.1.1 Brazil
- 13.1.2 Argentina
- 13.1.3 Peru
- 13.1.4 Chile
- 13.1.5 Colombia
- 13.1.6 Ecuador
- 13.1.7 Venezuela
- 13.1.8 Rest of South America
- 14. North America Simultaneous Localization and Mapping Industry Analysis, Insights and Forecast, 2019-2031
- 14.1. Market Analysis, Insights and Forecast - By Country/Sub-region
- 14.1.1 United States
- 14.1.2 Canada
- 14.1.3 Mexico
- 15. MEA Simultaneous Localization and Mapping Industry Analysis, Insights and Forecast, 2019-2031
- 15.1. Market Analysis, Insights and Forecast - By Country/Sub-region
- 15.1.1 United Arab Emirates
- 15.1.2 Saudi Arabia
- 15.1.3 South Africa
- 15.1.4 Rest of Middle East and Africa
- 16. Competitive Analysis
- 16.1. Global Market Share Analysis 2024
- 16.2. Company Profiles
- 16.2.1 Kudan Inc
- 16.2.1.1. Overview
- 16.2.1.2. Products
- 16.2.1.3. SWOT Analysis
- 16.2.1.4. Recent Developments
- 16.2.1.5. Financials (Based on Availability)
- 16.2.2 Amazon Robotics
- 16.2.2.1. Overview
- 16.2.2.2. Products
- 16.2.2.3. SWOT Analysis
- 16.2.2.4. Recent Developments
- 16.2.2.5. Financials (Based on Availability)
- 16.2.3 Google LLC
- 16.2.3.1. Overview
- 16.2.3.2. Products
- 16.2.3.3. SWOT Analysis
- 16.2.3.4. Recent Developments
- 16.2.3.5. Financials (Based on Availability)
- 16.2.4 Hi-tech Robotic Systemz Ltd
- 16.2.4.1. Overview
- 16.2.4.2. Products
- 16.2.4.3. SWOT Analysis
- 16.2.4.4. Recent Developments
- 16.2.4.5. Financials (Based on Availability)
- 16.2.5 Microsoft Inc
- 16.2.5.1. Overview
- 16.2.5.2. Products
- 16.2.5.3. SWOT Analysis
- 16.2.5.4. Recent Developments
- 16.2.5.5. Financials (Based on Availability)
- 16.2.6 MAXST Developers
- 16.2.6.1. Overview
- 16.2.6.2. Products
- 16.2.6.3. SWOT Analysis
- 16.2.6.4. Recent Developments
- 16.2.6.5. Financials (Based on Availability)
- 16.2.7 Apple Inc
- 16.2.7.1. Overview
- 16.2.7.2. Products
- 16.2.7.3. SWOT Analysis
- 16.2.7.4. Recent Developments
- 16.2.7.5. Financials (Based on Availability)
- 16.2.8 Aethon Inc
- 16.2.8.1. Overview
- 16.2.8.2. Products
- 16.2.8.3. SWOT Analysis
- 16.2.8.4. Recent Developments
- 16.2.8.5. Financials (Based on Availability)
- 16.2.9 ClearPath Robotics
- 16.2.9.1. Overview
- 16.2.9.2. Products
- 16.2.9.3. SWOT Analysis
- 16.2.9.4. Recent Developments
- 16.2.9.5. Financials (Based on Availability)
- 16.2.10 Rethink Robotic
- 16.2.10.1. Overview
- 16.2.10.2. Products
- 16.2.10.3. SWOT Analysis
- 16.2.10.4. Recent Developments
- 16.2.10.5. Financials (Based on Availability)
- 16.2.1 Kudan Inc
List of Figures
- Figure 1: Global Simultaneous Localization and Mapping Industry Revenue Breakdown (Million, %) by Region 2024 & 2032
- Figure 2: North America Simultaneous Localization and Mapping Industry Revenue (Million), by Country 2024 & 2032
- Figure 3: North America Simultaneous Localization and Mapping Industry Revenue Share (%), by Country 2024 & 2032
- Figure 4: Europe Simultaneous Localization and Mapping Industry Revenue (Million), by Country 2024 & 2032
- Figure 5: Europe Simultaneous Localization and Mapping Industry Revenue Share (%), by Country 2024 & 2032
- Figure 6: Asia Pacific Simultaneous Localization and Mapping Industry Revenue (Million), by Country 2024 & 2032
- Figure 7: Asia Pacific Simultaneous Localization and Mapping Industry Revenue Share (%), by Country 2024 & 2032
- Figure 8: South America Simultaneous Localization and Mapping Industry Revenue (Million), by Country 2024 & 2032
- Figure 9: South America Simultaneous Localization and Mapping Industry Revenue Share (%), by Country 2024 & 2032
- Figure 10: North America Simultaneous Localization and Mapping Industry Revenue (Million), by Country 2024 & 2032
- Figure 11: North America Simultaneous Localization and Mapping Industry Revenue Share (%), by Country 2024 & 2032
- Figure 12: MEA Simultaneous Localization and Mapping Industry Revenue (Million), by Country 2024 & 2032
- Figure 13: MEA Simultaneous Localization and Mapping Industry Revenue Share (%), by Country 2024 & 2032
- Figure 14: North America Simultaneous Localization and Mapping Industry Revenue (Million), by Type 2024 & 2032
- Figure 15: North America Simultaneous Localization and Mapping Industry Revenue Share (%), by Type 2024 & 2032
- Figure 16: North America Simultaneous Localization and Mapping Industry Revenue (Million), by Offering 2024 & 2032
- Figure 17: North America Simultaneous Localization and Mapping Industry Revenue Share (%), by Offering 2024 & 2032
- Figure 18: North America Simultaneous Localization and Mapping Industry Revenue (Million), by Application 2024 & 2032
- Figure 19: North America Simultaneous Localization and Mapping Industry Revenue Share (%), by Application 2024 & 2032
- Figure 20: North America Simultaneous Localization and Mapping Industry Revenue (Million), by Country 2024 & 2032
- Figure 21: North America Simultaneous Localization and Mapping Industry Revenue Share (%), by Country 2024 & 2032
- Figure 22: Europe Simultaneous Localization and Mapping Industry Revenue (Million), by Type 2024 & 2032
- Figure 23: Europe Simultaneous Localization and Mapping Industry Revenue Share (%), by Type 2024 & 2032
- Figure 24: Europe Simultaneous Localization and Mapping Industry Revenue (Million), by Offering 2024 & 2032
- Figure 25: Europe Simultaneous Localization and Mapping Industry Revenue Share (%), by Offering 2024 & 2032
- Figure 26: Europe Simultaneous Localization and Mapping Industry Revenue (Million), by Application 2024 & 2032
- Figure 27: Europe Simultaneous Localization and Mapping Industry Revenue Share (%), by Application 2024 & 2032
- Figure 28: Europe Simultaneous Localization and Mapping Industry Revenue (Million), by Country 2024 & 2032
- Figure 29: Europe Simultaneous Localization and Mapping Industry Revenue Share (%), by Country 2024 & 2032
- Figure 30: Asia Pacific Simultaneous Localization and Mapping Industry Revenue (Million), by Type 2024 & 2032
- Figure 31: Asia Pacific Simultaneous Localization and Mapping Industry Revenue Share (%), by Type 2024 & 2032
- Figure 32: Asia Pacific Simultaneous Localization and Mapping Industry Revenue (Million), by Offering 2024 & 2032
- Figure 33: Asia Pacific Simultaneous Localization and Mapping Industry Revenue Share (%), by Offering 2024 & 2032
- Figure 34: Asia Pacific Simultaneous Localization and Mapping Industry Revenue (Million), by Application 2024 & 2032
- Figure 35: Asia Pacific Simultaneous Localization and Mapping Industry Revenue Share (%), by Application 2024 & 2032
- Figure 36: Asia Pacific Simultaneous Localization and Mapping Industry Revenue (Million), by Country 2024 & 2032
- Figure 37: Asia Pacific Simultaneous Localization and Mapping Industry Revenue Share (%), by Country 2024 & 2032
- Figure 38: Middle East and Africa Simultaneous Localization and Mapping Industry Revenue (Million), by Type 2024 & 2032
- Figure 39: Middle East and Africa Simultaneous Localization and Mapping Industry Revenue Share (%), by Type 2024 & 2032
- Figure 40: Middle East and Africa Simultaneous Localization and Mapping Industry Revenue (Million), by Offering 2024 & 2032
- Figure 41: Middle East and Africa Simultaneous Localization and Mapping Industry Revenue Share (%), by Offering 2024 & 2032
- Figure 42: Middle East and Africa Simultaneous Localization and Mapping Industry Revenue (Million), by Application 2024 & 2032
- Figure 43: Middle East and Africa Simultaneous Localization and Mapping Industry Revenue Share (%), by Application 2024 & 2032
- Figure 44: Middle East and Africa Simultaneous Localization and Mapping Industry Revenue (Million), by Country 2024 & 2032
- Figure 45: Middle East and Africa Simultaneous Localization and Mapping Industry Revenue Share (%), by Country 2024 & 2032
List of Tables
- Table 1: Global Simultaneous Localization and Mapping Industry Revenue Million Forecast, by Region 2019 & 2032
- Table 2: Global Simultaneous Localization and Mapping Industry Revenue Million Forecast, by Type 2019 & 2032
- Table 3: Global Simultaneous Localization and Mapping Industry Revenue Million Forecast, by Offering 2019 & 2032
- Table 4: Global Simultaneous Localization and Mapping Industry Revenue Million Forecast, by Application 2019 & 2032
- Table 5: Global Simultaneous Localization and Mapping Industry Revenue Million Forecast, by Region 2019 & 2032
- Table 6: Global Simultaneous Localization and Mapping Industry Revenue Million Forecast, by Country 2019 & 2032
- Table 7: United States Simultaneous Localization and Mapping Industry Revenue (Million) Forecast, by Application 2019 & 2032
- Table 8: Canada Simultaneous Localization and Mapping Industry Revenue (Million) Forecast, by Application 2019 & 2032
- Table 9: Mexico Simultaneous Localization and Mapping Industry Revenue (Million) Forecast, by Application 2019 & 2032
- Table 10: Global Simultaneous Localization and Mapping Industry Revenue Million Forecast, by Country 2019 & 2032
- Table 11: Germany Simultaneous Localization and Mapping Industry Revenue (Million) Forecast, by Application 2019 & 2032
- Table 12: United Kingdom Simultaneous Localization and Mapping Industry Revenue (Million) Forecast, by Application 2019 & 2032
- Table 13: France Simultaneous Localization and Mapping Industry Revenue (Million) Forecast, by Application 2019 & 2032
- Table 14: Spain Simultaneous Localization and Mapping Industry Revenue (Million) Forecast, by Application 2019 & 2032
- Table 15: Italy Simultaneous Localization and Mapping Industry Revenue (Million) Forecast, by Application 2019 & 2032
- Table 16: Spain Simultaneous Localization and Mapping Industry Revenue (Million) Forecast, by Application 2019 & 2032
- Table 17: Belgium Simultaneous Localization and Mapping Industry Revenue (Million) Forecast, by Application 2019 & 2032
- Table 18: Netherland Simultaneous Localization and Mapping Industry Revenue (Million) Forecast, by Application 2019 & 2032
- Table 19: Nordics Simultaneous Localization and Mapping Industry Revenue (Million) Forecast, by Application 2019 & 2032
- Table 20: Rest of Europe Simultaneous Localization and Mapping Industry Revenue (Million) Forecast, by Application 2019 & 2032
- Table 21: Global Simultaneous Localization and Mapping Industry Revenue Million Forecast, by Country 2019 & 2032
- Table 22: China Simultaneous Localization and Mapping Industry Revenue (Million) Forecast, by Application 2019 & 2032
- Table 23: Japan Simultaneous Localization and Mapping Industry Revenue (Million) Forecast, by Application 2019 & 2032
- Table 24: India Simultaneous Localization and Mapping Industry Revenue (Million) Forecast, by Application 2019 & 2032
- Table 25: South Korea Simultaneous Localization and Mapping Industry Revenue (Million) Forecast, by Application 2019 & 2032
- Table 26: Southeast Asia Simultaneous Localization and Mapping Industry Revenue (Million) Forecast, by Application 2019 & 2032
- Table 27: Australia Simultaneous Localization and Mapping Industry Revenue (Million) Forecast, by Application 2019 & 2032
- Table 28: Indonesia Simultaneous Localization and Mapping Industry Revenue (Million) Forecast, by Application 2019 & 2032
- Table 29: Phillipes Simultaneous Localization and Mapping Industry Revenue (Million) Forecast, by Application 2019 & 2032
- Table 30: Singapore Simultaneous Localization and Mapping Industry Revenue (Million) Forecast, by Application 2019 & 2032
- Table 31: Thailandc Simultaneous Localization and Mapping Industry Revenue (Million) Forecast, by Application 2019 & 2032
- Table 32: Rest of Asia Pacific Simultaneous Localization and Mapping Industry Revenue (Million) Forecast, by Application 2019 & 2032
- Table 33: Global Simultaneous Localization and Mapping Industry Revenue Million Forecast, by Country 2019 & 2032
- Table 34: Brazil Simultaneous Localization and Mapping Industry Revenue (Million) Forecast, by Application 2019 & 2032
- Table 35: Argentina Simultaneous Localization and Mapping Industry Revenue (Million) Forecast, by Application 2019 & 2032
- Table 36: Peru Simultaneous Localization and Mapping Industry Revenue (Million) Forecast, by Application 2019 & 2032
- Table 37: Chile Simultaneous Localization and Mapping Industry Revenue (Million) Forecast, by Application 2019 & 2032
- Table 38: Colombia Simultaneous Localization and Mapping Industry Revenue (Million) Forecast, by Application 2019 & 2032
- Table 39: Ecuador Simultaneous Localization and Mapping Industry Revenue (Million) Forecast, by Application 2019 & 2032
- Table 40: Venezuela Simultaneous Localization and Mapping Industry Revenue (Million) Forecast, by Application 2019 & 2032
- Table 41: Rest of South America Simultaneous Localization and Mapping Industry Revenue (Million) Forecast, by Application 2019 & 2032
- Table 42: Global Simultaneous Localization and Mapping Industry Revenue Million Forecast, by Country 2019 & 2032
- Table 43: United States Simultaneous Localization and Mapping Industry Revenue (Million) Forecast, by Application 2019 & 2032
- Table 44: Canada Simultaneous Localization and Mapping Industry Revenue (Million) Forecast, by Application 2019 & 2032
- Table 45: Mexico Simultaneous Localization and Mapping Industry Revenue (Million) Forecast, by Application 2019 & 2032
- Table 46: Global Simultaneous Localization and Mapping Industry Revenue Million Forecast, by Country 2019 & 2032
- Table 47: United Arab Emirates Simultaneous Localization and Mapping Industry Revenue (Million) Forecast, by Application 2019 & 2032
- Table 48: Saudi Arabia Simultaneous Localization and Mapping Industry Revenue (Million) Forecast, by Application 2019 & 2032
- Table 49: South Africa Simultaneous Localization and Mapping Industry Revenue (Million) Forecast, by Application 2019 & 2032
- Table 50: Rest of Middle East and Africa Simultaneous Localization and Mapping Industry Revenue (Million) Forecast, by Application 2019 & 2032
- Table 51: Global Simultaneous Localization and Mapping Industry Revenue Million Forecast, by Type 2019 & 2032
- Table 52: Global Simultaneous Localization and Mapping Industry Revenue Million Forecast, by Offering 2019 & 2032
- Table 53: Global Simultaneous Localization and Mapping Industry Revenue Million Forecast, by Application 2019 & 2032
- Table 54: Global Simultaneous Localization and Mapping Industry Revenue Million Forecast, by Country 2019 & 2032
- Table 55: United States Simultaneous Localization and Mapping Industry Revenue (Million) Forecast, by Application 2019 & 2032
- Table 56: Canada Simultaneous Localization and Mapping Industry Revenue (Million) Forecast, by Application 2019 & 2032
- Table 57: Global Simultaneous Localization and Mapping Industry Revenue Million Forecast, by Type 2019 & 2032
- Table 58: Global Simultaneous Localization and Mapping Industry Revenue Million Forecast, by Offering 2019 & 2032
- Table 59: Global Simultaneous Localization and Mapping Industry Revenue Million Forecast, by Application 2019 & 2032
- Table 60: Global Simultaneous Localization and Mapping Industry Revenue Million Forecast, by Country 2019 & 2032
- Table 61: Germany Simultaneous Localization and Mapping Industry Revenue (Million) Forecast, by Application 2019 & 2032
- Table 62: United Kingdoms Simultaneous Localization and Mapping Industry Revenue (Million) Forecast, by Application 2019 & 2032
- Table 63: France Simultaneous Localization and Mapping Industry Revenue (Million) Forecast, by Application 2019 & 2032
- Table 64: Rest of the Europe Simultaneous Localization and Mapping Industry Revenue (Million) Forecast, by Application 2019 & 2032
- Table 65: Global Simultaneous Localization and Mapping Industry Revenue Million Forecast, by Type 2019 & 2032
- Table 66: Global Simultaneous Localization and Mapping Industry Revenue Million Forecast, by Offering 2019 & 2032
- Table 67: Global Simultaneous Localization and Mapping Industry Revenue Million Forecast, by Application 2019 & 2032
- Table 68: Global Simultaneous Localization and Mapping Industry Revenue Million Forecast, by Country 2019 & 2032
- Table 69: China Simultaneous Localization and Mapping Industry Revenue (Million) Forecast, by Application 2019 & 2032
- Table 70: India Simultaneous Localization and Mapping Industry Revenue (Million) Forecast, by Application 2019 & 2032
- Table 71: Japan Simultaneous Localization and Mapping Industry Revenue (Million) Forecast, by Application 2019 & 2032
- Table 72: Rest of Asia Pacific Simultaneous Localization and Mapping Industry Revenue (Million) Forecast, by Application 2019 & 2032
- Table 73: Global Simultaneous Localization and Mapping Industry Revenue Million Forecast, by Type 2019 & 2032
- Table 74: Global Simultaneous Localization and Mapping Industry Revenue Million Forecast, by Offering 2019 & 2032
- Table 75: Global Simultaneous Localization and Mapping Industry Revenue Million Forecast, by Application 2019 & 2032
- Table 76: Global Simultaneous Localization and Mapping Industry Revenue Million Forecast, by Country 2019 & 2032
Frequently Asked Questions
1. What is the projected Compound Annual Growth Rate (CAGR) of the Simultaneous Localization and Mapping Industry?
The projected CAGR is approximately 26.78%.
2. Which companies are prominent players in the Simultaneous Localization and Mapping Industry?
Key companies in the market include Kudan Inc, Amazon Robotics, Google LLC, Hi-tech Robotic Systemz Ltd, Microsoft Inc, MAXST Developers, Apple Inc, Aethon Inc, ClearPath Robotics, Rethink Robotic.
3. What are the main segments of the Simultaneous Localization and Mapping Industry?
The market segments include Type, Offering, Application.
4. Can you provide details about the market size?
The market size is estimated to be USD XX Million as of 2022.
5. What are some drivers contributing to market growth?
Growing Penetration of Mapping Technologies in Domestic Robots and UAV; Advancements in Visual SLAM Algorithm; Increasing Application of SLAM in Augmented Reality.
6. What are the notable trends driving market growth?
UAVs and Robots Will Experience Significant Growth in the Market.
7. Are there any restraints impacting market growth?
; The Risk of Interference from Other Wireless Device.
8. Can you provide examples of recent developments in the market?
November 2022 - Singapore based autonomous navigation solutions provider dConstruct introduced Ouster digital lidar to create highly accurate SLAMs and point cloud maps. Dconstruct creates these maps virtually and then studies the deployment of autonomous robots and the inspection and reconstruction of working environments. For instance - A map of a smart office building, The Galen, in Singapore was created on the cloud and was used to facilitate the deployment of autonomous robots ranging from cleaning robots to last-mile delivery robots.
9. What pricing options are available for accessing the report?
Pricing options include single-user, multi-user, and enterprise licenses priced at USD 4750, USD 5250, and USD 8750 respectively.
10. Is the market size provided in terms of value or volume?
The market size is provided in terms of value, measured in Million.
11. Are there any specific market keywords associated with the report?
Yes, the market keyword associated with the report is "Simultaneous Localization and Mapping Industry," which aids in identifying and referencing the specific market segment covered.
12. How do I determine which pricing option suits my needs best?
The pricing options vary based on user requirements and access needs. Individual users may opt for single-user licenses, while businesses requiring broader access may choose multi-user or enterprise licenses for cost-effective access to the report.
13. Are there any additional resources or data provided in the Simultaneous Localization and Mapping Industry report?
While the report offers comprehensive insights, it's advisable to review the specific contents or supplementary materials provided to ascertain if additional resources or data are available.
14. How can I stay updated on further developments or reports in the Simultaneous Localization and Mapping Industry?
To stay informed about further developments, trends, and reports in the Simultaneous Localization and Mapping Industry, consider subscribing to industry newsletters, following relevant companies and organizations, or regularly checking reputable industry news sources and publications.
Methodology
Step 1 - Identification of Relevant Samples Size from Population Database


Step 2 - Approaches for Defining Global Market Size (Value, Volume* & Price*)

Note*: In applicable scenarios
Step 3 - Data Sources
Primary Research
- Web Analytics
- Survey Reports
- Research Institute
- Latest Research Reports
- Opinion Leaders
Secondary Research
- Annual Reports
- White Paper
- Latest Press Release
- Industry Association
- Paid Database
- Investor Presentations

Step 4 - Data Triangulation
Involves using different sources of information in order to increase the validity of a study
These sources are likely to be stakeholders in a program - participants, other researchers, program staff, other community members, and so on.
Then we put all data in single framework & apply various statistical tools to find out the dynamic on the market.
During the analysis stage, feedback from the stakeholder groups would be compared to determine areas of agreement as well as areas of divergence
