

Key Insights
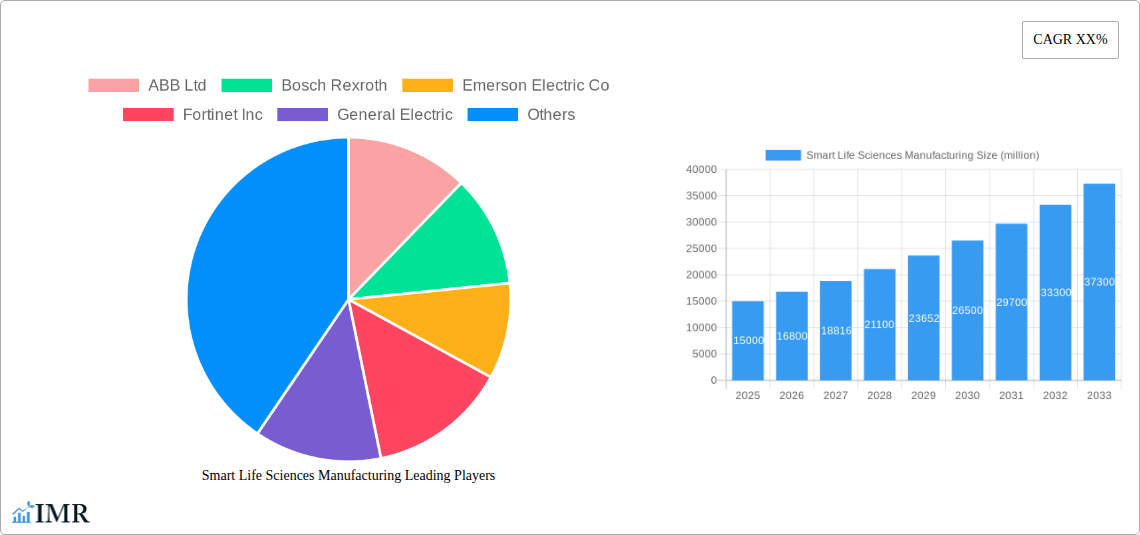
The smart life sciences manufacturing market is experiencing robust growth, driven by increasing demand for advanced therapies, personalized medicine, and the need for enhanced efficiency and data-driven decision-making within pharmaceutical and biotechnology companies. The market's expansion is fueled by the adoption of Industry 4.0 technologies like AI, machine learning, IoT, and robotics across various manufacturing processes, leading to improved product quality, reduced production costs, and accelerated time-to-market. Key players such as ABB, Bosch Rexroth, and Siemens are investing heavily in developing innovative solutions for process automation, data analytics, and predictive maintenance within life sciences manufacturing facilities. Furthermore, stringent regulatory requirements and the rising focus on supply chain resilience are further propelling market growth. We estimate the market size in 2025 to be around $15 billion, with a compound annual growth rate (CAGR) of 12% from 2025-2033, projecting a market value exceeding $40 billion by 2033. This growth, however, is tempered by factors such as high initial investment costs associated with implementing smart manufacturing technologies and the need for skilled workforce to manage and maintain these complex systems. The integration of legacy systems with new technologies also presents a significant challenge for many companies.
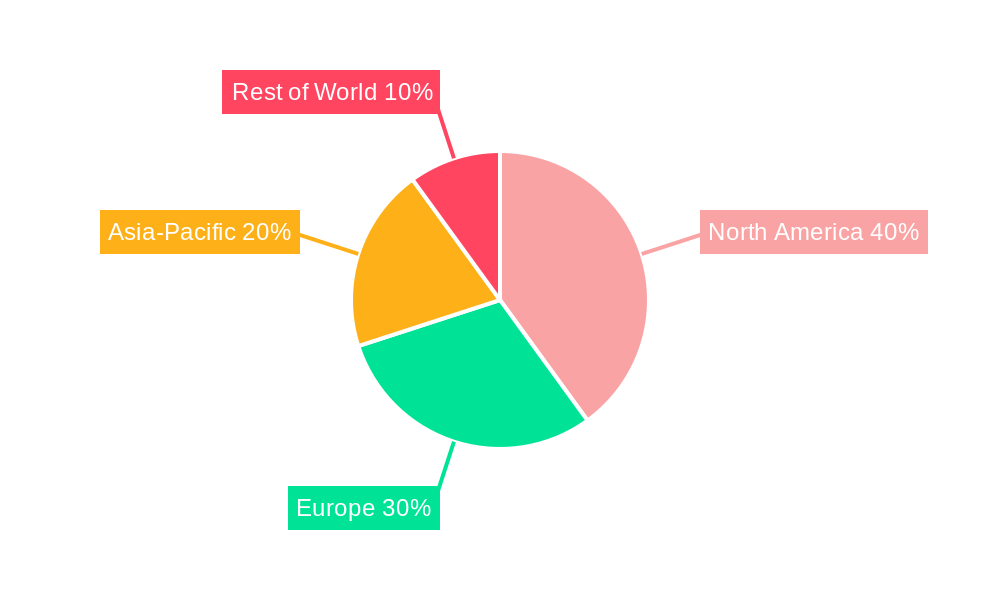
The market is segmented by technology (e.g., automation, analytics, cloud computing), application (e.g., drug manufacturing, medical device production), and geography. North America currently holds a significant market share, driven by early adoption of advanced technologies and a strong regulatory framework supporting innovation. However, Asia-Pacific is anticipated to experience the fastest growth rate in the coming years, fueled by increasing investments in life sciences infrastructure and a growing focus on improving manufacturing capabilities within the region. The competitive landscape is characterized by a mix of established automation providers and specialized life sciences IT companies, creating a dynamic environment with opportunities for collaboration and consolidation. Continued innovation in areas such as real-time data analysis, predictive modelling and advanced process control will be critical for companies to remain competitive in this evolving market.
This comprehensive report provides an in-depth analysis of the Smart Life Sciences Manufacturing market, encompassing market dynamics, growth trends, regional analysis, product landscape, key players, and future outlook. The study period covers 2019-2033, with 2025 as the base year and estimated year, and a forecast period of 2025-2033. The report leverages extensive primary and secondary research to deliver actionable insights for industry professionals, investors, and stakeholders. This report focuses on parent market: Life Sciences Manufacturing and child market: Smart Manufacturing Technologies in Life Sciences.
Smart Life Sciences Manufacturing Market Dynamics & Structure
This section analyzes the market's competitive landscape, technological advancements, regulatory environment, and market consolidation trends within the smart life sciences manufacturing sector. The analysis covers the period from 2019 to 2024, projecting trends through 2033.
Market Concentration: The market is moderately concentrated, with key players like ABB Ltd, Bosch Rexroth, Emerson Electric Co, and General Electric holding significant market share (estimated at xx% collectively in 2025). Smaller players contribute to a fragmented landscape.
Technological Innovation: Advancements in AI, IoT, cloud computing, and automation are driving market growth, creating opportunities for specialized solutions. However, integration complexity and data security concerns represent significant innovation barriers.
Regulatory Frameworks: Stringent regulatory compliance (e.g., FDA, EMA) necessitates robust quality control and data management systems, impacting investment decisions and market access.
Competitive Product Substitutes: Traditional manufacturing processes pose a competitive threat, but the superior efficiency and quality offered by smart manufacturing solutions are steadily increasing adoption.
End-User Demographics: Pharmaceutical and biotech companies are the primary end-users, with increasing adoption among contract manufacturing organizations (CMOs) and medical device manufacturers.
M&A Trends: The market has witnessed xx M&A deals in the historical period (2019-2024), primarily focused on technology integration and market expansion. We predict xx deals annually in the forecast period (2025-2033).
Smart Life Sciences Manufacturing Growth Trends & Insights
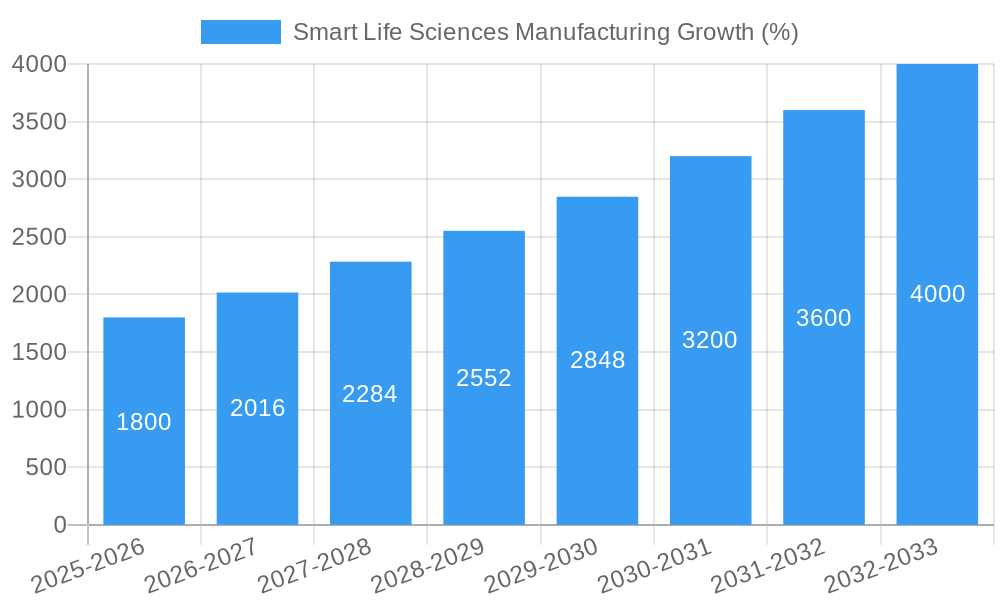
The smart life sciences manufacturing market exhibits substantial growth potential, driven by increasing demand for advanced manufacturing solutions, enhanced productivity, and improved product quality. The market size is estimated at $xx million in 2025 and is projected to reach $xx million by 2033, exhibiting a CAGR of xx% during the forecast period.
This growth is fuelled by rising adoption rates of smart manufacturing technologies like predictive maintenance, real-time monitoring, and automated quality control. Technological disruptions, such as the increasing use of artificial intelligence (AI) and machine learning (ML) in process optimization and predictive analytics are accelerating market expansion. Consumer behaviour, including increasing demand for personalized medicine and advanced therapies, indirectly drives the demand for advanced manufacturing capabilities. Market penetration for smart technologies in life sciences is currently at xx% and is expected to reach xx% by 2033.
Dominant Regions, Countries, or Segments in Smart Life Sciences Manufacturing
North America currently dominates the smart life sciences manufacturing market, holding a market share of xx% in 2025, driven by robust investments in research and development, presence of major pharmaceutical and biotech companies, and favorable regulatory environments. Europe is a close second, with a xx% market share, and Asia-Pacific is experiencing rapid growth, projected to reach a market share of xx% by 2033.
Key Drivers for North America: Strong R&D investments, stringent quality standards, and early adoption of smart manufacturing technologies.
Key Drivers for Europe: Established pharmaceutical industry, presence of advanced technology providers, and government support for digitalization initiatives.
Key Drivers for Asia-Pacific: Growing pharmaceutical market, increasing government initiatives promoting manufacturing advancements, and favorable cost structures.
Smart Life Sciences Manufacturing Product Landscape
The smart life sciences manufacturing product landscape encompasses a range of solutions, including advanced automation systems, MES (Manufacturing Execution Systems), SCADA (Supervisory Control and Data Acquisition) systems, and cloud-based data analytics platforms. These systems offer unique selling propositions such as real-time process visibility, enhanced quality control, reduced downtime, and optimized resource allocation. Technological advancements focus on AI-powered predictive maintenance, automated quality inspections, and blockchain-enabled supply chain transparency.
Key Drivers, Barriers & Challenges in Smart Life Sciences Manufacturing
Key Drivers: Increasing demand for personalized medicine, stringent regulatory compliance requirements necessitating robust quality control, and the need for improved operational efficiency are key drivers. Government initiatives promoting digitalization in manufacturing and increased investments in R&D further accelerate market growth.
Key Challenges: High upfront investment costs, complexity of technology integration, data security concerns, and the need for skilled workforce represent significant barriers to market penetration. Supply chain disruptions, coupled with regulatory compliance burdens, impact growth projections. For example, the xx% increase in raw material prices in 2022 directly impacted production costs.
Emerging Opportunities in Smart Life Sciences Manufacturing
Emerging opportunities include the adoption of advanced analytics for process optimization, development of AI-powered solutions for drug discovery, and the application of blockchain technology for supply chain transparency and traceability. Untapped markets in emerging economies and the development of innovative applications in personalized medicine and gene therapy present significant growth potential.
Growth Accelerators in the Smart Life Sciences Manufacturing Industry
Technological breakthroughs in AI, machine learning, and robotics are accelerating market growth. Strategic partnerships between technology providers and life sciences companies foster innovation and market expansion. The increasing focus on digital transformation across the industry further accelerates adoption of smart manufacturing solutions.
Key Players Shaping the Smart Life Sciences Manufacturing Market
- ABB Ltd
- Bosch Rexroth
- Emerson Electric Co
- Fortinet Inc
- General Electric
- Honeywell International Inc
- IBM Corporation
- Rockwell Automation
- Siemens AG
- Sophos Group Limited
- Zenith Technologies
- Akka Technologies
- SAP
- LTIMindtree
- Cognizant
- Grantek
Notable Milestones in Smart Life Sciences Manufacturing Sector
- 2020: Increased adoption of cloud-based manufacturing execution systems (MES) due to the need for remote monitoring and collaboration.
- 2021: Several major pharmaceutical companies announced significant investments in AI-powered process optimization initiatives.
- 2022: Rise in mergers and acquisitions activity among smart manufacturing technology providers.
- 2023: Launch of several new automation solutions specifically designed for the life sciences industry.
In-Depth Smart Life Sciences Manufacturing Market Outlook
The smart life sciences manufacturing market is poised for significant growth in the coming years, driven by continuous technological advancements, increasing demand for efficient and compliant manufacturing processes, and the growing adoption of advanced analytics and AI. Strategic partnerships and investments in digital transformation will further accelerate market expansion, opening doors to new opportunities in personalized medicine, gene therapy, and other emerging therapeutic areas.
Smart Life Sciences Manufacturing Segmentation
-
1. Application
- 1.1. Pharmaceutics
- 1.2. Medical Devices
- 1.3. Research Institutions
- 1.4. Others
-
2. Types
- 2.1. Hardware
- 2.2. Software
- 2.3. Services
- 2.4. Solutions
- 2.5. Other
Smart Life Sciences Manufacturing Segmentation By Geography
-
1. North America
- 1.1. United States
- 1.2. Canada
- 1.3. Mexico
-
2. South America
- 2.1. Brazil
- 2.2. Argentina
- 2.3. Rest of South America
-
3. Europe
- 3.1. United Kingdom
- 3.2. Germany
- 3.3. France
- 3.4. Italy
- 3.5. Spain
- 3.6. Russia
- 3.7. Benelux
- 3.8. Nordics
- 3.9. Rest of Europe
-
4. Middle East & Africa
- 4.1. Turkey
- 4.2. Israel
- 4.3. GCC
- 4.4. North Africa
- 4.5. South Africa
- 4.6. Rest of Middle East & Africa
-
5. Asia Pacific
- 5.1. China
- 5.2. India
- 5.3. Japan
- 5.4. South Korea
- 5.5. ASEAN
- 5.6. Oceania
- 5.7. Rest of Asia Pacific
Smart Life Sciences Manufacturing REPORT HIGHLIGHTS
| Aspects | Details |
|---|---|
| Study Period | 2019-2033 |
| Base Year | 2024 |
| Estimated Year | 2025 |
| Forecast Period | 2025-2033 |
| Historical Period | 2019-2024 |
| Growth Rate | CAGR of XX% from 2019-2033 |
| Segmentation |
|
Table of Contents
- 1. Introduction
- 1.1. Research Scope
- 1.2. Market Segmentation
- 1.3. Research Methodology
- 1.4. Definitions and Assumptions
- 2. Executive Summary
- 2.1. Introduction
- 3. Market Dynamics
- 3.1. Introduction
- 3.2. Market Drivers
- 3.3. Market Restrains
- 3.4. Market Trends
- 4. Market Factor Analysis
- 4.1. Porters Five Forces
- 4.2. Supply/Value Chain
- 4.3. PESTEL analysis
- 4.4. Market Entropy
- 4.5. Patent/Trademark Analysis
- 5. Global Smart Life Sciences Manufacturing Analysis, Insights and Forecast, 2019-2031
- 5.1. Market Analysis, Insights and Forecast - by Application
- 5.1.1. Pharmaceutics
- 5.1.2. Medical Devices
- 5.1.3. Research Institutions
- 5.1.4. Others
- 5.2. Market Analysis, Insights and Forecast - by Types
- 5.2.1. Hardware
- 5.2.2. Software
- 5.2.3. Services
- 5.2.4. Solutions
- 5.2.5. Other
- 5.3. Market Analysis, Insights and Forecast - by Region
- 5.3.1. North America
- 5.3.2. South America
- 5.3.3. Europe
- 5.3.4. Middle East & Africa
- 5.3.5. Asia Pacific
- 5.1. Market Analysis, Insights and Forecast - by Application
- 6. North America Smart Life Sciences Manufacturing Analysis, Insights and Forecast, 2019-2031
- 6.1. Market Analysis, Insights and Forecast - by Application
- 6.1.1. Pharmaceutics
- 6.1.2. Medical Devices
- 6.1.3. Research Institutions
- 6.1.4. Others
- 6.2. Market Analysis, Insights and Forecast - by Types
- 6.2.1. Hardware
- 6.2.2. Software
- 6.2.3. Services
- 6.2.4. Solutions
- 6.2.5. Other
- 6.1. Market Analysis, Insights and Forecast - by Application
- 7. South America Smart Life Sciences Manufacturing Analysis, Insights and Forecast, 2019-2031
- 7.1. Market Analysis, Insights and Forecast - by Application
- 7.1.1. Pharmaceutics
- 7.1.2. Medical Devices
- 7.1.3. Research Institutions
- 7.1.4. Others
- 7.2. Market Analysis, Insights and Forecast - by Types
- 7.2.1. Hardware
- 7.2.2. Software
- 7.2.3. Services
- 7.2.4. Solutions
- 7.2.5. Other
- 7.1. Market Analysis, Insights and Forecast - by Application
- 8. Europe Smart Life Sciences Manufacturing Analysis, Insights and Forecast, 2019-2031
- 8.1. Market Analysis, Insights and Forecast - by Application
- 8.1.1. Pharmaceutics
- 8.1.2. Medical Devices
- 8.1.3. Research Institutions
- 8.1.4. Others
- 8.2. Market Analysis, Insights and Forecast - by Types
- 8.2.1. Hardware
- 8.2.2. Software
- 8.2.3. Services
- 8.2.4. Solutions
- 8.2.5. Other
- 8.1. Market Analysis, Insights and Forecast - by Application
- 9. Middle East & Africa Smart Life Sciences Manufacturing Analysis, Insights and Forecast, 2019-2031
- 9.1. Market Analysis, Insights and Forecast - by Application
- 9.1.1. Pharmaceutics
- 9.1.2. Medical Devices
- 9.1.3. Research Institutions
- 9.1.4. Others
- 9.2. Market Analysis, Insights and Forecast - by Types
- 9.2.1. Hardware
- 9.2.2. Software
- 9.2.3. Services
- 9.2.4. Solutions
- 9.2.5. Other
- 9.1. Market Analysis, Insights and Forecast - by Application
- 10. Asia Pacific Smart Life Sciences Manufacturing Analysis, Insights and Forecast, 2019-2031
- 10.1. Market Analysis, Insights and Forecast - by Application
- 10.1.1. Pharmaceutics
- 10.1.2. Medical Devices
- 10.1.3. Research Institutions
- 10.1.4. Others
- 10.2. Market Analysis, Insights and Forecast - by Types
- 10.2.1. Hardware
- 10.2.2. Software
- 10.2.3. Services
- 10.2.4. Solutions
- 10.2.5. Other
- 10.1. Market Analysis, Insights and Forecast - by Application
- 11. Competitive Analysis
- 11.1. Global Market Share Analysis 2024
- 11.2. Company Profiles
- 11.2.1 ABB Ltd
- 11.2.1.1. Overview
- 11.2.1.2. Products
- 11.2.1.3. SWOT Analysis
- 11.2.1.4. Recent Developments
- 11.2.1.5. Financials (Based on Availability)
- 11.2.2 Bosch Rexroth
- 11.2.2.1. Overview
- 11.2.2.2. Products
- 11.2.2.3. SWOT Analysis
- 11.2.2.4. Recent Developments
- 11.2.2.5. Financials (Based on Availability)
- 11.2.3 Emerson Electric Co
- 11.2.3.1. Overview
- 11.2.3.2. Products
- 11.2.3.3. SWOT Analysis
- 11.2.3.4. Recent Developments
- 11.2.3.5. Financials (Based on Availability)
- 11.2.4 Fortinet Inc
- 11.2.4.1. Overview
- 11.2.4.2. Products
- 11.2.4.3. SWOT Analysis
- 11.2.4.4. Recent Developments
- 11.2.4.5. Financials (Based on Availability)
- 11.2.5 General Electric
- 11.2.5.1. Overview
- 11.2.5.2. Products
- 11.2.5.3. SWOT Analysis
- 11.2.5.4. Recent Developments
- 11.2.5.5. Financials (Based on Availability)
- 11.2.6 Honeywell International Inc
- 11.2.6.1. Overview
- 11.2.6.2. Products
- 11.2.6.3. SWOT Analysis
- 11.2.6.4. Recent Developments
- 11.2.6.5. Financials (Based on Availability)
- 11.2.7 IBM Corporation
- 11.2.7.1. Overview
- 11.2.7.2. Products
- 11.2.7.3. SWOT Analysis
- 11.2.7.4. Recent Developments
- 11.2.7.5. Financials (Based on Availability)
- 11.2.8 Rockwell Automation
- 11.2.8.1. Overview
- 11.2.8.2. Products
- 11.2.8.3. SWOT Analysis
- 11.2.8.4. Recent Developments
- 11.2.8.5. Financials (Based on Availability)
- 11.2.9 Siemens AG
- 11.2.9.1. Overview
- 11.2.9.2. Products
- 11.2.9.3. SWOT Analysis
- 11.2.9.4. Recent Developments
- 11.2.9.5. Financials (Based on Availability)
- 11.2.10 Sophos Group Limited
- 11.2.10.1. Overview
- 11.2.10.2. Products
- 11.2.10.3. SWOT Analysis
- 11.2.10.4. Recent Developments
- 11.2.10.5. Financials (Based on Availability)
- 11.2.11 Zenith Technologies
- 11.2.11.1. Overview
- 11.2.11.2. Products
- 11.2.11.3. SWOT Analysis
- 11.2.11.4. Recent Developments
- 11.2.11.5. Financials (Based on Availability)
- 11.2.12 Akka Technologies
- 11.2.12.1. Overview
- 11.2.12.2. Products
- 11.2.12.3. SWOT Analysis
- 11.2.12.4. Recent Developments
- 11.2.12.5. Financials (Based on Availability)
- 11.2.13 SAP
- 11.2.13.1. Overview
- 11.2.13.2. Products
- 11.2.13.3. SWOT Analysis
- 11.2.13.4. Recent Developments
- 11.2.13.5. Financials (Based on Availability)
- 11.2.14 LTIMindtree
- 11.2.14.1. Overview
- 11.2.14.2. Products
- 11.2.14.3. SWOT Analysis
- 11.2.14.4. Recent Developments
- 11.2.14.5. Financials (Based on Availability)
- 11.2.15 Cognizant
- 11.2.15.1. Overview
- 11.2.15.2. Products
- 11.2.15.3. SWOT Analysis
- 11.2.15.4. Recent Developments
- 11.2.15.5. Financials (Based on Availability)
- 11.2.16 Grantek
- 11.2.16.1. Overview
- 11.2.16.2. Products
- 11.2.16.3. SWOT Analysis
- 11.2.16.4. Recent Developments
- 11.2.16.5. Financials (Based on Availability)
- 11.2.1 ABB Ltd
List of Figures
- Figure 1: Global Smart Life Sciences Manufacturing Revenue Breakdown (million, %) by Region 2024 & 2032
- Figure 2: North America Smart Life Sciences Manufacturing Revenue (million), by Application 2024 & 2032
- Figure 3: North America Smart Life Sciences Manufacturing Revenue Share (%), by Application 2024 & 2032
- Figure 4: North America Smart Life Sciences Manufacturing Revenue (million), by Types 2024 & 2032
- Figure 5: North America Smart Life Sciences Manufacturing Revenue Share (%), by Types 2024 & 2032
- Figure 6: North America Smart Life Sciences Manufacturing Revenue (million), by Country 2024 & 2032
- Figure 7: North America Smart Life Sciences Manufacturing Revenue Share (%), by Country 2024 & 2032
- Figure 8: South America Smart Life Sciences Manufacturing Revenue (million), by Application 2024 & 2032
- Figure 9: South America Smart Life Sciences Manufacturing Revenue Share (%), by Application 2024 & 2032
- Figure 10: South America Smart Life Sciences Manufacturing Revenue (million), by Types 2024 & 2032
- Figure 11: South America Smart Life Sciences Manufacturing Revenue Share (%), by Types 2024 & 2032
- Figure 12: South America Smart Life Sciences Manufacturing Revenue (million), by Country 2024 & 2032
- Figure 13: South America Smart Life Sciences Manufacturing Revenue Share (%), by Country 2024 & 2032
- Figure 14: Europe Smart Life Sciences Manufacturing Revenue (million), by Application 2024 & 2032
- Figure 15: Europe Smart Life Sciences Manufacturing Revenue Share (%), by Application 2024 & 2032
- Figure 16: Europe Smart Life Sciences Manufacturing Revenue (million), by Types 2024 & 2032
- Figure 17: Europe Smart Life Sciences Manufacturing Revenue Share (%), by Types 2024 & 2032
- Figure 18: Europe Smart Life Sciences Manufacturing Revenue (million), by Country 2024 & 2032
- Figure 19: Europe Smart Life Sciences Manufacturing Revenue Share (%), by Country 2024 & 2032
- Figure 20: Middle East & Africa Smart Life Sciences Manufacturing Revenue (million), by Application 2024 & 2032
- Figure 21: Middle East & Africa Smart Life Sciences Manufacturing Revenue Share (%), by Application 2024 & 2032
- Figure 22: Middle East & Africa Smart Life Sciences Manufacturing Revenue (million), by Types 2024 & 2032
- Figure 23: Middle East & Africa Smart Life Sciences Manufacturing Revenue Share (%), by Types 2024 & 2032
- Figure 24: Middle East & Africa Smart Life Sciences Manufacturing Revenue (million), by Country 2024 & 2032
- Figure 25: Middle East & Africa Smart Life Sciences Manufacturing Revenue Share (%), by Country 2024 & 2032
- Figure 26: Asia Pacific Smart Life Sciences Manufacturing Revenue (million), by Application 2024 & 2032
- Figure 27: Asia Pacific Smart Life Sciences Manufacturing Revenue Share (%), by Application 2024 & 2032
- Figure 28: Asia Pacific Smart Life Sciences Manufacturing Revenue (million), by Types 2024 & 2032
- Figure 29: Asia Pacific Smart Life Sciences Manufacturing Revenue Share (%), by Types 2024 & 2032
- Figure 30: Asia Pacific Smart Life Sciences Manufacturing Revenue (million), by Country 2024 & 2032
- Figure 31: Asia Pacific Smart Life Sciences Manufacturing Revenue Share (%), by Country 2024 & 2032
List of Tables
- Table 1: Global Smart Life Sciences Manufacturing Revenue million Forecast, by Region 2019 & 2032
- Table 2: Global Smart Life Sciences Manufacturing Revenue million Forecast, by Application 2019 & 2032
- Table 3: Global Smart Life Sciences Manufacturing Revenue million Forecast, by Types 2019 & 2032
- Table 4: Global Smart Life Sciences Manufacturing Revenue million Forecast, by Region 2019 & 2032
- Table 5: Global Smart Life Sciences Manufacturing Revenue million Forecast, by Application 2019 & 2032
- Table 6: Global Smart Life Sciences Manufacturing Revenue million Forecast, by Types 2019 & 2032
- Table 7: Global Smart Life Sciences Manufacturing Revenue million Forecast, by Country 2019 & 2032
- Table 8: United States Smart Life Sciences Manufacturing Revenue (million) Forecast, by Application 2019 & 2032
- Table 9: Canada Smart Life Sciences Manufacturing Revenue (million) Forecast, by Application 2019 & 2032
- Table 10: Mexico Smart Life Sciences Manufacturing Revenue (million) Forecast, by Application 2019 & 2032
- Table 11: Global Smart Life Sciences Manufacturing Revenue million Forecast, by Application 2019 & 2032
- Table 12: Global Smart Life Sciences Manufacturing Revenue million Forecast, by Types 2019 & 2032
- Table 13: Global Smart Life Sciences Manufacturing Revenue million Forecast, by Country 2019 & 2032
- Table 14: Brazil Smart Life Sciences Manufacturing Revenue (million) Forecast, by Application 2019 & 2032
- Table 15: Argentina Smart Life Sciences Manufacturing Revenue (million) Forecast, by Application 2019 & 2032
- Table 16: Rest of South America Smart Life Sciences Manufacturing Revenue (million) Forecast, by Application 2019 & 2032
- Table 17: Global Smart Life Sciences Manufacturing Revenue million Forecast, by Application 2019 & 2032
- Table 18: Global Smart Life Sciences Manufacturing Revenue million Forecast, by Types 2019 & 2032
- Table 19: Global Smart Life Sciences Manufacturing Revenue million Forecast, by Country 2019 & 2032
- Table 20: United Kingdom Smart Life Sciences Manufacturing Revenue (million) Forecast, by Application 2019 & 2032
- Table 21: Germany Smart Life Sciences Manufacturing Revenue (million) Forecast, by Application 2019 & 2032
- Table 22: France Smart Life Sciences Manufacturing Revenue (million) Forecast, by Application 2019 & 2032
- Table 23: Italy Smart Life Sciences Manufacturing Revenue (million) Forecast, by Application 2019 & 2032
- Table 24: Spain Smart Life Sciences Manufacturing Revenue (million) Forecast, by Application 2019 & 2032
- Table 25: Russia Smart Life Sciences Manufacturing Revenue (million) Forecast, by Application 2019 & 2032
- Table 26: Benelux Smart Life Sciences Manufacturing Revenue (million) Forecast, by Application 2019 & 2032
- Table 27: Nordics Smart Life Sciences Manufacturing Revenue (million) Forecast, by Application 2019 & 2032
- Table 28: Rest of Europe Smart Life Sciences Manufacturing Revenue (million) Forecast, by Application 2019 & 2032
- Table 29: Global Smart Life Sciences Manufacturing Revenue million Forecast, by Application 2019 & 2032
- Table 30: Global Smart Life Sciences Manufacturing Revenue million Forecast, by Types 2019 & 2032
- Table 31: Global Smart Life Sciences Manufacturing Revenue million Forecast, by Country 2019 & 2032
- Table 32: Turkey Smart Life Sciences Manufacturing Revenue (million) Forecast, by Application 2019 & 2032
- Table 33: Israel Smart Life Sciences Manufacturing Revenue (million) Forecast, by Application 2019 & 2032
- Table 34: GCC Smart Life Sciences Manufacturing Revenue (million) Forecast, by Application 2019 & 2032
- Table 35: North Africa Smart Life Sciences Manufacturing Revenue (million) Forecast, by Application 2019 & 2032
- Table 36: South Africa Smart Life Sciences Manufacturing Revenue (million) Forecast, by Application 2019 & 2032
- Table 37: Rest of Middle East & Africa Smart Life Sciences Manufacturing Revenue (million) Forecast, by Application 2019 & 2032
- Table 38: Global Smart Life Sciences Manufacturing Revenue million Forecast, by Application 2019 & 2032
- Table 39: Global Smart Life Sciences Manufacturing Revenue million Forecast, by Types 2019 & 2032
- Table 40: Global Smart Life Sciences Manufacturing Revenue million Forecast, by Country 2019 & 2032
- Table 41: China Smart Life Sciences Manufacturing Revenue (million) Forecast, by Application 2019 & 2032
- Table 42: India Smart Life Sciences Manufacturing Revenue (million) Forecast, by Application 2019 & 2032
- Table 43: Japan Smart Life Sciences Manufacturing Revenue (million) Forecast, by Application 2019 & 2032
- Table 44: South Korea Smart Life Sciences Manufacturing Revenue (million) Forecast, by Application 2019 & 2032
- Table 45: ASEAN Smart Life Sciences Manufacturing Revenue (million) Forecast, by Application 2019 & 2032
- Table 46: Oceania Smart Life Sciences Manufacturing Revenue (million) Forecast, by Application 2019 & 2032
- Table 47: Rest of Asia Pacific Smart Life Sciences Manufacturing Revenue (million) Forecast, by Application 2019 & 2032
Frequently Asked Questions
1. What is the projected Compound Annual Growth Rate (CAGR) of the Smart Life Sciences Manufacturing?
The projected CAGR is approximately XX%.
2. Which companies are prominent players in the Smart Life Sciences Manufacturing?
Key companies in the market include ABB Ltd, Bosch Rexroth, Emerson Electric Co, Fortinet Inc, General Electric, Honeywell International Inc, IBM Corporation, Rockwell Automation, Siemens AG, Sophos Group Limited, Zenith Technologies, Akka Technologies, SAP, LTIMindtree, Cognizant, Grantek.
3. What are the main segments of the Smart Life Sciences Manufacturing?
The market segments include Application, Types.
4. Can you provide details about the market size?
The market size is estimated to be USD XXX million as of 2022.
5. What are some drivers contributing to market growth?
N/A
6. What are the notable trends driving market growth?
N/A
7. Are there any restraints impacting market growth?
N/A
8. Can you provide examples of recent developments in the market?
N/A
9. What pricing options are available for accessing the report?
Pricing options include single-user, multi-user, and enterprise licenses priced at USD 4900.00, USD 7350.00, and USD 9800.00 respectively.
10. Is the market size provided in terms of value or volume?
The market size is provided in terms of value, measured in million.
11. Are there any specific market keywords associated with the report?
Yes, the market keyword associated with the report is "Smart Life Sciences Manufacturing," which aids in identifying and referencing the specific market segment covered.
12. How do I determine which pricing option suits my needs best?
The pricing options vary based on user requirements and access needs. Individual users may opt for single-user licenses, while businesses requiring broader access may choose multi-user or enterprise licenses for cost-effective access to the report.
13. Are there any additional resources or data provided in the Smart Life Sciences Manufacturing report?
While the report offers comprehensive insights, it's advisable to review the specific contents or supplementary materials provided to ascertain if additional resources or data are available.
14. How can I stay updated on further developments or reports in the Smart Life Sciences Manufacturing?
To stay informed about further developments, trends, and reports in the Smart Life Sciences Manufacturing, consider subscribing to industry newsletters, following relevant companies and organizations, or regularly checking reputable industry news sources and publications.
Methodology
Step 1 - Identification of Relevant Samples Size from Population Database


Step 2 - Approaches for Defining Global Market Size (Value, Volume* & Price*)

Note*: In applicable scenarios
Step 3 - Data Sources
Primary Research
- Web Analytics
- Survey Reports
- Research Institute
- Latest Research Reports
- Opinion Leaders
Secondary Research
- Annual Reports
- White Paper
- Latest Press Release
- Industry Association
- Paid Database
- Investor Presentations

Step 4 - Data Triangulation
Involves using different sources of information in order to increase the validity of a study
These sources are likely to be stakeholders in a program - participants, other researchers, program staff, other community members, and so on.
Then we put all data in single framework & apply various statistical tools to find out the dynamic on the market.
During the analysis stage, feedback from the stakeholder groups would be compared to determine areas of agreement as well as areas of divergence
