

Key Insights
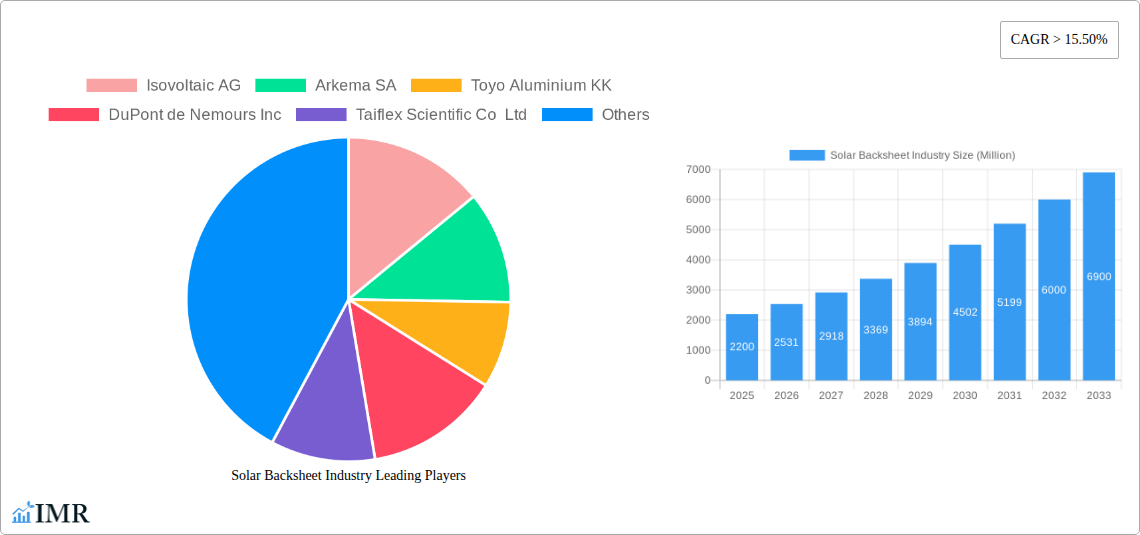
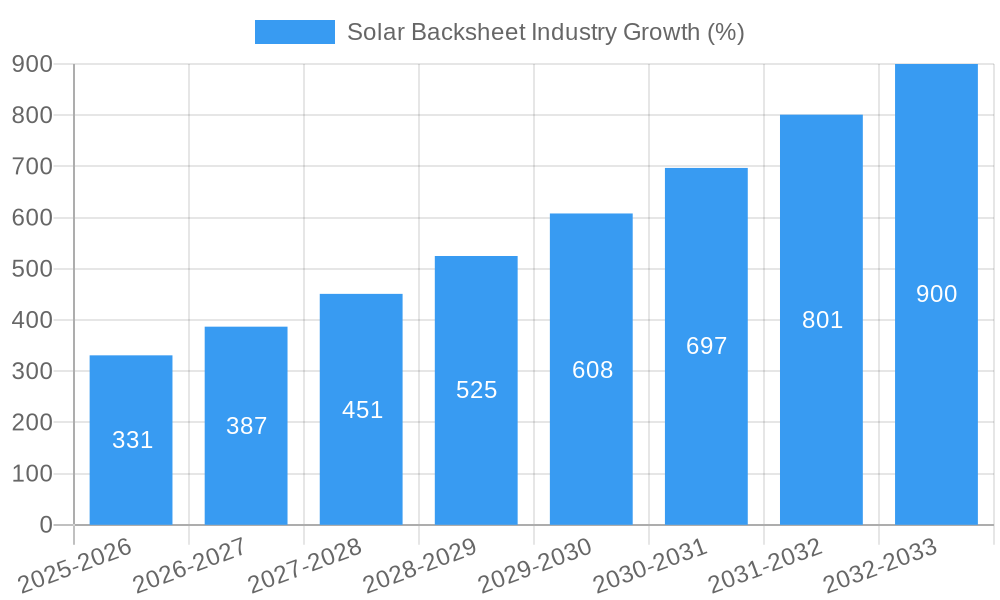
The global solar backsheet market, currently valued at $2.2 billion (2025), is experiencing robust growth, projected to expand at a Compound Annual Growth Rate (CAGR) exceeding 15.5% from 2025 to 2033. This significant expansion is driven by the surging demand for solar energy globally, fueled by increasing concerns about climate change and the decreasing cost of solar photovoltaic (PV) systems. Key factors contributing to this growth include advancements in backsheet technology leading to improved durability, efficiency, and longevity. The market is segmented by material type into fluoropolymer and non-fluoropolymer backsheets, with fluoropolymer currently dominating due to its superior performance characteristics. However, non-fluoropolymer backsheets are gaining traction due to their cost-effectiveness, presenting a compelling alternative for large-scale projects. Geographical expansion is another major driver, with significant growth anticipated in rapidly developing solar markets across Asia-Pacific and South America. Increased government initiatives promoting renewable energy adoption and favorable policies are further accelerating market expansion.
Competition in the solar backsheet market is intense, with major players like DuPont, 3M, and Arkema vying for market share alongside specialized manufacturers. The industry faces challenges including fluctuating raw material prices and stringent quality control requirements. Despite these restraints, the long-term outlook for the solar backsheet market remains highly positive, driven by the continued growth of the broader solar energy sector. Technological innovation focusing on enhanced UV resistance, improved moisture barrier properties, and the development of recyclable backsheets are expected to further shape the market landscape in the coming years. This market presents significant opportunities for manufacturers who can innovate and adapt to the evolving needs of the solar industry.
Solar Backsheet Industry Market Report: 2019-2033
This comprehensive report provides a detailed analysis of the global solar backsheet market, encompassing market dynamics, growth trends, regional analysis, product landscape, key players, and future outlook. The study covers the period 2019-2033, with a focus on the forecast period 2025-2033, using 2025 as the base year. This report is an essential resource for industry professionals, investors, and stakeholders seeking in-depth insights into this dynamic market. The parent market is the broader solar energy industry, while the child market focuses specifically on solar backsheet materials and their applications.
Solar Backsheet Industry Market Dynamics & Structure
The global solar backsheet market is characterized by a moderately consolidated structure with several major players holding significant market share. Market concentration is expected to remain relatively stable in the forecast period, although strategic mergers and acquisitions (M&A) activity could influence the competitive landscape. Technological innovation is a key driver, with ongoing efforts to improve backsheet durability, efficiency, and cost-effectiveness. Regulatory frameworks, particularly those promoting renewable energy adoption, play a significant role in shaping market growth. The increasing demand for high-efficiency solar panels acts as a significant driver and further expands the market opportunities. Competitive substitutes such as alternative encapsulant materials exist but face challenges in matching the overall performance and cost-effectiveness of backsheets. End-user demographics are largely comprised of solar panel manufacturers and project developers globally, with considerable influence from the rising demand of different sizes and types of solar panels.
- Market Concentration: Moderately consolidated, with top 5 players holding approximately xx% market share (2024).
- Technological Innovation: Focus on improved UV resistance, moisture protection, and enhanced durability.
- Regulatory Landscape: Favorable policies promoting renewable energy accelerate market growth.
- M&A Activity: xx deals recorded between 2019-2024, with an estimated xx million USD in total value.
- Competitive Substitutes: Limited viable alternatives currently available in the market.
- Innovation Barriers: High R&D investment requirements and stringent quality standards.
Solar Backsheet Industry Growth Trends & Insights
The global solar backsheet market experienced robust growth during the historical period (2019-2024), driven by the rapid expansion of the global solar energy industry. The market size is expected to grow from xx million units in 2024 to xx million units by 2033, exhibiting a CAGR of xx% during the forecast period. This growth is fueled by several factors, including the decreasing cost of solar energy, increasing government support for renewable energy initiatives, and rising environmental awareness. Technological advancements leading to the development of more efficient and durable backsheet materials further enhance the market's growth trajectory. Consumer behavior is shifting towards more sustainable energy options, creating a conducive environment for the adoption of solar backsheet products.
Dominant Regions, Countries, or Segments in Solar Backsheet Industry
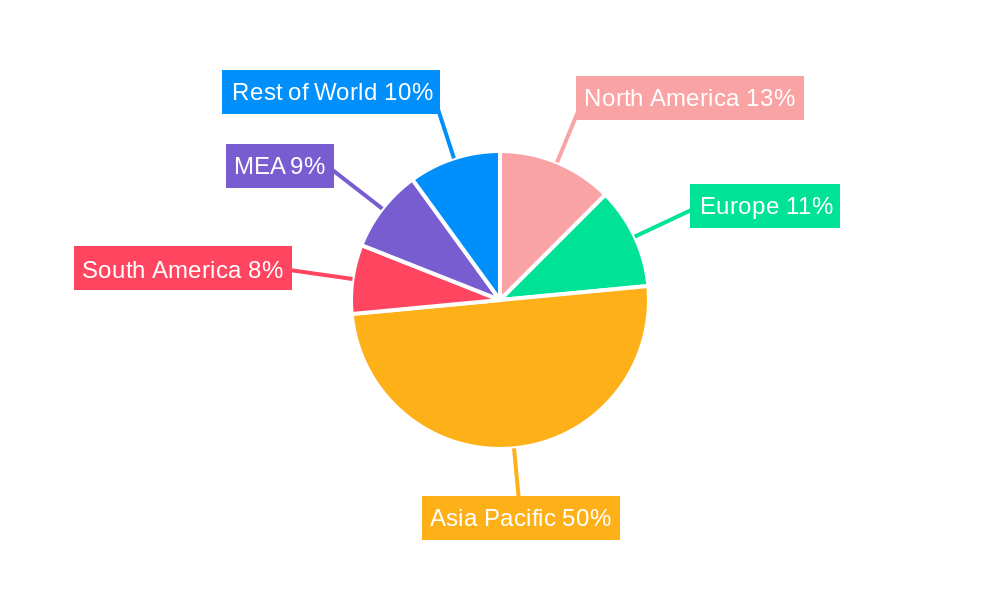
The Asia-Pacific region is currently the dominant market for solar backsheets, driven by substantial solar energy installations in countries like China, India, Japan, and South Korea. This dominance is primarily due to favorable government policies supporting renewable energy adoption, the presence of a large-scale manufacturing base, and robust domestic demand. Within the product types, Fluoropolymer backsheets are expected to dominate this segment and capture a larger market share by 2033. The segment's high demand and popularity are attributed to their superior performance characteristics such as enhanced durability and weather resistance compared to their non-fluoropolymer counterparts.
- Key Drivers in Asia-Pacific:
- Strong government support for renewable energy.
- Large-scale solar energy projects.
- Cost-effective manufacturing capabilities.
- Fluoropolymer Segment Dominance:
- Superior performance characteristics (UV and moisture resistance).
- Increasing demand for high-efficiency solar panels.
- Relatively higher price point compared to non-fluoropolymer backsheets
Solar Backsheet Industry Product Landscape
Solar backsheets are primarily used as protective layers in photovoltaic (PV) modules, safeguarding the solar cells from environmental factors such as moisture, UV radiation, and temperature fluctuations. Recent innovations focus on enhancing durability, efficiency, and cost-effectiveness. Fluoropolymer-based backsheets offer superior performance but command a higher price. Non-fluoropolymer alternatives are gaining traction due to their lower cost. Key performance metrics include UV resistance, moisture barrier properties, and lifespan. Unique selling propositions hinge on achieving longer product life cycles and improved resistance to environmental degradation.
Key Drivers, Barriers & Challenges in Solar Backsheet Industry
Key Drivers:
The increasing global demand for renewable energy, driven by environmental concerns and government policies, is the primary driver of the solar backsheet market. Technological advancements leading to more efficient and durable backsheets also contribute to market expansion. Cost reductions in solar energy technologies further boost market growth.
Key Challenges and Restraints:
Fluctuations in raw material prices can impact profitability. Stringent regulatory compliance requirements and the need for robust quality control pose challenges. Intense competition among manufacturers can put downward pressure on prices. Supply chain disruptions, particularly regarding specialized materials, can hinder market growth.
Emerging Opportunities in Solar Backsheet Industry
Emerging opportunities lie in developing next-generation backsheet materials with enhanced performance and lower environmental impact. The increasing adoption of bifacial solar panels presents a significant growth opportunity. Expansion into untapped markets, particularly in developing economies with high solar irradiation, presents considerable potential. Customized backsheet solutions tailored to specific environmental conditions and application needs offer a further pathway for market expansion.
Growth Accelerators in the Solar Backsheet Industry Industry
Technological breakthroughs in material science are leading to the development of more efficient and cost-effective backsheets. Strategic partnerships between backsheet manufacturers and solar panel producers are fostering innovation and creating economies of scale. Expanding into emerging markets, particularly in regions with high solar radiation and supportive government policies, is crucial for long-term growth.
Key Players Shaping the Solar Backsheet Industry Market
- Isovoltaic AG
- Arkema SA
- Toyo Aluminium KK
- DuPont de Nemours Inc
- Taiflex Scientific Co Ltd
- Targray Technology International Inc
- Coveme SpA
- 3M Co
- Krempel GmbH
- Madico Inc
Notable Milestones in Solar Backsheet Industry Sector
- March 2021: Royal DSM sold its Advanced Solar business (backsheet products) to Worthen Industries Inc. This consolidation impacted market share and competitive dynamics.
- October 2021: The 390-MW Likana Concentrated Solar Power project in Chile was awarded, demonstrating the growing demand for large-scale PV installations and increased backsheet needs.
In-Depth Solar Backsheet Industry Market Outlook
The future of the solar backsheet market looks promising, driven by the continued growth of the renewable energy sector and ongoing advancements in backsheet technology. Strategic partnerships, expansion into new markets, and the development of innovative products will be critical for success. The focus on sustainability and the development of environmentally friendly backsheet materials will also shape future market trends. The market is poised for significant expansion, presenting substantial opportunities for existing players and new entrants alike.
Solar Backsheet Industry Segmentation
-
1. Types
- 1.1. Fluoropolymer
- 1.2. Non-fluoropolymer
Solar Backsheet Industry Segmentation By Geography
- 1. North America
- 2. Europe
- 3. Asia Pacific
- 4. South America
- 5. Middle East and Africa
Solar Backsheet Industry REPORT HIGHLIGHTS
| Aspects | Details |
|---|---|
| Study Period | 2019-2033 |
| Base Year | 2024 |
| Estimated Year | 2025 |
| Forecast Period | 2025-2033 |
| Historical Period | 2019-2024 |
| Growth Rate | CAGR of > 15.50% from 2019-2033 |
| Segmentation |
|
Table of Contents
- 1. Introduction
- 1.1. Research Scope
- 1.2. Market Segmentation
- 1.3. Research Methodology
- 1.4. Definitions and Assumptions
- 2. Executive Summary
- 2.1. Introduction
- 3. Market Dynamics
- 3.1. Introduction
- 3.2. Market Drivers
- 3.2.1. 4.; Increasing Investments in Water Treatment by Developing Countries4.; Growing Demand for the Various End-Use Sectors
- 3.3. Market Restrains
- 3.3.1. 4.; Availability of Cheap and Alternative Pumps
- 3.4. Market Trends
- 3.4.1. Fluoropolymer is Expected to Become a Significant Segment
- 4. Market Factor Analysis
- 4.1. Porters Five Forces
- 4.2. Supply/Value Chain
- 4.3. PESTEL analysis
- 4.4. Market Entropy
- 4.5. Patent/Trademark Analysis
- 5. Global Solar Backsheet Industry Analysis, Insights and Forecast, 2019-2031
- 5.1. Market Analysis, Insights and Forecast - by Types
- 5.1.1. Fluoropolymer
- 5.1.2. Non-fluoropolymer
- 5.2. Market Analysis, Insights and Forecast - by Region
- 5.2.1. North America
- 5.2.2. Europe
- 5.2.3. Asia Pacific
- 5.2.4. South America
- 5.2.5. Middle East and Africa
- 5.1. Market Analysis, Insights and Forecast - by Types
- 6. North America Solar Backsheet Industry Analysis, Insights and Forecast, 2019-2031
- 6.1. Market Analysis, Insights and Forecast - by Types
- 6.1.1. Fluoropolymer
- 6.1.2. Non-fluoropolymer
- 6.1. Market Analysis, Insights and Forecast - by Types
- 7. Europe Solar Backsheet Industry Analysis, Insights and Forecast, 2019-2031
- 7.1. Market Analysis, Insights and Forecast - by Types
- 7.1.1. Fluoropolymer
- 7.1.2. Non-fluoropolymer
- 7.1. Market Analysis, Insights and Forecast - by Types
- 8. Asia Pacific Solar Backsheet Industry Analysis, Insights and Forecast, 2019-2031
- 8.1. Market Analysis, Insights and Forecast - by Types
- 8.1.1. Fluoropolymer
- 8.1.2. Non-fluoropolymer
- 8.1. Market Analysis, Insights and Forecast - by Types
- 9. South America Solar Backsheet Industry Analysis, Insights and Forecast, 2019-2031
- 9.1. Market Analysis, Insights and Forecast - by Types
- 9.1.1. Fluoropolymer
- 9.1.2. Non-fluoropolymer
- 9.1. Market Analysis, Insights and Forecast - by Types
- 10. Middle East and Africa Solar Backsheet Industry Analysis, Insights and Forecast, 2019-2031
- 10.1. Market Analysis, Insights and Forecast - by Types
- 10.1.1. Fluoropolymer
- 10.1.2. Non-fluoropolymer
- 10.1. Market Analysis, Insights and Forecast - by Types
- 11. North America Solar Backsheet Industry Analysis, Insights and Forecast, 2019-2031
- 11.1. Market Analysis, Insights and Forecast - By Country/Sub-region
- 11.1.1 United States
- 11.1.2 Canada
- 11.1.3 Mexico
- 12. Europe Solar Backsheet Industry Analysis, Insights and Forecast, 2019-2031
- 12.1. Market Analysis, Insights and Forecast - By Country/Sub-region
- 12.1.1 Germany
- 12.1.2 United Kingdom
- 12.1.3 France
- 12.1.4 Spain
- 12.1.5 Italy
- 12.1.6 Spain
- 12.1.7 Belgium
- 12.1.8 Netherland
- 12.1.9 Nordics
- 12.1.10 Rest of Europe
- 13. Asia Pacific Solar Backsheet Industry Analysis, Insights and Forecast, 2019-2031
- 13.1. Market Analysis, Insights and Forecast - By Country/Sub-region
- 13.1.1 China
- 13.1.2 Japan
- 13.1.3 India
- 13.1.4 South Korea
- 13.1.5 Southeast Asia
- 13.1.6 Australia
- 13.1.7 Indonesia
- 13.1.8 Phillipes
- 13.1.9 Singapore
- 13.1.10 Thailandc
- 13.1.11 Rest of Asia Pacific
- 14. South America Solar Backsheet Industry Analysis, Insights and Forecast, 2019-2031
- 14.1. Market Analysis, Insights and Forecast - By Country/Sub-region
- 14.1.1 Brazil
- 14.1.2 Argentina
- 14.1.3 Peru
- 14.1.4 Chile
- 14.1.5 Colombia
- 14.1.6 Ecuador
- 14.1.7 Venezuela
- 14.1.8 Rest of South America
- 15. North America Solar Backsheet Industry Analysis, Insights and Forecast, 2019-2031
- 15.1. Market Analysis, Insights and Forecast - By Country/Sub-region
- 15.1.1 United States
- 15.1.2 Canada
- 15.1.3 Mexico
- 16. MEA Solar Backsheet Industry Analysis, Insights and Forecast, 2019-2031
- 16.1. Market Analysis, Insights and Forecast - By Country/Sub-region
- 16.1.1 United Arab Emirates
- 16.1.2 Saudi Arabia
- 16.1.3 South Africa
- 16.1.4 Rest of Middle East and Africa
- 17. Competitive Analysis
- 17.1. Global Market Share Analysis 2024
- 17.2. Company Profiles
- 17.2.1 Isovoltaic AG
- 17.2.1.1. Overview
- 17.2.1.2. Products
- 17.2.1.3. SWOT Analysis
- 17.2.1.4. Recent Developments
- 17.2.1.5. Financials (Based on Availability)
- 17.2.2 Arkema SA
- 17.2.2.1. Overview
- 17.2.2.2. Products
- 17.2.2.3. SWOT Analysis
- 17.2.2.4. Recent Developments
- 17.2.2.5. Financials (Based on Availability)
- 17.2.3 Toyo Aluminium KK
- 17.2.3.1. Overview
- 17.2.3.2. Products
- 17.2.3.3. SWOT Analysis
- 17.2.3.4. Recent Developments
- 17.2.3.5. Financials (Based on Availability)
- 17.2.4 DuPont de Nemours Inc
- 17.2.4.1. Overview
- 17.2.4.2. Products
- 17.2.4.3. SWOT Analysis
- 17.2.4.4. Recent Developments
- 17.2.4.5. Financials (Based on Availability)
- 17.2.5 Taiflex Scientific Co Ltd
- 17.2.5.1. Overview
- 17.2.5.2. Products
- 17.2.5.3. SWOT Analysis
- 17.2.5.4. Recent Developments
- 17.2.5.5. Financials (Based on Availability)
- 17.2.6 Targray Technology International Inc *List Not Exhaustive
- 17.2.6.1. Overview
- 17.2.6.2. Products
- 17.2.6.3. SWOT Analysis
- 17.2.6.4. Recent Developments
- 17.2.6.5. Financials (Based on Availability)
- 17.2.7 Coveme SpA
- 17.2.7.1. Overview
- 17.2.7.2. Products
- 17.2.7.3. SWOT Analysis
- 17.2.7.4. Recent Developments
- 17.2.7.5. Financials (Based on Availability)
- 17.2.8 3M Co
- 17.2.8.1. Overview
- 17.2.8.2. Products
- 17.2.8.3. SWOT Analysis
- 17.2.8.4. Recent Developments
- 17.2.8.5. Financials (Based on Availability)
- 17.2.9 Krempel GmbH
- 17.2.9.1. Overview
- 17.2.9.2. Products
- 17.2.9.3. SWOT Analysis
- 17.2.9.4. Recent Developments
- 17.2.9.5. Financials (Based on Availability)
- 17.2.10 Madico Inc
- 17.2.10.1. Overview
- 17.2.10.2. Products
- 17.2.10.3. SWOT Analysis
- 17.2.10.4. Recent Developments
- 17.2.10.5. Financials (Based on Availability)
- 17.2.1 Isovoltaic AG
List of Figures
- Figure 1: Global Solar Backsheet Industry Revenue Breakdown (Million, %) by Region 2024 & 2032
- Figure 2: Global Solar Backsheet Industry Volume Breakdown (Gigawatt, %) by Region 2024 & 2032
- Figure 3: North America Solar Backsheet Industry Revenue (Million), by Country 2024 & 2032
- Figure 4: North America Solar Backsheet Industry Volume (Gigawatt), by Country 2024 & 2032
- Figure 5: North America Solar Backsheet Industry Revenue Share (%), by Country 2024 & 2032
- Figure 6: North America Solar Backsheet Industry Volume Share (%), by Country 2024 & 2032
- Figure 7: Europe Solar Backsheet Industry Revenue (Million), by Country 2024 & 2032
- Figure 8: Europe Solar Backsheet Industry Volume (Gigawatt), by Country 2024 & 2032
- Figure 9: Europe Solar Backsheet Industry Revenue Share (%), by Country 2024 & 2032
- Figure 10: Europe Solar Backsheet Industry Volume Share (%), by Country 2024 & 2032
- Figure 11: Asia Pacific Solar Backsheet Industry Revenue (Million), by Country 2024 & 2032
- Figure 12: Asia Pacific Solar Backsheet Industry Volume (Gigawatt), by Country 2024 & 2032
- Figure 13: Asia Pacific Solar Backsheet Industry Revenue Share (%), by Country 2024 & 2032
- Figure 14: Asia Pacific Solar Backsheet Industry Volume Share (%), by Country 2024 & 2032
- Figure 15: South America Solar Backsheet Industry Revenue (Million), by Country 2024 & 2032
- Figure 16: South America Solar Backsheet Industry Volume (Gigawatt), by Country 2024 & 2032
- Figure 17: South America Solar Backsheet Industry Revenue Share (%), by Country 2024 & 2032
- Figure 18: South America Solar Backsheet Industry Volume Share (%), by Country 2024 & 2032
- Figure 19: North America Solar Backsheet Industry Revenue (Million), by Country 2024 & 2032
- Figure 20: North America Solar Backsheet Industry Volume (Gigawatt), by Country 2024 & 2032
- Figure 21: North America Solar Backsheet Industry Revenue Share (%), by Country 2024 & 2032
- Figure 22: North America Solar Backsheet Industry Volume Share (%), by Country 2024 & 2032
- Figure 23: MEA Solar Backsheet Industry Revenue (Million), by Country 2024 & 2032
- Figure 24: MEA Solar Backsheet Industry Volume (Gigawatt), by Country 2024 & 2032
- Figure 25: MEA Solar Backsheet Industry Revenue Share (%), by Country 2024 & 2032
- Figure 26: MEA Solar Backsheet Industry Volume Share (%), by Country 2024 & 2032
- Figure 27: North America Solar Backsheet Industry Revenue (Million), by Types 2024 & 2032
- Figure 28: North America Solar Backsheet Industry Volume (Gigawatt), by Types 2024 & 2032
- Figure 29: North America Solar Backsheet Industry Revenue Share (%), by Types 2024 & 2032
- Figure 30: North America Solar Backsheet Industry Volume Share (%), by Types 2024 & 2032
- Figure 31: North America Solar Backsheet Industry Revenue (Million), by Country 2024 & 2032
- Figure 32: North America Solar Backsheet Industry Volume (Gigawatt), by Country 2024 & 2032
- Figure 33: North America Solar Backsheet Industry Revenue Share (%), by Country 2024 & 2032
- Figure 34: North America Solar Backsheet Industry Volume Share (%), by Country 2024 & 2032
- Figure 35: Europe Solar Backsheet Industry Revenue (Million), by Types 2024 & 2032
- Figure 36: Europe Solar Backsheet Industry Volume (Gigawatt), by Types 2024 & 2032
- Figure 37: Europe Solar Backsheet Industry Revenue Share (%), by Types 2024 & 2032
- Figure 38: Europe Solar Backsheet Industry Volume Share (%), by Types 2024 & 2032
- Figure 39: Europe Solar Backsheet Industry Revenue (Million), by Country 2024 & 2032
- Figure 40: Europe Solar Backsheet Industry Volume (Gigawatt), by Country 2024 & 2032
- Figure 41: Europe Solar Backsheet Industry Revenue Share (%), by Country 2024 & 2032
- Figure 42: Europe Solar Backsheet Industry Volume Share (%), by Country 2024 & 2032
- Figure 43: Asia Pacific Solar Backsheet Industry Revenue (Million), by Types 2024 & 2032
- Figure 44: Asia Pacific Solar Backsheet Industry Volume (Gigawatt), by Types 2024 & 2032
- Figure 45: Asia Pacific Solar Backsheet Industry Revenue Share (%), by Types 2024 & 2032
- Figure 46: Asia Pacific Solar Backsheet Industry Volume Share (%), by Types 2024 & 2032
- Figure 47: Asia Pacific Solar Backsheet Industry Revenue (Million), by Country 2024 & 2032
- Figure 48: Asia Pacific Solar Backsheet Industry Volume (Gigawatt), by Country 2024 & 2032
- Figure 49: Asia Pacific Solar Backsheet Industry Revenue Share (%), by Country 2024 & 2032
- Figure 50: Asia Pacific Solar Backsheet Industry Volume Share (%), by Country 2024 & 2032
- Figure 51: South America Solar Backsheet Industry Revenue (Million), by Types 2024 & 2032
- Figure 52: South America Solar Backsheet Industry Volume (Gigawatt), by Types 2024 & 2032
- Figure 53: South America Solar Backsheet Industry Revenue Share (%), by Types 2024 & 2032
- Figure 54: South America Solar Backsheet Industry Volume Share (%), by Types 2024 & 2032
- Figure 55: South America Solar Backsheet Industry Revenue (Million), by Country 2024 & 2032
- Figure 56: South America Solar Backsheet Industry Volume (Gigawatt), by Country 2024 & 2032
- Figure 57: South America Solar Backsheet Industry Revenue Share (%), by Country 2024 & 2032
- Figure 58: South America Solar Backsheet Industry Volume Share (%), by Country 2024 & 2032
- Figure 59: Middle East and Africa Solar Backsheet Industry Revenue (Million), by Types 2024 & 2032
- Figure 60: Middle East and Africa Solar Backsheet Industry Volume (Gigawatt), by Types 2024 & 2032
- Figure 61: Middle East and Africa Solar Backsheet Industry Revenue Share (%), by Types 2024 & 2032
- Figure 62: Middle East and Africa Solar Backsheet Industry Volume Share (%), by Types 2024 & 2032
- Figure 63: Middle East and Africa Solar Backsheet Industry Revenue (Million), by Country 2024 & 2032
- Figure 64: Middle East and Africa Solar Backsheet Industry Volume (Gigawatt), by Country 2024 & 2032
- Figure 65: Middle East and Africa Solar Backsheet Industry Revenue Share (%), by Country 2024 & 2032
- Figure 66: Middle East and Africa Solar Backsheet Industry Volume Share (%), by Country 2024 & 2032
List of Tables
- Table 1: Global Solar Backsheet Industry Revenue Million Forecast, by Region 2019 & 2032
- Table 2: Global Solar Backsheet Industry Volume Gigawatt Forecast, by Region 2019 & 2032
- Table 3: Global Solar Backsheet Industry Revenue Million Forecast, by Types 2019 & 2032
- Table 4: Global Solar Backsheet Industry Volume Gigawatt Forecast, by Types 2019 & 2032
- Table 5: Global Solar Backsheet Industry Revenue Million Forecast, by Region 2019 & 2032
- Table 6: Global Solar Backsheet Industry Volume Gigawatt Forecast, by Region 2019 & 2032
- Table 7: Global Solar Backsheet Industry Revenue Million Forecast, by Country 2019 & 2032
- Table 8: Global Solar Backsheet Industry Volume Gigawatt Forecast, by Country 2019 & 2032
- Table 9: United States Solar Backsheet Industry Revenue (Million) Forecast, by Application 2019 & 2032
- Table 10: United States Solar Backsheet Industry Volume (Gigawatt) Forecast, by Application 2019 & 2032
- Table 11: Canada Solar Backsheet Industry Revenue (Million) Forecast, by Application 2019 & 2032
- Table 12: Canada Solar Backsheet Industry Volume (Gigawatt) Forecast, by Application 2019 & 2032
- Table 13: Mexico Solar Backsheet Industry Revenue (Million) Forecast, by Application 2019 & 2032
- Table 14: Mexico Solar Backsheet Industry Volume (Gigawatt) Forecast, by Application 2019 & 2032
- Table 15: Global Solar Backsheet Industry Revenue Million Forecast, by Country 2019 & 2032
- Table 16: Global Solar Backsheet Industry Volume Gigawatt Forecast, by Country 2019 & 2032
- Table 17: Germany Solar Backsheet Industry Revenue (Million) Forecast, by Application 2019 & 2032
- Table 18: Germany Solar Backsheet Industry Volume (Gigawatt) Forecast, by Application 2019 & 2032
- Table 19: United Kingdom Solar Backsheet Industry Revenue (Million) Forecast, by Application 2019 & 2032
- Table 20: United Kingdom Solar Backsheet Industry Volume (Gigawatt) Forecast, by Application 2019 & 2032
- Table 21: France Solar Backsheet Industry Revenue (Million) Forecast, by Application 2019 & 2032
- Table 22: France Solar Backsheet Industry Volume (Gigawatt) Forecast, by Application 2019 & 2032
- Table 23: Spain Solar Backsheet Industry Revenue (Million) Forecast, by Application 2019 & 2032
- Table 24: Spain Solar Backsheet Industry Volume (Gigawatt) Forecast, by Application 2019 & 2032
- Table 25: Italy Solar Backsheet Industry Revenue (Million) Forecast, by Application 2019 & 2032
- Table 26: Italy Solar Backsheet Industry Volume (Gigawatt) Forecast, by Application 2019 & 2032
- Table 27: Spain Solar Backsheet Industry Revenue (Million) Forecast, by Application 2019 & 2032
- Table 28: Spain Solar Backsheet Industry Volume (Gigawatt) Forecast, by Application 2019 & 2032
- Table 29: Belgium Solar Backsheet Industry Revenue (Million) Forecast, by Application 2019 & 2032
- Table 30: Belgium Solar Backsheet Industry Volume (Gigawatt) Forecast, by Application 2019 & 2032
- Table 31: Netherland Solar Backsheet Industry Revenue (Million) Forecast, by Application 2019 & 2032
- Table 32: Netherland Solar Backsheet Industry Volume (Gigawatt) Forecast, by Application 2019 & 2032
- Table 33: Nordics Solar Backsheet Industry Revenue (Million) Forecast, by Application 2019 & 2032
- Table 34: Nordics Solar Backsheet Industry Volume (Gigawatt) Forecast, by Application 2019 & 2032
- Table 35: Rest of Europe Solar Backsheet Industry Revenue (Million) Forecast, by Application 2019 & 2032
- Table 36: Rest of Europe Solar Backsheet Industry Volume (Gigawatt) Forecast, by Application 2019 & 2032
- Table 37: Global Solar Backsheet Industry Revenue Million Forecast, by Country 2019 & 2032
- Table 38: Global Solar Backsheet Industry Volume Gigawatt Forecast, by Country 2019 & 2032
- Table 39: China Solar Backsheet Industry Revenue (Million) Forecast, by Application 2019 & 2032
- Table 40: China Solar Backsheet Industry Volume (Gigawatt) Forecast, by Application 2019 & 2032
- Table 41: Japan Solar Backsheet Industry Revenue (Million) Forecast, by Application 2019 & 2032
- Table 42: Japan Solar Backsheet Industry Volume (Gigawatt) Forecast, by Application 2019 & 2032
- Table 43: India Solar Backsheet Industry Revenue (Million) Forecast, by Application 2019 & 2032
- Table 44: India Solar Backsheet Industry Volume (Gigawatt) Forecast, by Application 2019 & 2032
- Table 45: South Korea Solar Backsheet Industry Revenue (Million) Forecast, by Application 2019 & 2032
- Table 46: South Korea Solar Backsheet Industry Volume (Gigawatt) Forecast, by Application 2019 & 2032
- Table 47: Southeast Asia Solar Backsheet Industry Revenue (Million) Forecast, by Application 2019 & 2032
- Table 48: Southeast Asia Solar Backsheet Industry Volume (Gigawatt) Forecast, by Application 2019 & 2032
- Table 49: Australia Solar Backsheet Industry Revenue (Million) Forecast, by Application 2019 & 2032
- Table 50: Australia Solar Backsheet Industry Volume (Gigawatt) Forecast, by Application 2019 & 2032
- Table 51: Indonesia Solar Backsheet Industry Revenue (Million) Forecast, by Application 2019 & 2032
- Table 52: Indonesia Solar Backsheet Industry Volume (Gigawatt) Forecast, by Application 2019 & 2032
- Table 53: Phillipes Solar Backsheet Industry Revenue (Million) Forecast, by Application 2019 & 2032
- Table 54: Phillipes Solar Backsheet Industry Volume (Gigawatt) Forecast, by Application 2019 & 2032
- Table 55: Singapore Solar Backsheet Industry Revenue (Million) Forecast, by Application 2019 & 2032
- Table 56: Singapore Solar Backsheet Industry Volume (Gigawatt) Forecast, by Application 2019 & 2032
- Table 57: Thailandc Solar Backsheet Industry Revenue (Million) Forecast, by Application 2019 & 2032
- Table 58: Thailandc Solar Backsheet Industry Volume (Gigawatt) Forecast, by Application 2019 & 2032
- Table 59: Rest of Asia Pacific Solar Backsheet Industry Revenue (Million) Forecast, by Application 2019 & 2032
- Table 60: Rest of Asia Pacific Solar Backsheet Industry Volume (Gigawatt) Forecast, by Application 2019 & 2032
- Table 61: Global Solar Backsheet Industry Revenue Million Forecast, by Country 2019 & 2032
- Table 62: Global Solar Backsheet Industry Volume Gigawatt Forecast, by Country 2019 & 2032
- Table 63: Brazil Solar Backsheet Industry Revenue (Million) Forecast, by Application 2019 & 2032
- Table 64: Brazil Solar Backsheet Industry Volume (Gigawatt) Forecast, by Application 2019 & 2032
- Table 65: Argentina Solar Backsheet Industry Revenue (Million) Forecast, by Application 2019 & 2032
- Table 66: Argentina Solar Backsheet Industry Volume (Gigawatt) Forecast, by Application 2019 & 2032
- Table 67: Peru Solar Backsheet Industry Revenue (Million) Forecast, by Application 2019 & 2032
- Table 68: Peru Solar Backsheet Industry Volume (Gigawatt) Forecast, by Application 2019 & 2032
- Table 69: Chile Solar Backsheet Industry Revenue (Million) Forecast, by Application 2019 & 2032
- Table 70: Chile Solar Backsheet Industry Volume (Gigawatt) Forecast, by Application 2019 & 2032
- Table 71: Colombia Solar Backsheet Industry Revenue (Million) Forecast, by Application 2019 & 2032
- Table 72: Colombia Solar Backsheet Industry Volume (Gigawatt) Forecast, by Application 2019 & 2032
- Table 73: Ecuador Solar Backsheet Industry Revenue (Million) Forecast, by Application 2019 & 2032
- Table 74: Ecuador Solar Backsheet Industry Volume (Gigawatt) Forecast, by Application 2019 & 2032
- Table 75: Venezuela Solar Backsheet Industry Revenue (Million) Forecast, by Application 2019 & 2032
- Table 76: Venezuela Solar Backsheet Industry Volume (Gigawatt) Forecast, by Application 2019 & 2032
- Table 77: Rest of South America Solar Backsheet Industry Revenue (Million) Forecast, by Application 2019 & 2032
- Table 78: Rest of South America Solar Backsheet Industry Volume (Gigawatt) Forecast, by Application 2019 & 2032
- Table 79: Global Solar Backsheet Industry Revenue Million Forecast, by Country 2019 & 2032
- Table 80: Global Solar Backsheet Industry Volume Gigawatt Forecast, by Country 2019 & 2032
- Table 81: United States Solar Backsheet Industry Revenue (Million) Forecast, by Application 2019 & 2032
- Table 82: United States Solar Backsheet Industry Volume (Gigawatt) Forecast, by Application 2019 & 2032
- Table 83: Canada Solar Backsheet Industry Revenue (Million) Forecast, by Application 2019 & 2032
- Table 84: Canada Solar Backsheet Industry Volume (Gigawatt) Forecast, by Application 2019 & 2032
- Table 85: Mexico Solar Backsheet Industry Revenue (Million) Forecast, by Application 2019 & 2032
- Table 86: Mexico Solar Backsheet Industry Volume (Gigawatt) Forecast, by Application 2019 & 2032
- Table 87: Global Solar Backsheet Industry Revenue Million Forecast, by Country 2019 & 2032
- Table 88: Global Solar Backsheet Industry Volume Gigawatt Forecast, by Country 2019 & 2032
- Table 89: United Arab Emirates Solar Backsheet Industry Revenue (Million) Forecast, by Application 2019 & 2032
- Table 90: United Arab Emirates Solar Backsheet Industry Volume (Gigawatt) Forecast, by Application 2019 & 2032
- Table 91: Saudi Arabia Solar Backsheet Industry Revenue (Million) Forecast, by Application 2019 & 2032
- Table 92: Saudi Arabia Solar Backsheet Industry Volume (Gigawatt) Forecast, by Application 2019 & 2032
- Table 93: South Africa Solar Backsheet Industry Revenue (Million) Forecast, by Application 2019 & 2032
- Table 94: South Africa Solar Backsheet Industry Volume (Gigawatt) Forecast, by Application 2019 & 2032
- Table 95: Rest of Middle East and Africa Solar Backsheet Industry Revenue (Million) Forecast, by Application 2019 & 2032
- Table 96: Rest of Middle East and Africa Solar Backsheet Industry Volume (Gigawatt) Forecast, by Application 2019 & 2032
- Table 97: Global Solar Backsheet Industry Revenue Million Forecast, by Types 2019 & 2032
- Table 98: Global Solar Backsheet Industry Volume Gigawatt Forecast, by Types 2019 & 2032
- Table 99: Global Solar Backsheet Industry Revenue Million Forecast, by Country 2019 & 2032
- Table 100: Global Solar Backsheet Industry Volume Gigawatt Forecast, by Country 2019 & 2032
- Table 101: Global Solar Backsheet Industry Revenue Million Forecast, by Types 2019 & 2032
- Table 102: Global Solar Backsheet Industry Volume Gigawatt Forecast, by Types 2019 & 2032
- Table 103: Global Solar Backsheet Industry Revenue Million Forecast, by Country 2019 & 2032
- Table 104: Global Solar Backsheet Industry Volume Gigawatt Forecast, by Country 2019 & 2032
- Table 105: Global Solar Backsheet Industry Revenue Million Forecast, by Types 2019 & 2032
- Table 106: Global Solar Backsheet Industry Volume Gigawatt Forecast, by Types 2019 & 2032
- Table 107: Global Solar Backsheet Industry Revenue Million Forecast, by Country 2019 & 2032
- Table 108: Global Solar Backsheet Industry Volume Gigawatt Forecast, by Country 2019 & 2032
- Table 109: Global Solar Backsheet Industry Revenue Million Forecast, by Types 2019 & 2032
- Table 110: Global Solar Backsheet Industry Volume Gigawatt Forecast, by Types 2019 & 2032
- Table 111: Global Solar Backsheet Industry Revenue Million Forecast, by Country 2019 & 2032
- Table 112: Global Solar Backsheet Industry Volume Gigawatt Forecast, by Country 2019 & 2032
- Table 113: Global Solar Backsheet Industry Revenue Million Forecast, by Types 2019 & 2032
- Table 114: Global Solar Backsheet Industry Volume Gigawatt Forecast, by Types 2019 & 2032
- Table 115: Global Solar Backsheet Industry Revenue Million Forecast, by Country 2019 & 2032
- Table 116: Global Solar Backsheet Industry Volume Gigawatt Forecast, by Country 2019 & 2032
Frequently Asked Questions
1. What is the projected Compound Annual Growth Rate (CAGR) of the Solar Backsheet Industry?
The projected CAGR is approximately > 15.50%.
2. Which companies are prominent players in the Solar Backsheet Industry?
Key companies in the market include Isovoltaic AG, Arkema SA, Toyo Aluminium KK, DuPont de Nemours Inc, Taiflex Scientific Co Ltd, Targray Technology International Inc *List Not Exhaustive, Coveme SpA, 3M Co, Krempel GmbH, Madico Inc.
3. What are the main segments of the Solar Backsheet Industry?
The market segments include Types.
4. Can you provide details about the market size?
The market size is estimated to be USD 2200 Million as of 2022.
5. What are some drivers contributing to market growth?
4.; Increasing Investments in Water Treatment by Developing Countries4.; Growing Demand for the Various End-Use Sectors.
6. What are the notable trends driving market growth?
Fluoropolymer is Expected to Become a Significant Segment.
7. Are there any restraints impacting market growth?
4.; Availability of Cheap and Alternative Pumps.
8. Can you provide examples of recent developments in the market?
In March 2021, Royal DSM, a global science-based company in health, nutrition, and sustainable living, agreed to sell its Advanced Solar business involved in backsheet products to the Worthen Industries Inc.
9. What pricing options are available for accessing the report?
Pricing options include single-user, multi-user, and enterprise licenses priced at USD 4750, USD 5250, and USD 8750 respectively.
10. Is the market size provided in terms of value or volume?
The market size is provided in terms of value, measured in Million and volume, measured in Gigawatt.
11. Are there any specific market keywords associated with the report?
Yes, the market keyword associated with the report is "Solar Backsheet Industry," which aids in identifying and referencing the specific market segment covered.
12. How do I determine which pricing option suits my needs best?
The pricing options vary based on user requirements and access needs. Individual users may opt for single-user licenses, while businesses requiring broader access may choose multi-user or enterprise licenses for cost-effective access to the report.
13. Are there any additional resources or data provided in the Solar Backsheet Industry report?
While the report offers comprehensive insights, it's advisable to review the specific contents or supplementary materials provided to ascertain if additional resources or data are available.
14. How can I stay updated on further developments or reports in the Solar Backsheet Industry?
To stay informed about further developments, trends, and reports in the Solar Backsheet Industry, consider subscribing to industry newsletters, following relevant companies and organizations, or regularly checking reputable industry news sources and publications.
Methodology
Step 1 - Identification of Relevant Samples Size from Population Database


Step 2 - Approaches for Defining Global Market Size (Value, Volume* & Price*)

Note*: In applicable scenarios
Step 3 - Data Sources
Primary Research
- Web Analytics
- Survey Reports
- Research Institute
- Latest Research Reports
- Opinion Leaders
Secondary Research
- Annual Reports
- White Paper
- Latest Press Release
- Industry Association
- Paid Database
- Investor Presentations

Step 4 - Data Triangulation
Involves using different sources of information in order to increase the validity of a study
These sources are likely to be stakeholders in a program - participants, other researchers, program staff, other community members, and so on.
Then we put all data in single framework & apply various statistical tools to find out the dynamic on the market.
During the analysis stage, feedback from the stakeholder groups would be compared to determine areas of agreement as well as areas of divergence
