

Key Insights
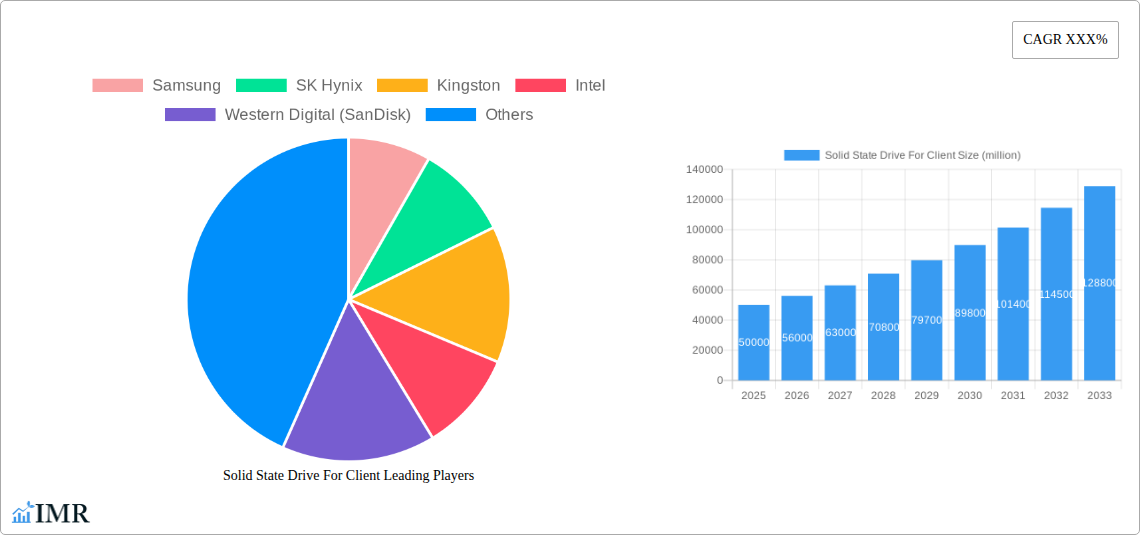
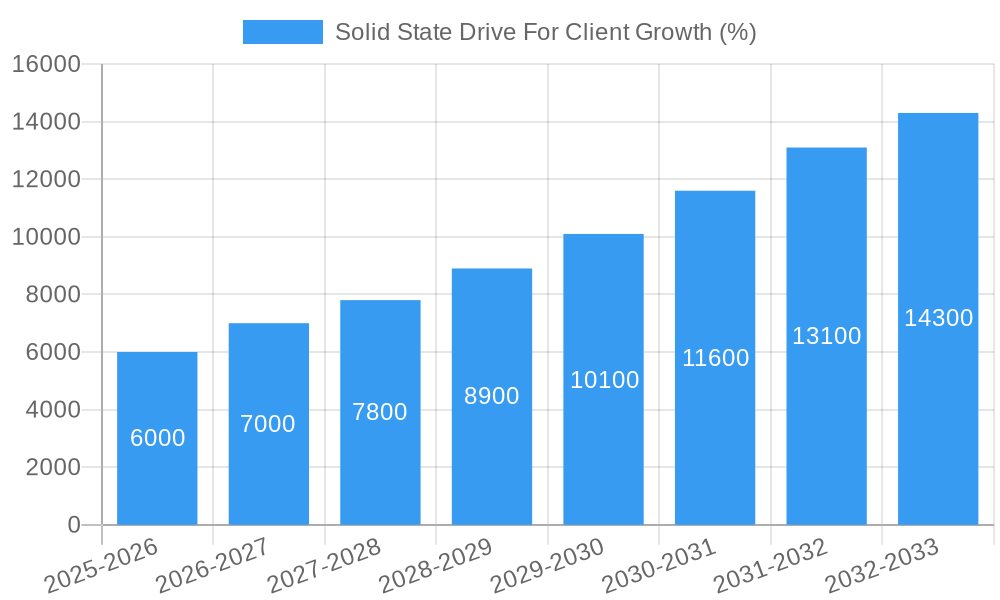
The global Solid State Drive (SSD) for Client market is experiencing robust growth, driven by the increasing demand for faster data storage and processing speeds in laptops, desktops, and other client devices. The market, estimated at $50 billion in 2025, is projected to exhibit a Compound Annual Growth Rate (CAGR) of 12% from 2025 to 2033, reaching approximately $120 billion by the end of the forecast period. This significant expansion is fueled by several key factors. The proliferation of high-resolution multimedia content, the rise of data-intensive applications like gaming and video editing, and the growing adoption of cloud computing are all contributing to increased storage needs, favoring SSDs over traditional hard disk drives (HDDs). Furthermore, advancements in NAND flash memory technology are leading to higher storage capacities, improved performance, and reduced costs, making SSDs increasingly accessible to a broader range of consumers. Key market segments include SATA, NVMe, and m.2 SSDs, with NVMe showing particularly strong growth due to its superior speed and efficiency. Competitive landscape is fiercely competitive, with major players like Samsung, SK Hynix, Kingston, and Western Digital vying for market share through innovation and aggressive pricing strategies.
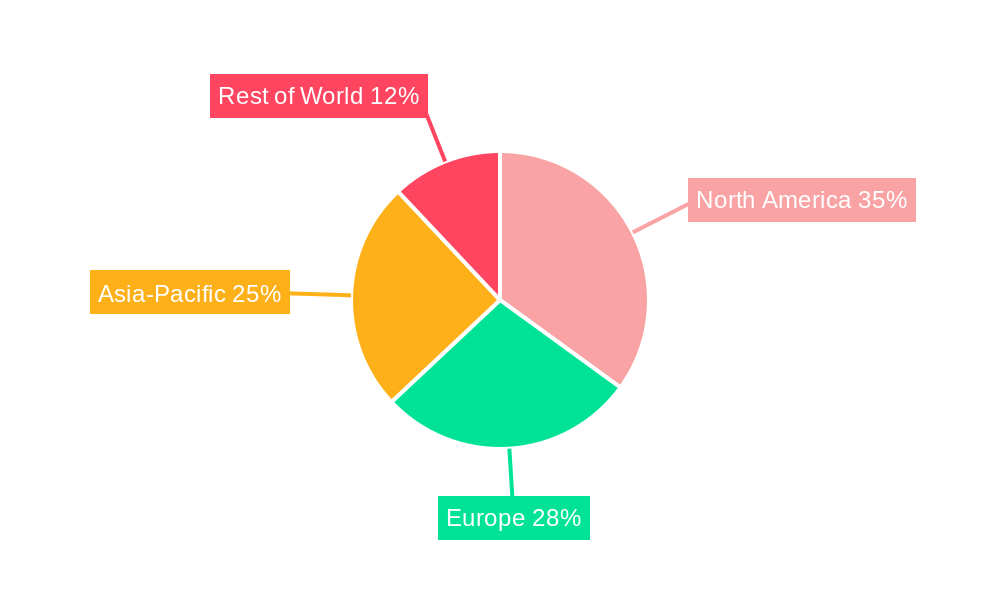
Despite this positive outlook, the market faces certain challenges. Fluctuations in raw material prices, particularly NAND flash memory, can impact profitability. Furthermore, competition from less expensive HDDs, particularly in price-sensitive markets, remains a factor. However, ongoing technological advancements and the increasing preference for faster, more reliable storage solutions suggest that the SSD for Client market will maintain its strong growth trajectory in the coming years. The continued miniaturization of devices and increasing demand for portable storage will further enhance this growth. Regional variations exist, with North America and Europe currently dominating the market, but growth is expected to be particularly strong in Asia-Pacific regions due to increasing consumer spending power and technology adoption.
Solid State Drive (SSD) for Client Market: A Comprehensive Report (2019-2033)
This in-depth report provides a comprehensive analysis of the Solid State Drive (SSD) for Client market, encompassing historical data (2019-2024), the base year (2025), and a detailed forecast (2025-2033). The report leverages advanced analytical methodologies to deliver actionable insights for industry professionals, investors, and stakeholders. We analyze the parent market of data storage devices and the child market of client-focused SSDs (laptops, desktops, etc.), providing a granular view of market dynamics, growth trends, and competitive landscapes. The report projects a xx million unit market size in 2025, exhibiting a CAGR of xx% during the forecast period.
Solid State Drive (SSD) for Client Market Dynamics & Structure
This section analyzes the competitive landscape, technological advancements, regulatory influences, and market trends within the client SSD sector. We dissect market concentration, revealing the leading players' market share and identifying potential mergers & acquisitions (M&A) activities impacting the industry. The report also examines the influence of substitute technologies and evolving end-user demands.
- Market Concentration: Samsung and Western Digital (SanDisk) currently hold a combined xx% market share. The market is moderately concentrated, with several other key players vying for dominance.
- Technological Innovation: Focus on NVMe technology, higher storage capacities (e.g., exceeding 8TB), and improved power efficiency are key innovation drivers.
- Regulatory Frameworks: Compliance with data privacy regulations (GDPR, CCPA) and environmental regulations (e-waste management) are significant influencing factors.
- Competitive Substitutes: Traditional HDDs remain a viable, albeit slower, alternative, particularly in price-sensitive segments.
- M&A Activity: The historical period (2019-2024) witnessed xx major M&A deals, primarily focused on expanding product portfolios and market reach. The forecast period anticipates xx more deals.
- End-User Demographics: The growth is driven by consumers and businesses adopting higher storage capacity devices for data-intensive applications.
Solid State Drive (SSD) for Client Growth Trends & Insights
This section analyzes the historical and projected growth trajectory of the client SSD market, incorporating detailed quantitative and qualitative data. We examine growth drivers, market penetration rates, and technological disruptions impacting market evolution. We discuss consumer preference shifts towards faster and more reliable storage solutions, including the growing popularity of NVMe SSDs. The analysis also encompasses the impact of economic fluctuations and global supply chain dynamics on growth rates.
Dominant Regions, Countries, or Segments in Solid State Drive for Client
This report pinpoints the leading geographic regions and market segments driving growth within the client SSD market. Detailed analysis explores the reasons behind this dominance, factoring in economic conditions, infrastructure development, and consumer preferences.
- North America: High adoption rates in the consumer and enterprise segments are fuelled by advanced infrastructure and strong technological adoption.
- Asia-Pacific: Rapid economic growth and increased consumer spending create strong demand, particularly in China and India.
- Europe: The region showcases steady growth, driven by increasing data consumption and government initiatives promoting digitalization.
- Key Drivers: Government initiatives promoting digital infrastructure, robust consumer electronics manufacturing, and increasing data storage needs in both consumer and enterprise sectors.
Solid State Drive (SSD) for Client Product Landscape
The client SSD market offers a diverse range of products catering to varying performance needs and price points. Innovation focuses on increased storage capacities, faster data transfer speeds (leveraging NVMe interfaces), and enhanced power efficiency. Key features driving market growth include improved durability, smaller form factors (e.g., M.2), and robust data security features.
Key Drivers, Barriers & Challenges in Solid State Drive for Client
This section examines the major growth drivers and the significant challenges impacting the client SSD market.
Key Drivers:
- Increasing Data Storage Needs: Consumers and businesses need more storage space for multimedia and business applications.
- Technological Advancements: Faster NVMe drives with higher capacities continue to improve performance and reliability.
- Falling Prices: The cost of SSDs has decreased significantly, increasing affordability for a wider consumer base.
Key Challenges:
- Supply Chain Disruptions: Global events can lead to shortages and price volatility.
- Competition: Intense competition among manufacturers puts pressure on pricing and margins.
- Regulatory Compliance: Meeting data privacy and environmental regulations adds complexity for manufacturers.
Emerging Opportunities in Solid State Drive for Client
- Growth in Data Centers: Increased demand for high-performance SSDs in data centers provides lucrative market opportunities.
- Expansion into Emerging Markets: Untapped markets in developing economies present significant growth potential.
- Innovation in Form Factors: Developing smaller, more energy-efficient SSDs opens new possibilities for portable devices and IoT applications.
Growth Accelerators in the Solid State Drive for Client Industry
Long-term growth is expected to be driven by advancements in NAND flash technology, increased adoption of NVMe SSDs, and strategic partnerships between manufacturers and technology companies to integrate SSDs seamlessly into new devices and platforms. The emergence of new applications, such as edge computing and artificial intelligence, further fuels the demand for high-performance SSDs.
Key Players Shaping the Solid State Drive for Client Market
- Samsung
- SK Hynix
- Kingston
- Intel
- Western Digital (SanDisk)
- Kimtigo
- Seagate
- Kioxia (Lite-On)
- Netac Technology
- Micron (Crucial)
- Clolorful
- Powev
- HP
- Transcend
- GIGABYTE
- Teclast
- Lenovo
- ADATA Technology
- Shenzhen Longsys (Lexar)
Notable Milestones in Solid State Drive for Client Sector
- 2020-Q4: Samsung launches its first 8TB client SSD.
- 2021-Q2: Western Digital introduces a new line of high-end NVMe SSDs targeting gamers.
- 2022-Q3: Micron and Kioxia announce a joint venture to expand flash memory production.
- 2023-Q1: Intel releases its latest generation of client SSDs featuring improved performance. (Further milestones to be added based on available data)
In-Depth Solid State Drive for Client Market Outlook
The client SSD market is poised for continued growth, driven by technological innovation, increasing data storage needs, and the expansion of high-growth markets. Strategic partnerships and acquisitions will further consolidate the market, leading to more efficient production and increased market penetration. The development of new, faster and more efficient SSD technologies promises to further fuel the demand for high-performance storage solutions in the coming years.
Solid State Drive For Client Segmentation
-
1. Application
- 1.1. Laptop
- 1.2. Game Host
- 1.3. Others
-
2. Type
- 2.1. MLC
- 2.2. TLC
- 2.3. QLC
Solid State Drive For Client Segmentation By Geography
-
1. North America
- 1.1. United States
- 1.2. Canada
- 1.3. Mexico
-
2. South America
- 2.1. Brazil
- 2.2. Argentina
- 2.3. Rest of South America
-
3. Europe
- 3.1. United Kingdom
- 3.2. Germany
- 3.3. France
- 3.4. Italy
- 3.5. Spain
- 3.6. Russia
- 3.7. Benelux
- 3.8. Nordics
- 3.9. Rest of Europe
-
4. Middle East & Africa
- 4.1. Turkey
- 4.2. Israel
- 4.3. GCC
- 4.4. North Africa
- 4.5. South Africa
- 4.6. Rest of Middle East & Africa
-
5. Asia Pacific
- 5.1. China
- 5.2. India
- 5.3. Japan
- 5.4. South Korea
- 5.5. ASEAN
- 5.6. Oceania
- 5.7. Rest of Asia Pacific
Solid State Drive For Client REPORT HIGHLIGHTS
| Aspects | Details |
|---|---|
| Study Period | 2019-2033 |
| Base Year | 2024 |
| Estimated Year | 2025 |
| Forecast Period | 2025-2033 |
| Historical Period | 2019-2024 |
| Growth Rate | CAGR of XXX% from 2019-2033 |
| Segmentation |
|
Table of Contents
- 1. Introduction
- 1.1. Research Scope
- 1.2. Market Segmentation
- 1.3. Research Methodology
- 1.4. Definitions and Assumptions
- 2. Executive Summary
- 2.1. Introduction
- 3. Market Dynamics
- 3.1. Introduction
- 3.2. Market Drivers
- 3.3. Market Restrains
- 3.4. Market Trends
- 4. Market Factor Analysis
- 4.1. Porters Five Forces
- 4.2. Supply/Value Chain
- 4.3. PESTEL analysis
- 4.4. Market Entropy
- 4.5. Patent/Trademark Analysis
- 5. Global Solid State Drive For Client Analysis, Insights and Forecast, 2019-2031
- 5.1. Market Analysis, Insights and Forecast - by Application
- 5.1.1. Laptop
- 5.1.2. Game Host
- 5.1.3. Others
- 5.2. Market Analysis, Insights and Forecast - by Type
- 5.2.1. MLC
- 5.2.2. TLC
- 5.2.3. QLC
- 5.3. Market Analysis, Insights and Forecast - by Region
- 5.3.1. North America
- 5.3.2. South America
- 5.3.3. Europe
- 5.3.4. Middle East & Africa
- 5.3.5. Asia Pacific
- 5.1. Market Analysis, Insights and Forecast - by Application
- 6. North America Solid State Drive For Client Analysis, Insights and Forecast, 2019-2031
- 6.1. Market Analysis, Insights and Forecast - by Application
- 6.1.1. Laptop
- 6.1.2. Game Host
- 6.1.3. Others
- 6.2. Market Analysis, Insights and Forecast - by Type
- 6.2.1. MLC
- 6.2.2. TLC
- 6.2.3. QLC
- 6.1. Market Analysis, Insights and Forecast - by Application
- 7. South America Solid State Drive For Client Analysis, Insights and Forecast, 2019-2031
- 7.1. Market Analysis, Insights and Forecast - by Application
- 7.1.1. Laptop
- 7.1.2. Game Host
- 7.1.3. Others
- 7.2. Market Analysis, Insights and Forecast - by Type
- 7.2.1. MLC
- 7.2.2. TLC
- 7.2.3. QLC
- 7.1. Market Analysis, Insights and Forecast - by Application
- 8. Europe Solid State Drive For Client Analysis, Insights and Forecast, 2019-2031
- 8.1. Market Analysis, Insights and Forecast - by Application
- 8.1.1. Laptop
- 8.1.2. Game Host
- 8.1.3. Others
- 8.2. Market Analysis, Insights and Forecast - by Type
- 8.2.1. MLC
- 8.2.2. TLC
- 8.2.3. QLC
- 8.1. Market Analysis, Insights and Forecast - by Application
- 9. Middle East & Africa Solid State Drive For Client Analysis, Insights and Forecast, 2019-2031
- 9.1. Market Analysis, Insights and Forecast - by Application
- 9.1.1. Laptop
- 9.1.2. Game Host
- 9.1.3. Others
- 9.2. Market Analysis, Insights and Forecast - by Type
- 9.2.1. MLC
- 9.2.2. TLC
- 9.2.3. QLC
- 9.1. Market Analysis, Insights and Forecast - by Application
- 10. Asia Pacific Solid State Drive For Client Analysis, Insights and Forecast, 2019-2031
- 10.1. Market Analysis, Insights and Forecast - by Application
- 10.1.1. Laptop
- 10.1.2. Game Host
- 10.1.3. Others
- 10.2. Market Analysis, Insights and Forecast - by Type
- 10.2.1. MLC
- 10.2.2. TLC
- 10.2.3. QLC
- 10.1. Market Analysis, Insights and Forecast - by Application
- 11. Competitive Analysis
- 11.1. Global Market Share Analysis 2024
- 11.2. Company Profiles
- 11.2.1 Samsung
- 11.2.1.1. Overview
- 11.2.1.2. Products
- 11.2.1.3. SWOT Analysis
- 11.2.1.4. Recent Developments
- 11.2.1.5. Financials (Based on Availability)
- 11.2.2 SK Hynix
- 11.2.2.1. Overview
- 11.2.2.2. Products
- 11.2.2.3. SWOT Analysis
- 11.2.2.4. Recent Developments
- 11.2.2.5. Financials (Based on Availability)
- 11.2.3 Kingston
- 11.2.3.1. Overview
- 11.2.3.2. Products
- 11.2.3.3. SWOT Analysis
- 11.2.3.4. Recent Developments
- 11.2.3.5. Financials (Based on Availability)
- 11.2.4 Intel
- 11.2.4.1. Overview
- 11.2.4.2. Products
- 11.2.4.3. SWOT Analysis
- 11.2.4.4. Recent Developments
- 11.2.4.5. Financials (Based on Availability)
- 11.2.5 Western Digital (SanDisk)
- 11.2.5.1. Overview
- 11.2.5.2. Products
- 11.2.5.3. SWOT Analysis
- 11.2.5.4. Recent Developments
- 11.2.5.5. Financials (Based on Availability)
- 11.2.6 Kimtigo
- 11.2.6.1. Overview
- 11.2.6.2. Products
- 11.2.6.3. SWOT Analysis
- 11.2.6.4. Recent Developments
- 11.2.6.5. Financials (Based on Availability)
- 11.2.7 Seagate
- 11.2.7.1. Overview
- 11.2.7.2. Products
- 11.2.7.3. SWOT Analysis
- 11.2.7.4. Recent Developments
- 11.2.7.5. Financials (Based on Availability)
- 11.2.8 Kioxia (Lite-On)
- 11.2.8.1. Overview
- 11.2.8.2. Products
- 11.2.8.3. SWOT Analysis
- 11.2.8.4. Recent Developments
- 11.2.8.5. Financials (Based on Availability)
- 11.2.9 Netac Technology
- 11.2.9.1. Overview
- 11.2.9.2. Products
- 11.2.9.3. SWOT Analysis
- 11.2.9.4. Recent Developments
- 11.2.9.5. Financials (Based on Availability)
- 11.2.10 Micron (Crucial)
- 11.2.10.1. Overview
- 11.2.10.2. Products
- 11.2.10.3. SWOT Analysis
- 11.2.10.4. Recent Developments
- 11.2.10.5. Financials (Based on Availability)
- 11.2.11 Clolorful
- 11.2.11.1. Overview
- 11.2.11.2. Products
- 11.2.11.3. SWOT Analysis
- 11.2.11.4. Recent Developments
- 11.2.11.5. Financials (Based on Availability)
- 11.2.12 Powev
- 11.2.12.1. Overview
- 11.2.12.2. Products
- 11.2.12.3. SWOT Analysis
- 11.2.12.4. Recent Developments
- 11.2.12.5. Financials (Based on Availability)
- 11.2.13 HP
- 11.2.13.1. Overview
- 11.2.13.2. Products
- 11.2.13.3. SWOT Analysis
- 11.2.13.4. Recent Developments
- 11.2.13.5. Financials (Based on Availability)
- 11.2.14 Transcend
- 11.2.14.1. Overview
- 11.2.14.2. Products
- 11.2.14.3. SWOT Analysis
- 11.2.14.4. Recent Developments
- 11.2.14.5. Financials (Based on Availability)
- 11.2.15 GIGABYTE
- 11.2.15.1. Overview
- 11.2.15.2. Products
- 11.2.15.3. SWOT Analysis
- 11.2.15.4. Recent Developments
- 11.2.15.5. Financials (Based on Availability)
- 11.2.16 Teclast
- 11.2.16.1. Overview
- 11.2.16.2. Products
- 11.2.16.3. SWOT Analysis
- 11.2.16.4. Recent Developments
- 11.2.16.5. Financials (Based on Availability)
- 11.2.17 Lenovo
- 11.2.17.1. Overview
- 11.2.17.2. Products
- 11.2.17.3. SWOT Analysis
- 11.2.17.4. Recent Developments
- 11.2.17.5. Financials (Based on Availability)
- 11.2.18 ADATA Technology
- 11.2.18.1. Overview
- 11.2.18.2. Products
- 11.2.18.3. SWOT Analysis
- 11.2.18.4. Recent Developments
- 11.2.18.5. Financials (Based on Availability)
- 11.2.19 Shenzhen Longsys (Lexar)
- 11.2.19.1. Overview
- 11.2.19.2. Products
- 11.2.19.3. SWOT Analysis
- 11.2.19.4. Recent Developments
- 11.2.19.5. Financials (Based on Availability)
- 11.2.1 Samsung
List of Figures
- Figure 1: Global Solid State Drive For Client Revenue Breakdown (million, %) by Region 2024 & 2032
- Figure 2: Global Solid State Drive For Client Volume Breakdown (K, %) by Region 2024 & 2032
- Figure 3: North America Solid State Drive For Client Revenue (million), by Application 2024 & 2032
- Figure 4: North America Solid State Drive For Client Volume (K), by Application 2024 & 2032
- Figure 5: North America Solid State Drive For Client Revenue Share (%), by Application 2024 & 2032
- Figure 6: North America Solid State Drive For Client Volume Share (%), by Application 2024 & 2032
- Figure 7: North America Solid State Drive For Client Revenue (million), by Type 2024 & 2032
- Figure 8: North America Solid State Drive For Client Volume (K), by Type 2024 & 2032
- Figure 9: North America Solid State Drive For Client Revenue Share (%), by Type 2024 & 2032
- Figure 10: North America Solid State Drive For Client Volume Share (%), by Type 2024 & 2032
- Figure 11: North America Solid State Drive For Client Revenue (million), by Country 2024 & 2032
- Figure 12: North America Solid State Drive For Client Volume (K), by Country 2024 & 2032
- Figure 13: North America Solid State Drive For Client Revenue Share (%), by Country 2024 & 2032
- Figure 14: North America Solid State Drive For Client Volume Share (%), by Country 2024 & 2032
- Figure 15: South America Solid State Drive For Client Revenue (million), by Application 2024 & 2032
- Figure 16: South America Solid State Drive For Client Volume (K), by Application 2024 & 2032
- Figure 17: South America Solid State Drive For Client Revenue Share (%), by Application 2024 & 2032
- Figure 18: South America Solid State Drive For Client Volume Share (%), by Application 2024 & 2032
- Figure 19: South America Solid State Drive For Client Revenue (million), by Type 2024 & 2032
- Figure 20: South America Solid State Drive For Client Volume (K), by Type 2024 & 2032
- Figure 21: South America Solid State Drive For Client Revenue Share (%), by Type 2024 & 2032
- Figure 22: South America Solid State Drive For Client Volume Share (%), by Type 2024 & 2032
- Figure 23: South America Solid State Drive For Client Revenue (million), by Country 2024 & 2032
- Figure 24: South America Solid State Drive For Client Volume (K), by Country 2024 & 2032
- Figure 25: South America Solid State Drive For Client Revenue Share (%), by Country 2024 & 2032
- Figure 26: South America Solid State Drive For Client Volume Share (%), by Country 2024 & 2032
- Figure 27: Europe Solid State Drive For Client Revenue (million), by Application 2024 & 2032
- Figure 28: Europe Solid State Drive For Client Volume (K), by Application 2024 & 2032
- Figure 29: Europe Solid State Drive For Client Revenue Share (%), by Application 2024 & 2032
- Figure 30: Europe Solid State Drive For Client Volume Share (%), by Application 2024 & 2032
- Figure 31: Europe Solid State Drive For Client Revenue (million), by Type 2024 & 2032
- Figure 32: Europe Solid State Drive For Client Volume (K), by Type 2024 & 2032
- Figure 33: Europe Solid State Drive For Client Revenue Share (%), by Type 2024 & 2032
- Figure 34: Europe Solid State Drive For Client Volume Share (%), by Type 2024 & 2032
- Figure 35: Europe Solid State Drive For Client Revenue (million), by Country 2024 & 2032
- Figure 36: Europe Solid State Drive For Client Volume (K), by Country 2024 & 2032
- Figure 37: Europe Solid State Drive For Client Revenue Share (%), by Country 2024 & 2032
- Figure 38: Europe Solid State Drive For Client Volume Share (%), by Country 2024 & 2032
- Figure 39: Middle East & Africa Solid State Drive For Client Revenue (million), by Application 2024 & 2032
- Figure 40: Middle East & Africa Solid State Drive For Client Volume (K), by Application 2024 & 2032
- Figure 41: Middle East & Africa Solid State Drive For Client Revenue Share (%), by Application 2024 & 2032
- Figure 42: Middle East & Africa Solid State Drive For Client Volume Share (%), by Application 2024 & 2032
- Figure 43: Middle East & Africa Solid State Drive For Client Revenue (million), by Type 2024 & 2032
- Figure 44: Middle East & Africa Solid State Drive For Client Volume (K), by Type 2024 & 2032
- Figure 45: Middle East & Africa Solid State Drive For Client Revenue Share (%), by Type 2024 & 2032
- Figure 46: Middle East & Africa Solid State Drive For Client Volume Share (%), by Type 2024 & 2032
- Figure 47: Middle East & Africa Solid State Drive For Client Revenue (million), by Country 2024 & 2032
- Figure 48: Middle East & Africa Solid State Drive For Client Volume (K), by Country 2024 & 2032
- Figure 49: Middle East & Africa Solid State Drive For Client Revenue Share (%), by Country 2024 & 2032
- Figure 50: Middle East & Africa Solid State Drive For Client Volume Share (%), by Country 2024 & 2032
- Figure 51: Asia Pacific Solid State Drive For Client Revenue (million), by Application 2024 & 2032
- Figure 52: Asia Pacific Solid State Drive For Client Volume (K), by Application 2024 & 2032
- Figure 53: Asia Pacific Solid State Drive For Client Revenue Share (%), by Application 2024 & 2032
- Figure 54: Asia Pacific Solid State Drive For Client Volume Share (%), by Application 2024 & 2032
- Figure 55: Asia Pacific Solid State Drive For Client Revenue (million), by Type 2024 & 2032
- Figure 56: Asia Pacific Solid State Drive For Client Volume (K), by Type 2024 & 2032
- Figure 57: Asia Pacific Solid State Drive For Client Revenue Share (%), by Type 2024 & 2032
- Figure 58: Asia Pacific Solid State Drive For Client Volume Share (%), by Type 2024 & 2032
- Figure 59: Asia Pacific Solid State Drive For Client Revenue (million), by Country 2024 & 2032
- Figure 60: Asia Pacific Solid State Drive For Client Volume (K), by Country 2024 & 2032
- Figure 61: Asia Pacific Solid State Drive For Client Revenue Share (%), by Country 2024 & 2032
- Figure 62: Asia Pacific Solid State Drive For Client Volume Share (%), by Country 2024 & 2032
List of Tables
- Table 1: Global Solid State Drive For Client Revenue million Forecast, by Region 2019 & 2032
- Table 2: Global Solid State Drive For Client Volume K Forecast, by Region 2019 & 2032
- Table 3: Global Solid State Drive For Client Revenue million Forecast, by Application 2019 & 2032
- Table 4: Global Solid State Drive For Client Volume K Forecast, by Application 2019 & 2032
- Table 5: Global Solid State Drive For Client Revenue million Forecast, by Type 2019 & 2032
- Table 6: Global Solid State Drive For Client Volume K Forecast, by Type 2019 & 2032
- Table 7: Global Solid State Drive For Client Revenue million Forecast, by Region 2019 & 2032
- Table 8: Global Solid State Drive For Client Volume K Forecast, by Region 2019 & 2032
- Table 9: Global Solid State Drive For Client Revenue million Forecast, by Application 2019 & 2032
- Table 10: Global Solid State Drive For Client Volume K Forecast, by Application 2019 & 2032
- Table 11: Global Solid State Drive For Client Revenue million Forecast, by Type 2019 & 2032
- Table 12: Global Solid State Drive For Client Volume K Forecast, by Type 2019 & 2032
- Table 13: Global Solid State Drive For Client Revenue million Forecast, by Country 2019 & 2032
- Table 14: Global Solid State Drive For Client Volume K Forecast, by Country 2019 & 2032
- Table 15: United States Solid State Drive For Client Revenue (million) Forecast, by Application 2019 & 2032
- Table 16: United States Solid State Drive For Client Volume (K) Forecast, by Application 2019 & 2032
- Table 17: Canada Solid State Drive For Client Revenue (million) Forecast, by Application 2019 & 2032
- Table 18: Canada Solid State Drive For Client Volume (K) Forecast, by Application 2019 & 2032
- Table 19: Mexico Solid State Drive For Client Revenue (million) Forecast, by Application 2019 & 2032
- Table 20: Mexico Solid State Drive For Client Volume (K) Forecast, by Application 2019 & 2032
- Table 21: Global Solid State Drive For Client Revenue million Forecast, by Application 2019 & 2032
- Table 22: Global Solid State Drive For Client Volume K Forecast, by Application 2019 & 2032
- Table 23: Global Solid State Drive For Client Revenue million Forecast, by Type 2019 & 2032
- Table 24: Global Solid State Drive For Client Volume K Forecast, by Type 2019 & 2032
- Table 25: Global Solid State Drive For Client Revenue million Forecast, by Country 2019 & 2032
- Table 26: Global Solid State Drive For Client Volume K Forecast, by Country 2019 & 2032
- Table 27: Brazil Solid State Drive For Client Revenue (million) Forecast, by Application 2019 & 2032
- Table 28: Brazil Solid State Drive For Client Volume (K) Forecast, by Application 2019 & 2032
- Table 29: Argentina Solid State Drive For Client Revenue (million) Forecast, by Application 2019 & 2032
- Table 30: Argentina Solid State Drive For Client Volume (K) Forecast, by Application 2019 & 2032
- Table 31: Rest of South America Solid State Drive For Client Revenue (million) Forecast, by Application 2019 & 2032
- Table 32: Rest of South America Solid State Drive For Client Volume (K) Forecast, by Application 2019 & 2032
- Table 33: Global Solid State Drive For Client Revenue million Forecast, by Application 2019 & 2032
- Table 34: Global Solid State Drive For Client Volume K Forecast, by Application 2019 & 2032
- Table 35: Global Solid State Drive For Client Revenue million Forecast, by Type 2019 & 2032
- Table 36: Global Solid State Drive For Client Volume K Forecast, by Type 2019 & 2032
- Table 37: Global Solid State Drive For Client Revenue million Forecast, by Country 2019 & 2032
- Table 38: Global Solid State Drive For Client Volume K Forecast, by Country 2019 & 2032
- Table 39: United Kingdom Solid State Drive For Client Revenue (million) Forecast, by Application 2019 & 2032
- Table 40: United Kingdom Solid State Drive For Client Volume (K) Forecast, by Application 2019 & 2032
- Table 41: Germany Solid State Drive For Client Revenue (million) Forecast, by Application 2019 & 2032
- Table 42: Germany Solid State Drive For Client Volume (K) Forecast, by Application 2019 & 2032
- Table 43: France Solid State Drive For Client Revenue (million) Forecast, by Application 2019 & 2032
- Table 44: France Solid State Drive For Client Volume (K) Forecast, by Application 2019 & 2032
- Table 45: Italy Solid State Drive For Client Revenue (million) Forecast, by Application 2019 & 2032
- Table 46: Italy Solid State Drive For Client Volume (K) Forecast, by Application 2019 & 2032
- Table 47: Spain Solid State Drive For Client Revenue (million) Forecast, by Application 2019 & 2032
- Table 48: Spain Solid State Drive For Client Volume (K) Forecast, by Application 2019 & 2032
- Table 49: Russia Solid State Drive For Client Revenue (million) Forecast, by Application 2019 & 2032
- Table 50: Russia Solid State Drive For Client Volume (K) Forecast, by Application 2019 & 2032
- Table 51: Benelux Solid State Drive For Client Revenue (million) Forecast, by Application 2019 & 2032
- Table 52: Benelux Solid State Drive For Client Volume (K) Forecast, by Application 2019 & 2032
- Table 53: Nordics Solid State Drive For Client Revenue (million) Forecast, by Application 2019 & 2032
- Table 54: Nordics Solid State Drive For Client Volume (K) Forecast, by Application 2019 & 2032
- Table 55: Rest of Europe Solid State Drive For Client Revenue (million) Forecast, by Application 2019 & 2032
- Table 56: Rest of Europe Solid State Drive For Client Volume (K) Forecast, by Application 2019 & 2032
- Table 57: Global Solid State Drive For Client Revenue million Forecast, by Application 2019 & 2032
- Table 58: Global Solid State Drive For Client Volume K Forecast, by Application 2019 & 2032
- Table 59: Global Solid State Drive For Client Revenue million Forecast, by Type 2019 & 2032
- Table 60: Global Solid State Drive For Client Volume K Forecast, by Type 2019 & 2032
- Table 61: Global Solid State Drive For Client Revenue million Forecast, by Country 2019 & 2032
- Table 62: Global Solid State Drive For Client Volume K Forecast, by Country 2019 & 2032
- Table 63: Turkey Solid State Drive For Client Revenue (million) Forecast, by Application 2019 & 2032
- Table 64: Turkey Solid State Drive For Client Volume (K) Forecast, by Application 2019 & 2032
- Table 65: Israel Solid State Drive For Client Revenue (million) Forecast, by Application 2019 & 2032
- Table 66: Israel Solid State Drive For Client Volume (K) Forecast, by Application 2019 & 2032
- Table 67: GCC Solid State Drive For Client Revenue (million) Forecast, by Application 2019 & 2032
- Table 68: GCC Solid State Drive For Client Volume (K) Forecast, by Application 2019 & 2032
- Table 69: North Africa Solid State Drive For Client Revenue (million) Forecast, by Application 2019 & 2032
- Table 70: North Africa Solid State Drive For Client Volume (K) Forecast, by Application 2019 & 2032
- Table 71: South Africa Solid State Drive For Client Revenue (million) Forecast, by Application 2019 & 2032
- Table 72: South Africa Solid State Drive For Client Volume (K) Forecast, by Application 2019 & 2032
- Table 73: Rest of Middle East & Africa Solid State Drive For Client Revenue (million) Forecast, by Application 2019 & 2032
- Table 74: Rest of Middle East & Africa Solid State Drive For Client Volume (K) Forecast, by Application 2019 & 2032
- Table 75: Global Solid State Drive For Client Revenue million Forecast, by Application 2019 & 2032
- Table 76: Global Solid State Drive For Client Volume K Forecast, by Application 2019 & 2032
- Table 77: Global Solid State Drive For Client Revenue million Forecast, by Type 2019 & 2032
- Table 78: Global Solid State Drive For Client Volume K Forecast, by Type 2019 & 2032
- Table 79: Global Solid State Drive For Client Revenue million Forecast, by Country 2019 & 2032
- Table 80: Global Solid State Drive For Client Volume K Forecast, by Country 2019 & 2032
- Table 81: China Solid State Drive For Client Revenue (million) Forecast, by Application 2019 & 2032
- Table 82: China Solid State Drive For Client Volume (K) Forecast, by Application 2019 & 2032
- Table 83: India Solid State Drive For Client Revenue (million) Forecast, by Application 2019 & 2032
- Table 84: India Solid State Drive For Client Volume (K) Forecast, by Application 2019 & 2032
- Table 85: Japan Solid State Drive For Client Revenue (million) Forecast, by Application 2019 & 2032
- Table 86: Japan Solid State Drive For Client Volume (K) Forecast, by Application 2019 & 2032
- Table 87: South Korea Solid State Drive For Client Revenue (million) Forecast, by Application 2019 & 2032
- Table 88: South Korea Solid State Drive For Client Volume (K) Forecast, by Application 2019 & 2032
- Table 89: ASEAN Solid State Drive For Client Revenue (million) Forecast, by Application 2019 & 2032
- Table 90: ASEAN Solid State Drive For Client Volume (K) Forecast, by Application 2019 & 2032
- Table 91: Oceania Solid State Drive For Client Revenue (million) Forecast, by Application 2019 & 2032
- Table 92: Oceania Solid State Drive For Client Volume (K) Forecast, by Application 2019 & 2032
- Table 93: Rest of Asia Pacific Solid State Drive For Client Revenue (million) Forecast, by Application 2019 & 2032
- Table 94: Rest of Asia Pacific Solid State Drive For Client Volume (K) Forecast, by Application 2019 & 2032
Frequently Asked Questions
1. What is the projected Compound Annual Growth Rate (CAGR) of the Solid State Drive For Client?
The projected CAGR is approximately XXX%.
2. Which companies are prominent players in the Solid State Drive For Client?
Key companies in the market include Samsung, SK Hynix, Kingston, Intel, Western Digital (SanDisk), Kimtigo, Seagate, Kioxia (Lite-On), Netac Technology, Micron (Crucial), Clolorful, Powev, HP, Transcend, GIGABYTE, Teclast, Lenovo, ADATA Technology, Shenzhen Longsys (Lexar).
3. What are the main segments of the Solid State Drive For Client?
The market segments include Application, Type.
4. Can you provide details about the market size?
The market size is estimated to be USD XXX million as of 2022.
5. What are some drivers contributing to market growth?
N/A
6. What are the notable trends driving market growth?
N/A
7. Are there any restraints impacting market growth?
N/A
8. Can you provide examples of recent developments in the market?
N/A
9. What pricing options are available for accessing the report?
Pricing options include single-user, multi-user, and enterprise licenses priced at USD 3950.00, USD 5925.00, and USD 7900.00 respectively.
10. Is the market size provided in terms of value or volume?
The market size is provided in terms of value, measured in million and volume, measured in K.
11. Are there any specific market keywords associated with the report?
Yes, the market keyword associated with the report is "Solid State Drive For Client," which aids in identifying and referencing the specific market segment covered.
12. How do I determine which pricing option suits my needs best?
The pricing options vary based on user requirements and access needs. Individual users may opt for single-user licenses, while businesses requiring broader access may choose multi-user or enterprise licenses for cost-effective access to the report.
13. Are there any additional resources or data provided in the Solid State Drive For Client report?
While the report offers comprehensive insights, it's advisable to review the specific contents or supplementary materials provided to ascertain if additional resources or data are available.
14. How can I stay updated on further developments or reports in the Solid State Drive For Client?
To stay informed about further developments, trends, and reports in the Solid State Drive For Client, consider subscribing to industry newsletters, following relevant companies and organizations, or regularly checking reputable industry news sources and publications.
Methodology
Step 1 - Identification of Relevant Samples Size from Population Database


Step 2 - Approaches for Defining Global Market Size (Value, Volume* & Price*)

Note*: In applicable scenarios
Step 3 - Data Sources
Primary Research
- Web Analytics
- Survey Reports
- Research Institute
- Latest Research Reports
- Opinion Leaders
Secondary Research
- Annual Reports
- White Paper
- Latest Press Release
- Industry Association
- Paid Database
- Investor Presentations

Step 4 - Data Triangulation
Involves using different sources of information in order to increase the validity of a study
These sources are likely to be stakeholders in a program - participants, other researchers, program staff, other community members, and so on.
Then we put all data in single framework & apply various statistical tools to find out the dynamic on the market.
During the analysis stage, feedback from the stakeholder groups would be compared to determine areas of agreement as well as areas of divergence
