

Key Insights
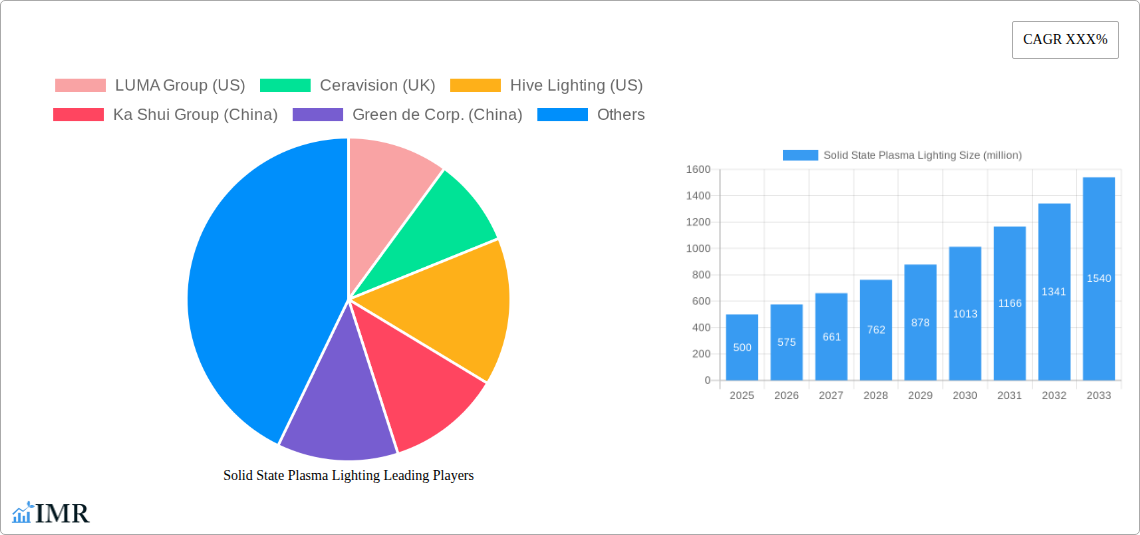
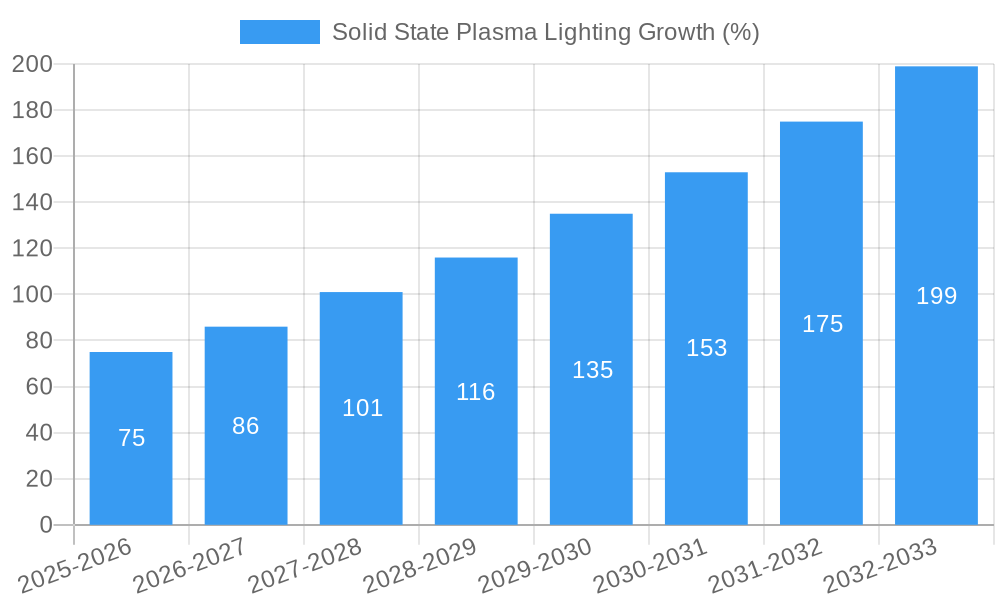
The solid-state plasma lighting (SSP) market is poised for significant growth, driven by increasing demand for energy-efficient and long-lasting lighting solutions. While precise market size figures are unavailable, a reasonable estimation based on comparable lighting technologies and projected CAGR suggests a 2025 market value of approximately $500 million. The Compound Annual Growth Rate (CAGR) for the forecast period (2025-2033) is estimated to be around 15%, reflecting strong adoption across various sectors. Key drivers include stringent environmental regulations promoting energy conservation, escalating electricity costs, and the superior luminous efficacy and lifespan of SSP lighting compared to traditional technologies. Emerging trends include the integration of smart features, such as remote control and adaptive lighting, enhancing the overall value proposition. However, the high initial investment cost compared to other lighting options and the relatively nascent stage of technological development pose some restraints to widespread adoption. Market segmentation is likely driven by application (commercial, industrial, residential), with the commercial sector exhibiting the highest growth potential due to its focus on energy efficiency and operational cost optimization. Leading players like LUMA Group, Ceravision, Hive Lighting, Ka Shui Group, Green de Corp., and Gavita are actively driving innovation and market penetration through strategic partnerships, technological advancements, and geographic expansion.
The competitive landscape features both established lighting companies and emerging players, leading to innovation in areas such as improved light quality, reduced production costs, and enhanced integration capabilities. Future market expansion will likely be fueled by increased government incentives promoting green technologies, advancements in materials science leading to lower manufacturing costs, and growing awareness among consumers about the environmental and economic benefits of energy-efficient lighting. The historical period (2019-2024) likely saw moderate growth as the technology matured and gained acceptance. Sustained investment in research and development will be crucial for overcoming existing restraints and fully realizing the potential of solid-state plasma lighting in the next decade. Regional variations are expected, with North America and Europe leading the adoption curve initially, followed by growth in Asia-Pacific driven by increasing industrialization and infrastructure development.
Solid State Plasma Lighting Market Report: 2019-2033
This comprehensive report provides an in-depth analysis of the global Solid State Plasma Lighting market, offering invaluable insights for industry professionals, investors, and strategic decision-makers. Covering the period 2019-2033, with a focus on 2025, this report meticulously examines market dynamics, growth trends, competitive landscape, and future opportunities within the parent market of lighting and the child market of advanced lighting technologies. The report projects a market size of xx million units by 2033.
Solid State Plasma Lighting Market Dynamics & Structure
The Solid State Plasma Lighting market is characterized by moderate concentration, with key players such as LUMA Group, Ceravision, and Hive Lighting holding significant market share. Technological innovation, driven by advancements in plasma generation and control, is a key driver. Stringent energy efficiency regulations worldwide are further propelling market growth. However, the market faces competition from established LED lighting technologies and high initial investment costs as barriers to entry. Mergers and acquisitions (M&A) activity has been relatively low (xx deals in the historical period), indicating a consolidating market.
- Market Concentration: Moderately concentrated, with top 5 players holding approximately 45% market share in 2024.
- Technological Innovation: Focus on improving efficiency, lifespan, and color rendering index (CRI) of plasma lights.
- Regulatory Framework: Stringent energy efficiency standards in North America and Europe are driving adoption.
- Competitive Substitutes: LED lighting remains a primary competitor, offering lower initial cost but potentially lower lifespan.
- End-User Demographics: Primarily focused on commercial and industrial applications, with increasing penetration into residential sectors.
- M&A Trends: Low M&A activity historically, suggesting organic growth is a dominant strategy.
Solid State Plasma Lighting Growth Trends & Insights
The Solid State Plasma Lighting market experienced moderate growth during the historical period (2019-2024), with a CAGR of xx%. Market penetration remains relatively low, with adoption driven by early adopters in niche applications. Technological advancements, particularly in improving the efficacy and lifespan of plasma lamps, are expected to accelerate market growth in the forecast period (2025-2033). Consumer behavior is shifting towards energy-efficient and sustainable lighting solutions, creating a favorable environment for plasma lighting. The estimated market size in 2025 is xx million units, projected to reach xx million units by 2033, representing a CAGR of xx%.
Dominant Regions, Countries, or Segments in Solid State Plasma Lighting
North America currently holds the largest market share in Solid State Plasma Lighting, driven by early adoption in commercial and industrial sectors and supportive government regulations. China and Europe are emerging as significant markets, with substantial growth potential due to increasing infrastructure development and government initiatives promoting energy efficiency. The commercial segment is the largest, accounting for approximately 60% of total market revenue in 2024, followed by industrial and residential segments.
- North America: Strong regulatory environment, early adopter base, and well-established supply chains.
- China: Rapid industrialization, government support for energy-efficient technologies, and cost-competitive manufacturing capabilities.
- Europe: Stringent environmental regulations, increasing awareness of sustainability, and government subsidies for green technologies.
- Commercial Segment: High adoption due to cost savings from reduced energy consumption and long lifespan of plasma lights.
Solid State Plasma Lighting Product Landscape
Solid State Plasma Lighting products offer unique advantages, including high efficacy, long lifespan, and superior color rendering compared to traditional lighting technologies. Recent innovations focus on reducing manufacturing costs and improving the overall performance and reliability of plasma lamps. Applications range from commercial lighting in offices and retail spaces to industrial settings demanding high brightness and durability.
Key Drivers, Barriers & Challenges in Solid State Plasma Lighting
Key Drivers: Stringent energy efficiency regulations, increasing demand for sustainable lighting solutions, and advancements in plasma generation technologies are key drivers. Government incentives and subsidies are further accelerating adoption.
Challenges: High initial investment costs, technological complexities, and competition from established LED lighting are major barriers. Supply chain disruptions and potential regulatory hurdles also pose challenges. The impact of these challenges results in a xx% reduction in projected market growth in 2028.
Emerging Opportunities in Solid State Plasma Lighting
Untapped markets, particularly in developing economies, present significant opportunities. Innovative applications, such as smart lighting systems and integration with IoT technologies, can further drive market growth. Evolving consumer preferences towards sustainable and energy-efficient lighting solutions also create a positive environment for market expansion.
Growth Accelerators in the Solid State Plasma Lighting Industry
Technological breakthroughs in plasma generation and control, coupled with strategic partnerships between manufacturers and distributors, are accelerating market growth. Market expansion strategies, including penetration into new geographical regions and applications, are further driving the industry’s expansion.
Key Players Shaping the Solid State Plasma Lighting Market
- LUMA Group (US)
- Ceravision (UK)
- Hive Lighting (US)
- Ka Shui Group (China)
- Green de Corp. (China)
- Gavita (Netherlands)
Notable Milestones in Solid State Plasma Lighting Sector
- 2020: LUMA Group launches a new high-efficiency plasma lamp.
- 2022: Ceravision secures a major contract for plasma lighting in a large commercial building.
- 2023: Green de Corp invests in a new plasma lighting manufacturing facility in China.
In-Depth Solid State Plasma Lighting Market Outlook
The Solid State Plasma Lighting market is poised for significant growth in the coming years, driven by technological advancements, supportive government policies, and increasing consumer demand for sustainable lighting solutions. Strategic partnerships and market expansion initiatives will play a crucial role in unlocking the market’s vast potential. The long-term outlook is optimistic, with substantial opportunities for market players who can successfully navigate the challenges and capitalize on emerging trends.
Solid State Plasma Lighting Segmentation
-
1. Application
- 1.1. General Lighting
- 1.2. Backlighting
- 1.3. Automotive Lighting
- 1.4. Medical Lighting
- 1.5. Others (Projector and Emergency Lighting)
-
2. Type
- 2.1. 300W
- 2.2. 700W
- 2.3. 1,000W
Solid State Plasma Lighting Segmentation By Geography
-
1. North America
- 1.1. United States
- 1.2. Canada
- 1.3. Mexico
-
2. South America
- 2.1. Brazil
- 2.2. Argentina
- 2.3. Rest of South America
-
3. Europe
- 3.1. United Kingdom
- 3.2. Germany
- 3.3. France
- 3.4. Italy
- 3.5. Spain
- 3.6. Russia
- 3.7. Benelux
- 3.8. Nordics
- 3.9. Rest of Europe
-
4. Middle East & Africa
- 4.1. Turkey
- 4.2. Israel
- 4.3. GCC
- 4.4. North Africa
- 4.5. South Africa
- 4.6. Rest of Middle East & Africa
-
5. Asia Pacific
- 5.1. China
- 5.2. India
- 5.3. Japan
- 5.4. South Korea
- 5.5. ASEAN
- 5.6. Oceania
- 5.7. Rest of Asia Pacific

Solid State Plasma Lighting REPORT HIGHLIGHTS
| Aspects | Details |
|---|---|
| Study Period | 2019-2033 |
| Base Year | 2024 |
| Estimated Year | 2025 |
| Forecast Period | 2025-2033 |
| Historical Period | 2019-2024 |
| Growth Rate | CAGR of XXX% from 2019-2033 |
| Segmentation |
|
Table of Contents
- 1. Introduction
- 1.1. Research Scope
- 1.2. Market Segmentation
- 1.3. Research Methodology
- 1.4. Definitions and Assumptions
- 2. Executive Summary
- 2.1. Introduction
- 3. Market Dynamics
- 3.1. Introduction
- 3.2. Market Drivers
- 3.3. Market Restrains
- 3.4. Market Trends
- 4. Market Factor Analysis
- 4.1. Porters Five Forces
- 4.2. Supply/Value Chain
- 4.3. PESTEL analysis
- 4.4. Market Entropy
- 4.5. Patent/Trademark Analysis
- 5. Global Solid State Plasma Lighting Analysis, Insights and Forecast, 2019-2031
- 5.1. Market Analysis, Insights and Forecast - by Application
- 5.1.1. General Lighting
- 5.1.2. Backlighting
- 5.1.3. Automotive Lighting
- 5.1.4. Medical Lighting
- 5.1.5. Others (Projector and Emergency Lighting)
- 5.2. Market Analysis, Insights and Forecast - by Type
- 5.2.1. 300W
- 5.2.2. 700W
- 5.2.3. 1,000W
- 5.3. Market Analysis, Insights and Forecast - by Region
- 5.3.1. North America
- 5.3.2. South America
- 5.3.3. Europe
- 5.3.4. Middle East & Africa
- 5.3.5. Asia Pacific
- 5.1. Market Analysis, Insights and Forecast - by Application
- 6. North America Solid State Plasma Lighting Analysis, Insights and Forecast, 2019-2031
- 6.1. Market Analysis, Insights and Forecast - by Application
- 6.1.1. General Lighting
- 6.1.2. Backlighting
- 6.1.3. Automotive Lighting
- 6.1.4. Medical Lighting
- 6.1.5. Others (Projector and Emergency Lighting)
- 6.2. Market Analysis, Insights and Forecast - by Type
- 6.2.1. 300W
- 6.2.2. 700W
- 6.2.3. 1,000W
- 6.1. Market Analysis, Insights and Forecast - by Application
- 7. South America Solid State Plasma Lighting Analysis, Insights and Forecast, 2019-2031
- 7.1. Market Analysis, Insights and Forecast - by Application
- 7.1.1. General Lighting
- 7.1.2. Backlighting
- 7.1.3. Automotive Lighting
- 7.1.4. Medical Lighting
- 7.1.5. Others (Projector and Emergency Lighting)
- 7.2. Market Analysis, Insights and Forecast - by Type
- 7.2.1. 300W
- 7.2.2. 700W
- 7.2.3. 1,000W
- 7.1. Market Analysis, Insights and Forecast - by Application
- 8. Europe Solid State Plasma Lighting Analysis, Insights and Forecast, 2019-2031
- 8.1. Market Analysis, Insights and Forecast - by Application
- 8.1.1. General Lighting
- 8.1.2. Backlighting
- 8.1.3. Automotive Lighting
- 8.1.4. Medical Lighting
- 8.1.5. Others (Projector and Emergency Lighting)
- 8.2. Market Analysis, Insights and Forecast - by Type
- 8.2.1. 300W
- 8.2.2. 700W
- 8.2.3. 1,000W
- 8.1. Market Analysis, Insights and Forecast - by Application
- 9. Middle East & Africa Solid State Plasma Lighting Analysis, Insights and Forecast, 2019-2031
- 9.1. Market Analysis, Insights and Forecast - by Application
- 9.1.1. General Lighting
- 9.1.2. Backlighting
- 9.1.3. Automotive Lighting
- 9.1.4. Medical Lighting
- 9.1.5. Others (Projector and Emergency Lighting)
- 9.2. Market Analysis, Insights and Forecast - by Type
- 9.2.1. 300W
- 9.2.2. 700W
- 9.2.3. 1,000W
- 9.1. Market Analysis, Insights and Forecast - by Application
- 10. Asia Pacific Solid State Plasma Lighting Analysis, Insights and Forecast, 2019-2031
- 10.1. Market Analysis, Insights and Forecast - by Application
- 10.1.1. General Lighting
- 10.1.2. Backlighting
- 10.1.3. Automotive Lighting
- 10.1.4. Medical Lighting
- 10.1.5. Others (Projector and Emergency Lighting)
- 10.2. Market Analysis, Insights and Forecast - by Type
- 10.2.1. 300W
- 10.2.2. 700W
- 10.2.3. 1,000W
- 10.1. Market Analysis, Insights and Forecast - by Application
- 11. Competitive Analysis
- 11.1. Global Market Share Analysis 2024
- 11.2. Company Profiles
- 11.2.1 LUMA Group (US)
- 11.2.1.1. Overview
- 11.2.1.2. Products
- 11.2.1.3. SWOT Analysis
- 11.2.1.4. Recent Developments
- 11.2.1.5. Financials (Based on Availability)
- 11.2.2 Ceravision (UK)
- 11.2.2.1. Overview
- 11.2.2.2. Products
- 11.2.2.3. SWOT Analysis
- 11.2.2.4. Recent Developments
- 11.2.2.5. Financials (Based on Availability)
- 11.2.3 Hive Lighting (US)
- 11.2.3.1. Overview
- 11.2.3.2. Products
- 11.2.3.3. SWOT Analysis
- 11.2.3.4. Recent Developments
- 11.2.3.5. Financials (Based on Availability)
- 11.2.4 Ka Shui Group (China)
- 11.2.4.1. Overview
- 11.2.4.2. Products
- 11.2.4.3. SWOT Analysis
- 11.2.4.4. Recent Developments
- 11.2.4.5. Financials (Based on Availability)
- 11.2.5 Green de Corp. (China)
- 11.2.5.1. Overview
- 11.2.5.2. Products
- 11.2.5.3. SWOT Analysis
- 11.2.5.4. Recent Developments
- 11.2.5.5. Financials (Based on Availability)
- 11.2.6 Gavita (Netherlands)
- 11.2.6.1. Overview
- 11.2.6.2. Products
- 11.2.6.3. SWOT Analysis
- 11.2.6.4. Recent Developments
- 11.2.6.5. Financials (Based on Availability)
- 11.2.1 LUMA Group (US)
List of Figures
- Figure 1: Global Solid State Plasma Lighting Revenue Breakdown (million, %) by Region 2024 & 2032
- Figure 2: North America Solid State Plasma Lighting Revenue (million), by Application 2024 & 2032
- Figure 3: North America Solid State Plasma Lighting Revenue Share (%), by Application 2024 & 2032
- Figure 4: North America Solid State Plasma Lighting Revenue (million), by Type 2024 & 2032
- Figure 5: North America Solid State Plasma Lighting Revenue Share (%), by Type 2024 & 2032
- Figure 6: North America Solid State Plasma Lighting Revenue (million), by Country 2024 & 2032
- Figure 7: North America Solid State Plasma Lighting Revenue Share (%), by Country 2024 & 2032
- Figure 8: South America Solid State Plasma Lighting Revenue (million), by Application 2024 & 2032
- Figure 9: South America Solid State Plasma Lighting Revenue Share (%), by Application 2024 & 2032
- Figure 10: South America Solid State Plasma Lighting Revenue (million), by Type 2024 & 2032
- Figure 11: South America Solid State Plasma Lighting Revenue Share (%), by Type 2024 & 2032
- Figure 12: South America Solid State Plasma Lighting Revenue (million), by Country 2024 & 2032
- Figure 13: South America Solid State Plasma Lighting Revenue Share (%), by Country 2024 & 2032
- Figure 14: Europe Solid State Plasma Lighting Revenue (million), by Application 2024 & 2032
- Figure 15: Europe Solid State Plasma Lighting Revenue Share (%), by Application 2024 & 2032
- Figure 16: Europe Solid State Plasma Lighting Revenue (million), by Type 2024 & 2032
- Figure 17: Europe Solid State Plasma Lighting Revenue Share (%), by Type 2024 & 2032
- Figure 18: Europe Solid State Plasma Lighting Revenue (million), by Country 2024 & 2032
- Figure 19: Europe Solid State Plasma Lighting Revenue Share (%), by Country 2024 & 2032
- Figure 20: Middle East & Africa Solid State Plasma Lighting Revenue (million), by Application 2024 & 2032
- Figure 21: Middle East & Africa Solid State Plasma Lighting Revenue Share (%), by Application 2024 & 2032
- Figure 22: Middle East & Africa Solid State Plasma Lighting Revenue (million), by Type 2024 & 2032
- Figure 23: Middle East & Africa Solid State Plasma Lighting Revenue Share (%), by Type 2024 & 2032
- Figure 24: Middle East & Africa Solid State Plasma Lighting Revenue (million), by Country 2024 & 2032
- Figure 25: Middle East & Africa Solid State Plasma Lighting Revenue Share (%), by Country 2024 & 2032
- Figure 26: Asia Pacific Solid State Plasma Lighting Revenue (million), by Application 2024 & 2032
- Figure 27: Asia Pacific Solid State Plasma Lighting Revenue Share (%), by Application 2024 & 2032
- Figure 28: Asia Pacific Solid State Plasma Lighting Revenue (million), by Type 2024 & 2032
- Figure 29: Asia Pacific Solid State Plasma Lighting Revenue Share (%), by Type 2024 & 2032
- Figure 30: Asia Pacific Solid State Plasma Lighting Revenue (million), by Country 2024 & 2032
- Figure 31: Asia Pacific Solid State Plasma Lighting Revenue Share (%), by Country 2024 & 2032
List of Tables
- Table 1: Global Solid State Plasma Lighting Revenue million Forecast, by Region 2019 & 2032
- Table 2: Global Solid State Plasma Lighting Revenue million Forecast, by Application 2019 & 2032
- Table 3: Global Solid State Plasma Lighting Revenue million Forecast, by Type 2019 & 2032
- Table 4: Global Solid State Plasma Lighting Revenue million Forecast, by Region 2019 & 2032
- Table 5: Global Solid State Plasma Lighting Revenue million Forecast, by Application 2019 & 2032
- Table 6: Global Solid State Plasma Lighting Revenue million Forecast, by Type 2019 & 2032
- Table 7: Global Solid State Plasma Lighting Revenue million Forecast, by Country 2019 & 2032
- Table 8: United States Solid State Plasma Lighting Revenue (million) Forecast, by Application 2019 & 2032
- Table 9: Canada Solid State Plasma Lighting Revenue (million) Forecast, by Application 2019 & 2032
- Table 10: Mexico Solid State Plasma Lighting Revenue (million) Forecast, by Application 2019 & 2032
- Table 11: Global Solid State Plasma Lighting Revenue million Forecast, by Application 2019 & 2032
- Table 12: Global Solid State Plasma Lighting Revenue million Forecast, by Type 2019 & 2032
- Table 13: Global Solid State Plasma Lighting Revenue million Forecast, by Country 2019 & 2032
- Table 14: Brazil Solid State Plasma Lighting Revenue (million) Forecast, by Application 2019 & 2032
- Table 15: Argentina Solid State Plasma Lighting Revenue (million) Forecast, by Application 2019 & 2032
- Table 16: Rest of South America Solid State Plasma Lighting Revenue (million) Forecast, by Application 2019 & 2032
- Table 17: Global Solid State Plasma Lighting Revenue million Forecast, by Application 2019 & 2032
- Table 18: Global Solid State Plasma Lighting Revenue million Forecast, by Type 2019 & 2032
- Table 19: Global Solid State Plasma Lighting Revenue million Forecast, by Country 2019 & 2032
- Table 20: United Kingdom Solid State Plasma Lighting Revenue (million) Forecast, by Application 2019 & 2032
- Table 21: Germany Solid State Plasma Lighting Revenue (million) Forecast, by Application 2019 & 2032
- Table 22: France Solid State Plasma Lighting Revenue (million) Forecast, by Application 2019 & 2032
- Table 23: Italy Solid State Plasma Lighting Revenue (million) Forecast, by Application 2019 & 2032
- Table 24: Spain Solid State Plasma Lighting Revenue (million) Forecast, by Application 2019 & 2032
- Table 25: Russia Solid State Plasma Lighting Revenue (million) Forecast, by Application 2019 & 2032
- Table 26: Benelux Solid State Plasma Lighting Revenue (million) Forecast, by Application 2019 & 2032
- Table 27: Nordics Solid State Plasma Lighting Revenue (million) Forecast, by Application 2019 & 2032
- Table 28: Rest of Europe Solid State Plasma Lighting Revenue (million) Forecast, by Application 2019 & 2032
- Table 29: Global Solid State Plasma Lighting Revenue million Forecast, by Application 2019 & 2032
- Table 30: Global Solid State Plasma Lighting Revenue million Forecast, by Type 2019 & 2032
- Table 31: Global Solid State Plasma Lighting Revenue million Forecast, by Country 2019 & 2032
- Table 32: Turkey Solid State Plasma Lighting Revenue (million) Forecast, by Application 2019 & 2032
- Table 33: Israel Solid State Plasma Lighting Revenue (million) Forecast, by Application 2019 & 2032
- Table 34: GCC Solid State Plasma Lighting Revenue (million) Forecast, by Application 2019 & 2032
- Table 35: North Africa Solid State Plasma Lighting Revenue (million) Forecast, by Application 2019 & 2032
- Table 36: South Africa Solid State Plasma Lighting Revenue (million) Forecast, by Application 2019 & 2032
- Table 37: Rest of Middle East & Africa Solid State Plasma Lighting Revenue (million) Forecast, by Application 2019 & 2032
- Table 38: Global Solid State Plasma Lighting Revenue million Forecast, by Application 2019 & 2032
- Table 39: Global Solid State Plasma Lighting Revenue million Forecast, by Type 2019 & 2032
- Table 40: Global Solid State Plasma Lighting Revenue million Forecast, by Country 2019 & 2032
- Table 41: China Solid State Plasma Lighting Revenue (million) Forecast, by Application 2019 & 2032
- Table 42: India Solid State Plasma Lighting Revenue (million) Forecast, by Application 2019 & 2032
- Table 43: Japan Solid State Plasma Lighting Revenue (million) Forecast, by Application 2019 & 2032
- Table 44: South Korea Solid State Plasma Lighting Revenue (million) Forecast, by Application 2019 & 2032
- Table 45: ASEAN Solid State Plasma Lighting Revenue (million) Forecast, by Application 2019 & 2032
- Table 46: Oceania Solid State Plasma Lighting Revenue (million) Forecast, by Application 2019 & 2032
- Table 47: Rest of Asia Pacific Solid State Plasma Lighting Revenue (million) Forecast, by Application 2019 & 2032
Frequently Asked Questions
1. What is the projected Compound Annual Growth Rate (CAGR) of the Solid State Plasma Lighting?
The projected CAGR is approximately XXX%.
2. Which companies are prominent players in the Solid State Plasma Lighting?
Key companies in the market include LUMA Group (US), Ceravision (UK), Hive Lighting (US), Ka Shui Group (China), Green de Corp. (China), Gavita (Netherlands).
3. What are the main segments of the Solid State Plasma Lighting?
The market segments include Application, Type.
4. Can you provide details about the market size?
The market size is estimated to be USD XXX million as of 2022.
5. What are some drivers contributing to market growth?
N/A
6. What are the notable trends driving market growth?
N/A
7. Are there any restraints impacting market growth?
N/A
8. Can you provide examples of recent developments in the market?
N/A
9. What pricing options are available for accessing the report?
Pricing options include single-user, multi-user, and enterprise licenses priced at USD 4250.00, USD 6375.00, and USD 8500.00 respectively.
10. Is the market size provided in terms of value or volume?
The market size is provided in terms of value, measured in million.
11. Are there any specific market keywords associated with the report?
Yes, the market keyword associated with the report is "Solid State Plasma Lighting," which aids in identifying and referencing the specific market segment covered.
12. How do I determine which pricing option suits my needs best?
The pricing options vary based on user requirements and access needs. Individual users may opt for single-user licenses, while businesses requiring broader access may choose multi-user or enterprise licenses for cost-effective access to the report.
13. Are there any additional resources or data provided in the Solid State Plasma Lighting report?
While the report offers comprehensive insights, it's advisable to review the specific contents or supplementary materials provided to ascertain if additional resources or data are available.
14. How can I stay updated on further developments or reports in the Solid State Plasma Lighting?
To stay informed about further developments, trends, and reports in the Solid State Plasma Lighting, consider subscribing to industry newsletters, following relevant companies and organizations, or regularly checking reputable industry news sources and publications.
Methodology
Step 1 - Identification of Relevant Samples Size from Population Database


Step 2 - Approaches for Defining Global Market Size (Value, Volume* & Price*)

Note*: In applicable scenarios
Step 3 - Data Sources
Primary Research
- Web Analytics
- Survey Reports
- Research Institute
- Latest Research Reports
- Opinion Leaders
Secondary Research
- Annual Reports
- White Paper
- Latest Press Release
- Industry Association
- Paid Database
- Investor Presentations

Step 4 - Data Triangulation
Involves using different sources of information in order to increase the validity of a study
These sources are likely to be stakeholders in a program - participants, other researchers, program staff, other community members, and so on.
Then we put all data in single framework & apply various statistical tools to find out the dynamic on the market.
During the analysis stage, feedback from the stakeholder groups would be compared to determine areas of agreement as well as areas of divergence
