

Key Insights
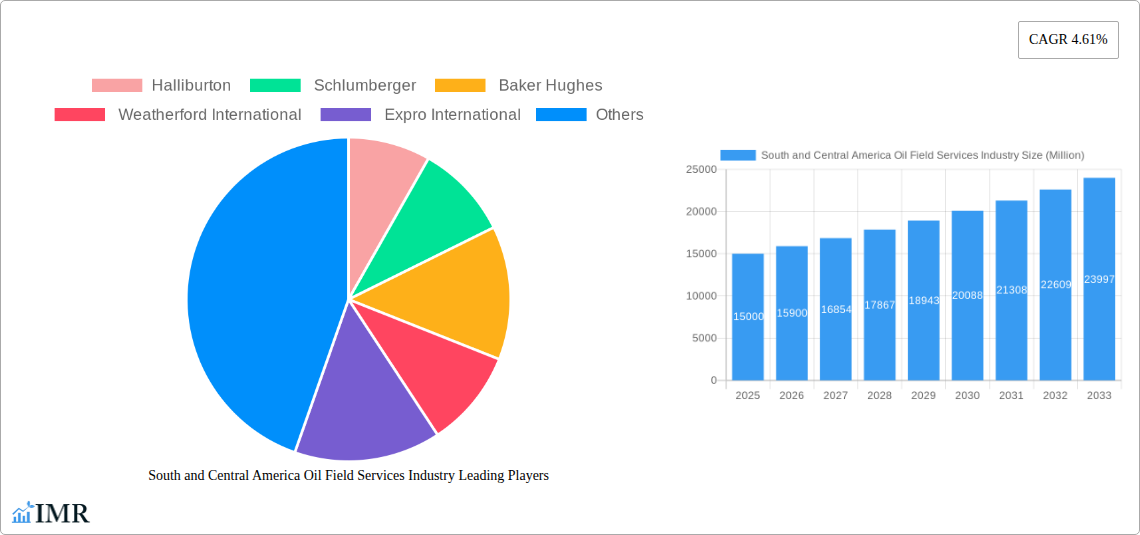
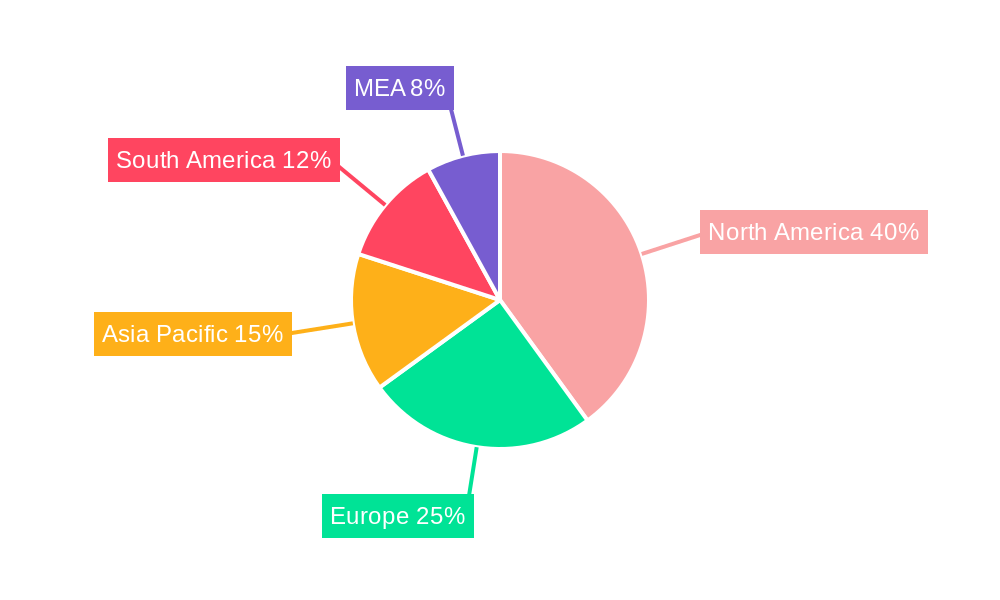
The South and Central American oil field services market, while smaller than its North American or European counterparts, presents a significant growth opportunity. Driven by ongoing exploration and production activities, particularly in Brazil and other key regions, the market is experiencing steady expansion. The region's considerable reserves of oil and gas, coupled with increasing investment in infrastructure development and modernization, fuel this growth. While the overall global CAGR is 4.61%, the South and Central American market likely exhibits a slightly higher growth rate, estimated between 5% and 6%, due to the region's untapped potential and government incentives promoting energy independence. This faster growth is, however, tempered by factors such as volatile oil prices, regulatory uncertainties in certain countries, and infrastructure limitations in some remote operating areas. The market is segmented primarily by service type (drilling, completion, production, etc.), with drilling and completion services representing the largest share, given the ongoing exploration and development projects. Key players such as Halliburton, Schlumberger, and Baker Hughes maintain a strong presence, leveraging their established expertise and technological advancements. However, the market also presents opportunities for smaller, specialized companies to cater to niche needs and localized requirements.
The competitive landscape is characterized by both international giants and regional players. International companies benefit from established technologies and global reach, but they may face challenges in adapting to local conditions. Regional players possess strong local knowledge and relationships but may lack the financial resources and technological capabilities of their international counterparts. Looking forward, the increasing adoption of digitalization and automation within oil field services is likely to shape the market's trajectory in South and Central America. This includes the implementation of data analytics, remote operations, and advanced drilling technologies, leading to increased efficiency and reduced operational costs. Further growth will depend on sustained investment in exploration and production, stable political environments, and a favorable regulatory framework that encourages foreign investment. The market's future trajectory will be significantly influenced by the ongoing transition towards cleaner energy sources, with the need for efficient and sustainable oil field service solutions becoming increasingly important.
South and Central America Oil Field Services Industry Market Report: 2019-2033
This comprehensive report provides an in-depth analysis of the South and Central America oil field services industry, offering invaluable insights for industry professionals, investors, and strategic decision-makers. Covering the period from 2019 to 2033, with a focus on 2025, this report meticulously examines market dynamics, growth trends, key players, and future opportunities. The report leverages proprietary data and expert analysis to deliver actionable intelligence across various segments, including drilling, completion, and production services.
South and Central America Oil Field Services Industry Market Dynamics & Structure
This section analyzes the competitive landscape, technological advancements, regulatory environment, and market trends within the South and Central America oil field services industry. The market is characterized by a moderately concentrated structure, with major players like Halliburton, Schlumberger, Baker Hughes, Weatherford International, and Expro International holding significant market share.
- Market Concentration: The top 5 players hold an estimated xx% market share in 2025. Consolidation through mergers and acquisitions (M&A) is expected to continue.
- Technological Innovation: Digitalization, automation, and enhanced oil recovery techniques are driving innovation, although high upfront investment costs pose a barrier for smaller players.
- Regulatory Framework: Varying regulations across countries impact operational costs and timelines. Harmonization efforts are underway but face significant challenges.
- Competitive Substitutes: Limited substitutes exist, but alternative energy sources and technological advancements present long-term competitive pressures.
- End-User Demographics: The primary end-users are national oil companies (NOCs) and international oil companies (IOCs) operating across the region.
- M&A Trends: An estimated xx M&A deals were recorded between 2019 and 2024, with a projected xx deals for 2025-2033, driven by economies of scale and technological integration.
South and Central America Oil Field Services Industry Growth Trends & Insights
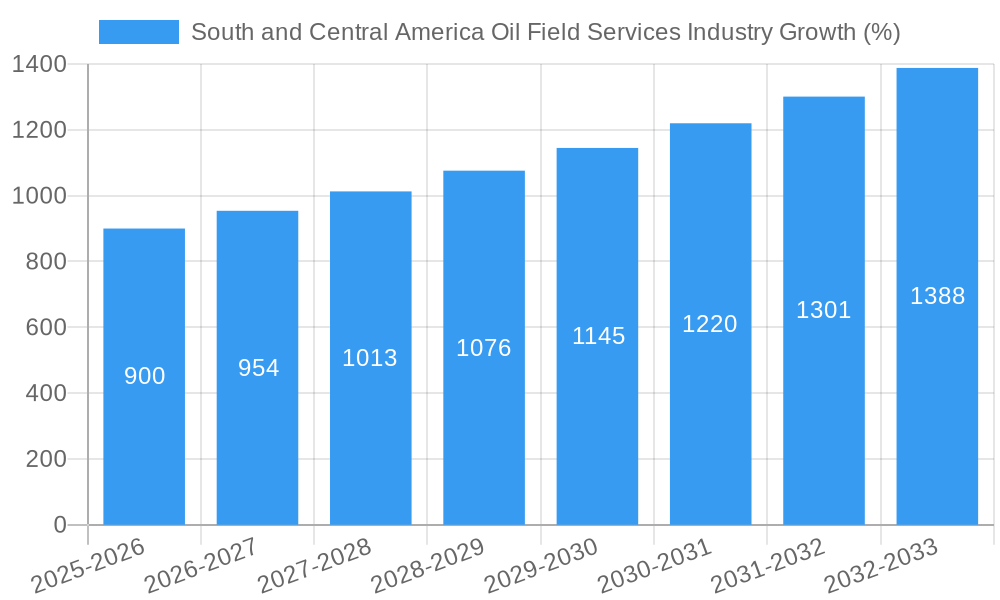
The South and Central America oil field services market is projected to experience significant growth during the forecast period (2025-2033). Driven by increasing oil and gas production, particularly in Brazil and Argentina, the market is expected to witness a Compound Annual Growth Rate (CAGR) of xx% from 2025 to 2033. This growth is further fueled by ongoing investments in exploration and production activities, supported by rising global energy demand and government initiatives to boost domestic energy independence. Technological advancements such as enhanced oil recovery techniques and digitalization are significantly contributing to improved efficiency and productivity, further stimulating market growth. Market penetration of advanced technologies is expected to reach xx% by 2033. Consumer behavior shifts are observed with increasing demand for environmentally friendly solutions and a growing emphasis on sustainable practices within the oil and gas sector.
Dominant Regions, Countries, or Segments in South and Central America Oil Field Services Industry
Brazil and Argentina are the dominant markets, representing xx% and xx% of the total market value in 2025, respectively. This dominance stems from substantial oil and gas reserves, significant investments in upstream activities, and favorable government policies. Within the segments (By Type), "Other Types" which includes specialized services like well testing and pipeline maintenance, is projected to have the highest growth rate due to the increasing demand for more efficient oil & gas extraction processes.
- Brazil: Large oil reserves, significant investments by Petrobras, and a supportive regulatory environment are key drivers.
- Argentina: Growing exploration and production activities, particularly in unconventional resources, are fueling market expansion.
- Other Types Segment: Increasing complexity of oil and gas operations, and need for specialized services is a major growth factor.
South and Central America Oil Field Services Industry Product Landscape
The oil field services market offers a diverse range of products, from drilling equipment and completion tools to specialized services like well testing and pipeline maintenance. Recent innovations focus on improving efficiency, reducing environmental impact, and enhancing safety. Digital technologies, including remote operations and predictive maintenance, are transforming operational practices. Unique selling propositions center around cost reduction, increased productivity, and improved safety standards.
Key Drivers, Barriers & Challenges in South and Central America Oil Field Services Industry
Key Drivers: Increased exploration and production activities driven by rising global energy demand; Government initiatives to boost domestic energy production; Technological advancements improving efficiency and productivity.
Challenges: Fluctuations in oil prices and global economic conditions; Regulatory uncertainties and bureaucratic hurdles; Supply chain disruptions affecting equipment availability and costs (xx% increase in equipment costs due to supply chain issues in 2024); Intense competition among service providers.
Emerging Opportunities in South and Central America Oil Field Services Industry
Untapped potential exists in unconventional resources, such as shale gas and tight oil; Growing demand for environmentally friendly solutions and sustainable practices presents opportunities; Adoption of advanced digital technologies like AI and IoT creates new service offerings.
Growth Accelerators in the South and Central America Oil Field Services Industry Industry
Technological breakthroughs in enhanced oil recovery and digitalization, Strategic partnerships between service providers and oil companies, Market expansion into previously unexplored regions, particularly in smaller South American countries.
Key Players Shaping the South and Central America Oil Field Services Market
Notable Milestones in South and Central America Oil Field Services Industry Sector
- November 2022: Petrobras awarded Diamond Offshore's Ocean Courage a four-year project valued at approximately USD 429 million in Brazil.
- February 2022: Archer secured a two-year contract extension in Argentina worth approximately USD 400 million for drilling services.
In-Depth South and Central America Oil Field Services Industry Market Outlook
The South and Central America oil field services market is poised for sustained growth driven by increasing energy demand, technological innovation, and government support. Strategic investments in digitalization, expansion into new markets, and focus on sustainable practices will be crucial for companies to capitalize on future opportunities and secure a dominant position in this dynamic market. The long-term outlook is positive, with the potential for significant value creation for key players and investors.
South and Central America Oil Field Services Industry Segmentation
- 1. Production Analysis
- 2. Consumption Analysis
- 3. Import Market Analysis (Value & Volume)
- 4. Export Market Analysis (Value & Volume)
- 5. Price Trend Analysis
South and Central America Oil Field Services Industry Segmentation By Geography
- 1. Mexico
- 2. Brazil
- 3. Argentina
- 4. Rest of The South and Central America
South and Central America Oil Field Services Industry REPORT HIGHLIGHTS
| Aspects | Details |
|---|---|
| Study Period | 2019-2033 |
| Base Year | 2024 |
| Estimated Year | 2025 |
| Forecast Period | 2025-2033 |
| Historical Period | 2019-2024 |
| Growth Rate | CAGR of 4.61% from 2019-2033 |
| Segmentation |
|
Table of Contents
- 1. Introduction
- 1.1. Research Scope
- 1.2. Market Segmentation
- 1.3. Research Methodology
- 1.4. Definitions and Assumptions
- 2. Executive Summary
- 2.1. Introduction
- 3. Market Dynamics
- 3.1. Introduction
- 3.2. Market Drivers
- 3.2.1. 4.; Increasing Number of Offshore Operations 4.; Demand Coming for Unconventional Energy Sources
- 3.3. Market Restrains
- 3.3.1. 4.; Demand for Renewable Energy
- 3.4. Market Trends
- 3.4.1. Drilling Services Expected to dominate the market
- 4. Market Factor Analysis
- 4.1. Porters Five Forces
- 4.2. Supply/Value Chain
- 4.3. PESTEL analysis
- 4.4. Market Entropy
- 4.5. Patent/Trademark Analysis
- 5. Global South and Central America Oil Field Services Industry Analysis, Insights and Forecast, 2019-2031
- 5.1. Market Analysis, Insights and Forecast - by Production Analysis
- 5.2. Market Analysis, Insights and Forecast - by Consumption Analysis
- 5.3. Market Analysis, Insights and Forecast - by Import Market Analysis (Value & Volume)
- 5.4. Market Analysis, Insights and Forecast - by Export Market Analysis (Value & Volume)
- 5.5. Market Analysis, Insights and Forecast - by Price Trend Analysis
- 5.6. Market Analysis, Insights and Forecast - by Region
- 5.6.1. Mexico
- 5.6.2. Brazil
- 5.6.3. Argentina
- 5.6.4. Rest of The South and Central America
- 5.1. Market Analysis, Insights and Forecast - by Production Analysis
- 6. Mexico South and Central America Oil Field Services Industry Analysis, Insights and Forecast, 2019-2031
- 6.1. Market Analysis, Insights and Forecast - by Production Analysis
- 6.2. Market Analysis, Insights and Forecast - by Consumption Analysis
- 6.3. Market Analysis, Insights and Forecast - by Import Market Analysis (Value & Volume)
- 6.4. Market Analysis, Insights and Forecast - by Export Market Analysis (Value & Volume)
- 6.5. Market Analysis, Insights and Forecast - by Price Trend Analysis
- 6.1. Market Analysis, Insights and Forecast - by Production Analysis
- 7. Brazil South and Central America Oil Field Services Industry Analysis, Insights and Forecast, 2019-2031
- 7.1. Market Analysis, Insights and Forecast - by Production Analysis
- 7.2. Market Analysis, Insights and Forecast - by Consumption Analysis
- 7.3. Market Analysis, Insights and Forecast - by Import Market Analysis (Value & Volume)
- 7.4. Market Analysis, Insights and Forecast - by Export Market Analysis (Value & Volume)
- 7.5. Market Analysis, Insights and Forecast - by Price Trend Analysis
- 7.1. Market Analysis, Insights and Forecast - by Production Analysis
- 8. Argentina South and Central America Oil Field Services Industry Analysis, Insights and Forecast, 2019-2031
- 8.1. Market Analysis, Insights and Forecast - by Production Analysis
- 8.2. Market Analysis, Insights and Forecast - by Consumption Analysis
- 8.3. Market Analysis, Insights and Forecast - by Import Market Analysis (Value & Volume)
- 8.4. Market Analysis, Insights and Forecast - by Export Market Analysis (Value & Volume)
- 8.5. Market Analysis, Insights and Forecast - by Price Trend Analysis
- 8.1. Market Analysis, Insights and Forecast - by Production Analysis
- 9. Rest of The South and Central America South and Central America Oil Field Services Industry Analysis, Insights and Forecast, 2019-2031
- 9.1. Market Analysis, Insights and Forecast - by Production Analysis
- 9.2. Market Analysis, Insights and Forecast - by Consumption Analysis
- 9.3. Market Analysis, Insights and Forecast - by Import Market Analysis (Value & Volume)
- 9.4. Market Analysis, Insights and Forecast - by Export Market Analysis (Value & Volume)
- 9.5. Market Analysis, Insights and Forecast - by Price Trend Analysis
- 9.1. Market Analysis, Insights and Forecast - by Production Analysis
- 10. North America South and Central America Oil Field Services Industry Analysis, Insights and Forecast, 2019-2031
- 10.1. Market Analysis, Insights and Forecast - By Country/Sub-region
- 10.1.1 United States
- 10.1.2 Canada
- 10.1.3 Mexico
- 11. Europe South and Central America Oil Field Services Industry Analysis, Insights and Forecast, 2019-2031
- 11.1. Market Analysis, Insights and Forecast - By Country/Sub-region
- 11.1.1 Germany
- 11.1.2 United Kingdom
- 11.1.3 France
- 11.1.4 Spain
- 11.1.5 Italy
- 11.1.6 Spain
- 11.1.7 Belgium
- 11.1.8 Netherland
- 11.1.9 Nordics
- 11.1.10 Rest of Europe
- 12. Asia Pacific South and Central America Oil Field Services Industry Analysis, Insights and Forecast, 2019-2031
- 12.1. Market Analysis, Insights and Forecast - By Country/Sub-region
- 12.1.1 China
- 12.1.2 Japan
- 12.1.3 India
- 12.1.4 South Korea
- 12.1.5 Southeast Asia
- 12.1.6 Australia
- 12.1.7 Indonesia
- 12.1.8 Phillipes
- 12.1.9 Singapore
- 12.1.10 Thailandc
- 12.1.11 Rest of Asia Pacific
- 13. South America South and Central America Oil Field Services Industry Analysis, Insights and Forecast, 2019-2031
- 13.1. Market Analysis, Insights and Forecast - By Country/Sub-region
- 13.1.1 Brazil
- 13.1.2 Argentina
- 13.1.3 Peru
- 13.1.4 Chile
- 13.1.5 Colombia
- 13.1.6 Ecuador
- 13.1.7 Venezuela
- 13.1.8 Rest of South America
- 14. North America South and Central America Oil Field Services Industry Analysis, Insights and Forecast, 2019-2031
- 14.1. Market Analysis, Insights and Forecast - By Country/Sub-region
- 14.1.1 United States
- 14.1.2 Canada
- 14.1.3 Mexico
- 15. MEA South and Central America Oil Field Services Industry Analysis, Insights and Forecast, 2019-2031
- 15.1. Market Analysis, Insights and Forecast - By Country/Sub-region
- 15.1.1 United Arab Emirates
- 15.1.2 Saudi Arabia
- 15.1.3 South Africa
- 15.1.4 Rest of Middle East and Africa
- 16. Competitive Analysis
- 16.1. Global Market Share Analysis 2024
- 16.2. Company Profiles
- 16.2.1 Halliburton
- 16.2.1.1. Overview
- 16.2.1.2. Products
- 16.2.1.3. SWOT Analysis
- 16.2.1.4. Recent Developments
- 16.2.1.5. Financials (Based on Availability)
- 16.2.2 Schlumberger
- 16.2.2.1. Overview
- 16.2.2.2. Products
- 16.2.2.3. SWOT Analysis
- 16.2.2.4. Recent Developments
- 16.2.2.5. Financials (Based on Availability)
- 16.2.3 Baker Hughes
- 16.2.3.1. Overview
- 16.2.3.2. Products
- 16.2.3.3. SWOT Analysis
- 16.2.3.4. Recent Developments
- 16.2.3.5. Financials (Based on Availability)
- 16.2.4 Weatherford International
- 16.2.4.1. Overview
- 16.2.4.2. Products
- 16.2.4.3. SWOT Analysis
- 16.2.4.4. Recent Developments
- 16.2.4.5. Financials (Based on Availability)
- 16.2.5 Expro International
- 16.2.5.1. Overview
- 16.2.5.2. Products
- 16.2.5.3. SWOT Analysis
- 16.2.5.4. Recent Developments
- 16.2.5.5. Financials (Based on Availability)
- 16.2.1 Halliburton
List of Figures
- Figure 1: Global South and Central America Oil Field Services Industry Revenue Breakdown (Million, %) by Region 2024 & 2032
- Figure 2: North America South and Central America Oil Field Services Industry Revenue (Million), by Country 2024 & 2032
- Figure 3: North America South and Central America Oil Field Services Industry Revenue Share (%), by Country 2024 & 2032
- Figure 4: Europe South and Central America Oil Field Services Industry Revenue (Million), by Country 2024 & 2032
- Figure 5: Europe South and Central America Oil Field Services Industry Revenue Share (%), by Country 2024 & 2032
- Figure 6: Asia Pacific South and Central America Oil Field Services Industry Revenue (Million), by Country 2024 & 2032
- Figure 7: Asia Pacific South and Central America Oil Field Services Industry Revenue Share (%), by Country 2024 & 2032
- Figure 8: South America South and Central America Oil Field Services Industry Revenue (Million), by Country 2024 & 2032
- Figure 9: South America South and Central America Oil Field Services Industry Revenue Share (%), by Country 2024 & 2032
- Figure 10: North America South and Central America Oil Field Services Industry Revenue (Million), by Country 2024 & 2032
- Figure 11: North America South and Central America Oil Field Services Industry Revenue Share (%), by Country 2024 & 2032
- Figure 12: MEA South and Central America Oil Field Services Industry Revenue (Million), by Country 2024 & 2032
- Figure 13: MEA South and Central America Oil Field Services Industry Revenue Share (%), by Country 2024 & 2032
- Figure 14: Mexico South and Central America Oil Field Services Industry Revenue (Million), by Production Analysis 2024 & 2032
- Figure 15: Mexico South and Central America Oil Field Services Industry Revenue Share (%), by Production Analysis 2024 & 2032
- Figure 16: Mexico South and Central America Oil Field Services Industry Revenue (Million), by Consumption Analysis 2024 & 2032
- Figure 17: Mexico South and Central America Oil Field Services Industry Revenue Share (%), by Consumption Analysis 2024 & 2032
- Figure 18: Mexico South and Central America Oil Field Services Industry Revenue (Million), by Import Market Analysis (Value & Volume) 2024 & 2032
- Figure 19: Mexico South and Central America Oil Field Services Industry Revenue Share (%), by Import Market Analysis (Value & Volume) 2024 & 2032
- Figure 20: Mexico South and Central America Oil Field Services Industry Revenue (Million), by Export Market Analysis (Value & Volume) 2024 & 2032
- Figure 21: Mexico South and Central America Oil Field Services Industry Revenue Share (%), by Export Market Analysis (Value & Volume) 2024 & 2032
- Figure 22: Mexico South and Central America Oil Field Services Industry Revenue (Million), by Price Trend Analysis 2024 & 2032
- Figure 23: Mexico South and Central America Oil Field Services Industry Revenue Share (%), by Price Trend Analysis 2024 & 2032
- Figure 24: Mexico South and Central America Oil Field Services Industry Revenue (Million), by Country 2024 & 2032
- Figure 25: Mexico South and Central America Oil Field Services Industry Revenue Share (%), by Country 2024 & 2032
- Figure 26: Brazil South and Central America Oil Field Services Industry Revenue (Million), by Production Analysis 2024 & 2032
- Figure 27: Brazil South and Central America Oil Field Services Industry Revenue Share (%), by Production Analysis 2024 & 2032
- Figure 28: Brazil South and Central America Oil Field Services Industry Revenue (Million), by Consumption Analysis 2024 & 2032
- Figure 29: Brazil South and Central America Oil Field Services Industry Revenue Share (%), by Consumption Analysis 2024 & 2032
- Figure 30: Brazil South and Central America Oil Field Services Industry Revenue (Million), by Import Market Analysis (Value & Volume) 2024 & 2032
- Figure 31: Brazil South and Central America Oil Field Services Industry Revenue Share (%), by Import Market Analysis (Value & Volume) 2024 & 2032
- Figure 32: Brazil South and Central America Oil Field Services Industry Revenue (Million), by Export Market Analysis (Value & Volume) 2024 & 2032
- Figure 33: Brazil South and Central America Oil Field Services Industry Revenue Share (%), by Export Market Analysis (Value & Volume) 2024 & 2032
- Figure 34: Brazil South and Central America Oil Field Services Industry Revenue (Million), by Price Trend Analysis 2024 & 2032
- Figure 35: Brazil South and Central America Oil Field Services Industry Revenue Share (%), by Price Trend Analysis 2024 & 2032
- Figure 36: Brazil South and Central America Oil Field Services Industry Revenue (Million), by Country 2024 & 2032
- Figure 37: Brazil South and Central America Oil Field Services Industry Revenue Share (%), by Country 2024 & 2032
- Figure 38: Argentina South and Central America Oil Field Services Industry Revenue (Million), by Production Analysis 2024 & 2032
- Figure 39: Argentina South and Central America Oil Field Services Industry Revenue Share (%), by Production Analysis 2024 & 2032
- Figure 40: Argentina South and Central America Oil Field Services Industry Revenue (Million), by Consumption Analysis 2024 & 2032
- Figure 41: Argentina South and Central America Oil Field Services Industry Revenue Share (%), by Consumption Analysis 2024 & 2032
- Figure 42: Argentina South and Central America Oil Field Services Industry Revenue (Million), by Import Market Analysis (Value & Volume) 2024 & 2032
- Figure 43: Argentina South and Central America Oil Field Services Industry Revenue Share (%), by Import Market Analysis (Value & Volume) 2024 & 2032
- Figure 44: Argentina South and Central America Oil Field Services Industry Revenue (Million), by Export Market Analysis (Value & Volume) 2024 & 2032
- Figure 45: Argentina South and Central America Oil Field Services Industry Revenue Share (%), by Export Market Analysis (Value & Volume) 2024 & 2032
- Figure 46: Argentina South and Central America Oil Field Services Industry Revenue (Million), by Price Trend Analysis 2024 & 2032
- Figure 47: Argentina South and Central America Oil Field Services Industry Revenue Share (%), by Price Trend Analysis 2024 & 2032
- Figure 48: Argentina South and Central America Oil Field Services Industry Revenue (Million), by Country 2024 & 2032
- Figure 49: Argentina South and Central America Oil Field Services Industry Revenue Share (%), by Country 2024 & 2032
- Figure 50: Rest of The South and Central America South and Central America Oil Field Services Industry Revenue (Million), by Production Analysis 2024 & 2032
- Figure 51: Rest of The South and Central America South and Central America Oil Field Services Industry Revenue Share (%), by Production Analysis 2024 & 2032
- Figure 52: Rest of The South and Central America South and Central America Oil Field Services Industry Revenue (Million), by Consumption Analysis 2024 & 2032
- Figure 53: Rest of The South and Central America South and Central America Oil Field Services Industry Revenue Share (%), by Consumption Analysis 2024 & 2032
- Figure 54: Rest of The South and Central America South and Central America Oil Field Services Industry Revenue (Million), by Import Market Analysis (Value & Volume) 2024 & 2032
- Figure 55: Rest of The South and Central America South and Central America Oil Field Services Industry Revenue Share (%), by Import Market Analysis (Value & Volume) 2024 & 2032
- Figure 56: Rest of The South and Central America South and Central America Oil Field Services Industry Revenue (Million), by Export Market Analysis (Value & Volume) 2024 & 2032
- Figure 57: Rest of The South and Central America South and Central America Oil Field Services Industry Revenue Share (%), by Export Market Analysis (Value & Volume) 2024 & 2032
- Figure 58: Rest of The South and Central America South and Central America Oil Field Services Industry Revenue (Million), by Price Trend Analysis 2024 & 2032
- Figure 59: Rest of The South and Central America South and Central America Oil Field Services Industry Revenue Share (%), by Price Trend Analysis 2024 & 2032
- Figure 60: Rest of The South and Central America South and Central America Oil Field Services Industry Revenue (Million), by Country 2024 & 2032
- Figure 61: Rest of The South and Central America South and Central America Oil Field Services Industry Revenue Share (%), by Country 2024 & 2032
List of Tables
- Table 1: Global South and Central America Oil Field Services Industry Revenue Million Forecast, by Region 2019 & 2032
- Table 2: Global South and Central America Oil Field Services Industry Revenue Million Forecast, by Production Analysis 2019 & 2032
- Table 3: Global South and Central America Oil Field Services Industry Revenue Million Forecast, by Consumption Analysis 2019 & 2032
- Table 4: Global South and Central America Oil Field Services Industry Revenue Million Forecast, by Import Market Analysis (Value & Volume) 2019 & 2032
- Table 5: Global South and Central America Oil Field Services Industry Revenue Million Forecast, by Export Market Analysis (Value & Volume) 2019 & 2032
- Table 6: Global South and Central America Oil Field Services Industry Revenue Million Forecast, by Price Trend Analysis 2019 & 2032
- Table 7: Global South and Central America Oil Field Services Industry Revenue Million Forecast, by Region 2019 & 2032
- Table 8: Global South and Central America Oil Field Services Industry Revenue Million Forecast, by Country 2019 & 2032
- Table 9: United States South and Central America Oil Field Services Industry Revenue (Million) Forecast, by Application 2019 & 2032
- Table 10: Canada South and Central America Oil Field Services Industry Revenue (Million) Forecast, by Application 2019 & 2032
- Table 11: Mexico South and Central America Oil Field Services Industry Revenue (Million) Forecast, by Application 2019 & 2032
- Table 12: Global South and Central America Oil Field Services Industry Revenue Million Forecast, by Country 2019 & 2032
- Table 13: Germany South and Central America Oil Field Services Industry Revenue (Million) Forecast, by Application 2019 & 2032
- Table 14: United Kingdom South and Central America Oil Field Services Industry Revenue (Million) Forecast, by Application 2019 & 2032
- Table 15: France South and Central America Oil Field Services Industry Revenue (Million) Forecast, by Application 2019 & 2032
- Table 16: Spain South and Central America Oil Field Services Industry Revenue (Million) Forecast, by Application 2019 & 2032
- Table 17: Italy South and Central America Oil Field Services Industry Revenue (Million) Forecast, by Application 2019 & 2032
- Table 18: Spain South and Central America Oil Field Services Industry Revenue (Million) Forecast, by Application 2019 & 2032
- Table 19: Belgium South and Central America Oil Field Services Industry Revenue (Million) Forecast, by Application 2019 & 2032
- Table 20: Netherland South and Central America Oil Field Services Industry Revenue (Million) Forecast, by Application 2019 & 2032
- Table 21: Nordics South and Central America Oil Field Services Industry Revenue (Million) Forecast, by Application 2019 & 2032
- Table 22: Rest of Europe South and Central America Oil Field Services Industry Revenue (Million) Forecast, by Application 2019 & 2032
- Table 23: Global South and Central America Oil Field Services Industry Revenue Million Forecast, by Country 2019 & 2032
- Table 24: China South and Central America Oil Field Services Industry Revenue (Million) Forecast, by Application 2019 & 2032
- Table 25: Japan South and Central America Oil Field Services Industry Revenue (Million) Forecast, by Application 2019 & 2032
- Table 26: India South and Central America Oil Field Services Industry Revenue (Million) Forecast, by Application 2019 & 2032
- Table 27: South Korea South and Central America Oil Field Services Industry Revenue (Million) Forecast, by Application 2019 & 2032
- Table 28: Southeast Asia South and Central America Oil Field Services Industry Revenue (Million) Forecast, by Application 2019 & 2032
- Table 29: Australia South and Central America Oil Field Services Industry Revenue (Million) Forecast, by Application 2019 & 2032
- Table 30: Indonesia South and Central America Oil Field Services Industry Revenue (Million) Forecast, by Application 2019 & 2032
- Table 31: Phillipes South and Central America Oil Field Services Industry Revenue (Million) Forecast, by Application 2019 & 2032
- Table 32: Singapore South and Central America Oil Field Services Industry Revenue (Million) Forecast, by Application 2019 & 2032
- Table 33: Thailandc South and Central America Oil Field Services Industry Revenue (Million) Forecast, by Application 2019 & 2032
- Table 34: Rest of Asia Pacific South and Central America Oil Field Services Industry Revenue (Million) Forecast, by Application 2019 & 2032
- Table 35: Global South and Central America Oil Field Services Industry Revenue Million Forecast, by Country 2019 & 2032
- Table 36: Brazil South and Central America Oil Field Services Industry Revenue (Million) Forecast, by Application 2019 & 2032
- Table 37: Argentina South and Central America Oil Field Services Industry Revenue (Million) Forecast, by Application 2019 & 2032
- Table 38: Peru South and Central America Oil Field Services Industry Revenue (Million) Forecast, by Application 2019 & 2032
- Table 39: Chile South and Central America Oil Field Services Industry Revenue (Million) Forecast, by Application 2019 & 2032
- Table 40: Colombia South and Central America Oil Field Services Industry Revenue (Million) Forecast, by Application 2019 & 2032
- Table 41: Ecuador South and Central America Oil Field Services Industry Revenue (Million) Forecast, by Application 2019 & 2032
- Table 42: Venezuela South and Central America Oil Field Services Industry Revenue (Million) Forecast, by Application 2019 & 2032
- Table 43: Rest of South America South and Central America Oil Field Services Industry Revenue (Million) Forecast, by Application 2019 & 2032
- Table 44: Global South and Central America Oil Field Services Industry Revenue Million Forecast, by Country 2019 & 2032
- Table 45: United States South and Central America Oil Field Services Industry Revenue (Million) Forecast, by Application 2019 & 2032
- Table 46: Canada South and Central America Oil Field Services Industry Revenue (Million) Forecast, by Application 2019 & 2032
- Table 47: Mexico South and Central America Oil Field Services Industry Revenue (Million) Forecast, by Application 2019 & 2032
- Table 48: Global South and Central America Oil Field Services Industry Revenue Million Forecast, by Country 2019 & 2032
- Table 49: United Arab Emirates South and Central America Oil Field Services Industry Revenue (Million) Forecast, by Application 2019 & 2032
- Table 50: Saudi Arabia South and Central America Oil Field Services Industry Revenue (Million) Forecast, by Application 2019 & 2032
- Table 51: South Africa South and Central America Oil Field Services Industry Revenue (Million) Forecast, by Application 2019 & 2032
- Table 52: Rest of Middle East and Africa South and Central America Oil Field Services Industry Revenue (Million) Forecast, by Application 2019 & 2032
- Table 53: Global South and Central America Oil Field Services Industry Revenue Million Forecast, by Production Analysis 2019 & 2032
- Table 54: Global South and Central America Oil Field Services Industry Revenue Million Forecast, by Consumption Analysis 2019 & 2032
- Table 55: Global South and Central America Oil Field Services Industry Revenue Million Forecast, by Import Market Analysis (Value & Volume) 2019 & 2032
- Table 56: Global South and Central America Oil Field Services Industry Revenue Million Forecast, by Export Market Analysis (Value & Volume) 2019 & 2032
- Table 57: Global South and Central America Oil Field Services Industry Revenue Million Forecast, by Price Trend Analysis 2019 & 2032
- Table 58: Global South and Central America Oil Field Services Industry Revenue Million Forecast, by Country 2019 & 2032
- Table 59: Global South and Central America Oil Field Services Industry Revenue Million Forecast, by Production Analysis 2019 & 2032
- Table 60: Global South and Central America Oil Field Services Industry Revenue Million Forecast, by Consumption Analysis 2019 & 2032
- Table 61: Global South and Central America Oil Field Services Industry Revenue Million Forecast, by Import Market Analysis (Value & Volume) 2019 & 2032
- Table 62: Global South and Central America Oil Field Services Industry Revenue Million Forecast, by Export Market Analysis (Value & Volume) 2019 & 2032
- Table 63: Global South and Central America Oil Field Services Industry Revenue Million Forecast, by Price Trend Analysis 2019 & 2032
- Table 64: Global South and Central America Oil Field Services Industry Revenue Million Forecast, by Country 2019 & 2032
- Table 65: Global South and Central America Oil Field Services Industry Revenue Million Forecast, by Production Analysis 2019 & 2032
- Table 66: Global South and Central America Oil Field Services Industry Revenue Million Forecast, by Consumption Analysis 2019 & 2032
- Table 67: Global South and Central America Oil Field Services Industry Revenue Million Forecast, by Import Market Analysis (Value & Volume) 2019 & 2032
- Table 68: Global South and Central America Oil Field Services Industry Revenue Million Forecast, by Export Market Analysis (Value & Volume) 2019 & 2032
- Table 69: Global South and Central America Oil Field Services Industry Revenue Million Forecast, by Price Trend Analysis 2019 & 2032
- Table 70: Global South and Central America Oil Field Services Industry Revenue Million Forecast, by Country 2019 & 2032
- Table 71: Global South and Central America Oil Field Services Industry Revenue Million Forecast, by Production Analysis 2019 & 2032
- Table 72: Global South and Central America Oil Field Services Industry Revenue Million Forecast, by Consumption Analysis 2019 & 2032
- Table 73: Global South and Central America Oil Field Services Industry Revenue Million Forecast, by Import Market Analysis (Value & Volume) 2019 & 2032
- Table 74: Global South and Central America Oil Field Services Industry Revenue Million Forecast, by Export Market Analysis (Value & Volume) 2019 & 2032
- Table 75: Global South and Central America Oil Field Services Industry Revenue Million Forecast, by Price Trend Analysis 2019 & 2032
- Table 76: Global South and Central America Oil Field Services Industry Revenue Million Forecast, by Country 2019 & 2032
Frequently Asked Questions
1. What is the projected Compound Annual Growth Rate (CAGR) of the South and Central America Oil Field Services Industry?
The projected CAGR is approximately 4.61%.
2. Which companies are prominent players in the South and Central America Oil Field Services Industry?
Key companies in the market include Halliburton , Schlumberger , Baker Hughes , Weatherford International , Expro International.
3. What are the main segments of the South and Central America Oil Field Services Industry?
The market segments include Production Analysis, Consumption Analysis, Import Market Analysis (Value & Volume), Export Market Analysis (Value & Volume), Price Trend Analysis.
4. Can you provide details about the market size?
The market size is estimated to be USD XX Million as of 2022.
5. What are some drivers contributing to market growth?
4.; Increasing Number of Offshore Operations 4.; Demand Coming for Unconventional Energy Sources.
6. What are the notable trends driving market growth?
Drilling Services Expected to dominate the market.
7. Are there any restraints impacting market growth?
4.; Demand for Renewable Energy.
8. Can you provide examples of recent developments in the market?
November 2022: Petrobras awarded Diamond Offshore's Ocean Courage a four-year project with an unpriced option for an additional four years in Brazil. The estimated total value of the firm term of the award, which includes a mobilization fee and the provision of some extra services, is about USD 429 million.The contract is expected to commence in Q4 2023.
9. What pricing options are available for accessing the report?
Pricing options include single-user, multi-user, and enterprise licenses priced at USD 4750, USD 5250, and USD 8750 respectively.
10. Is the market size provided in terms of value or volume?
The market size is provided in terms of value, measured in Million.
11. Are there any specific market keywords associated with the report?
Yes, the market keyword associated with the report is "South and Central America Oil Field Services Industry," which aids in identifying and referencing the specific market segment covered.
12. How do I determine which pricing option suits my needs best?
The pricing options vary based on user requirements and access needs. Individual users may opt for single-user licenses, while businesses requiring broader access may choose multi-user or enterprise licenses for cost-effective access to the report.
13. Are there any additional resources or data provided in the South and Central America Oil Field Services Industry report?
While the report offers comprehensive insights, it's advisable to review the specific contents or supplementary materials provided to ascertain if additional resources or data are available.
14. How can I stay updated on further developments or reports in the South and Central America Oil Field Services Industry?
To stay informed about further developments, trends, and reports in the South and Central America Oil Field Services Industry, consider subscribing to industry newsletters, following relevant companies and organizations, or regularly checking reputable industry news sources and publications.
Methodology
Step 1 - Identification of Relevant Samples Size from Population Database


Step 2 - Approaches for Defining Global Market Size (Value, Volume* & Price*)

Note*: In applicable scenarios
Step 3 - Data Sources
Primary Research
- Web Analytics
- Survey Reports
- Research Institute
- Latest Research Reports
- Opinion Leaders
Secondary Research
- Annual Reports
- White Paper
- Latest Press Release
- Industry Association
- Paid Database
- Investor Presentations

Step 4 - Data Triangulation
Involves using different sources of information in order to increase the validity of a study
These sources are likely to be stakeholders in a program - participants, other researchers, program staff, other community members, and so on.
Then we put all data in single framework & apply various statistical tools to find out the dynamic on the market.
During the analysis stage, feedback from the stakeholder groups would be compared to determine areas of agreement as well as areas of divergence
