

Key Insights
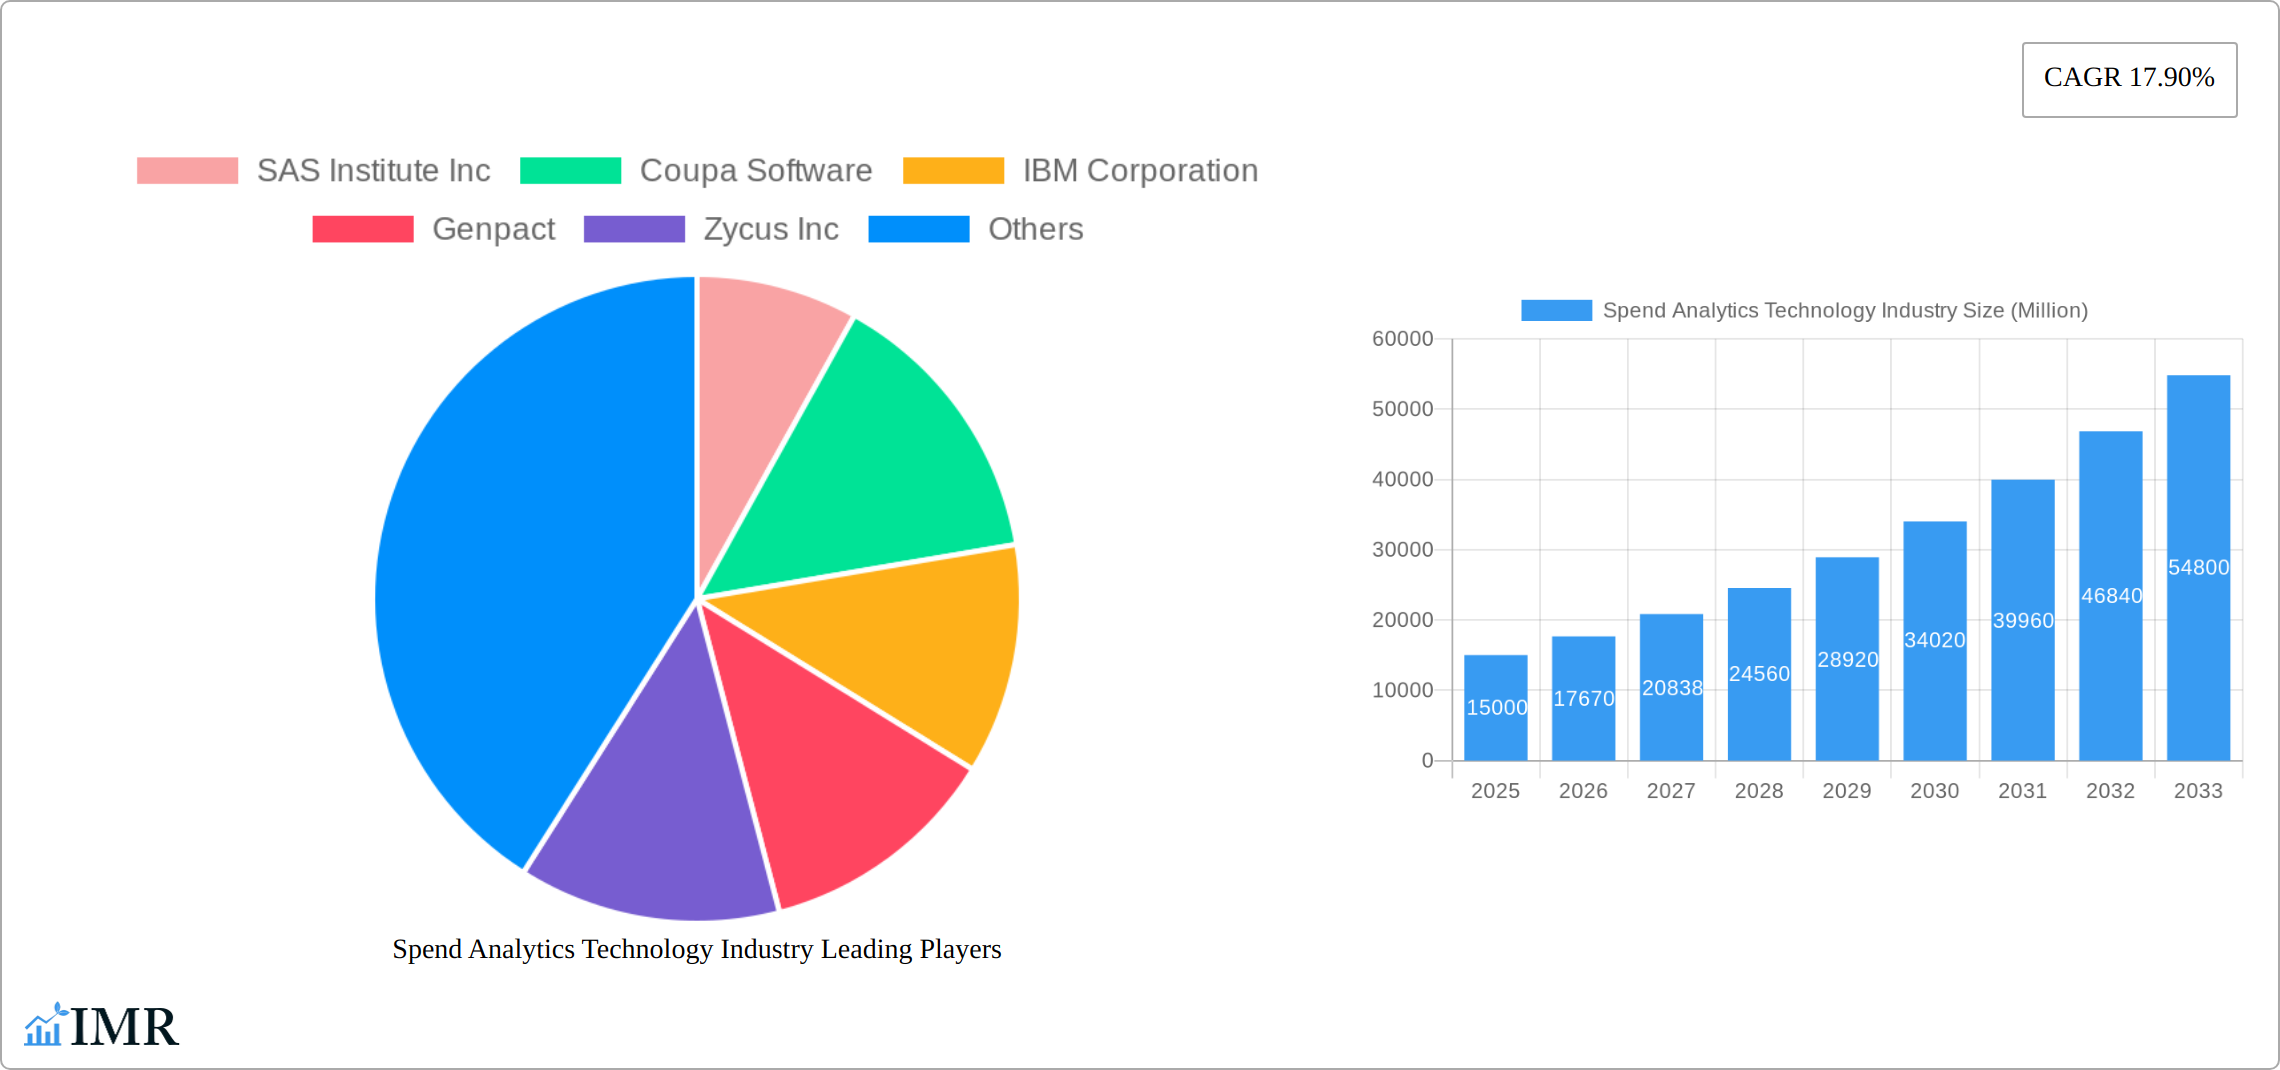
The Spend Analytics Technology market is experiencing robust growth, projected to reach a substantial size with a Compound Annual Growth Rate (CAGR) of 17.90% from 2025 to 2033. This expansion is driven by several key factors. The increasing need for enhanced cost visibility and efficiency within organizations across various sectors, including manufacturing, supply chain & logistics, retail, BFSI (Banking, Financial Services, and Insurance), IT & Telecommunications, education, and healthcare, is a significant catalyst. Businesses are increasingly adopting spend analytics solutions to optimize procurement processes, identify cost savings opportunities, and improve supplier relationships. Furthermore, the shift towards cloud-based deployments and the rising adoption of advanced analytics capabilities, such as predictive and prescriptive analytics, are fueling market growth. The market is segmented by end-user industry, type (software and service), analysis type (descriptive, prescriptive, predictive), and deployment (on-premise and cloud). Competitive players like SAS Institute Inc., Coupa Software, IBM Corporation, and others are driving innovation and expanding market penetration through strategic partnerships, product enhancements, and geographical expansion.
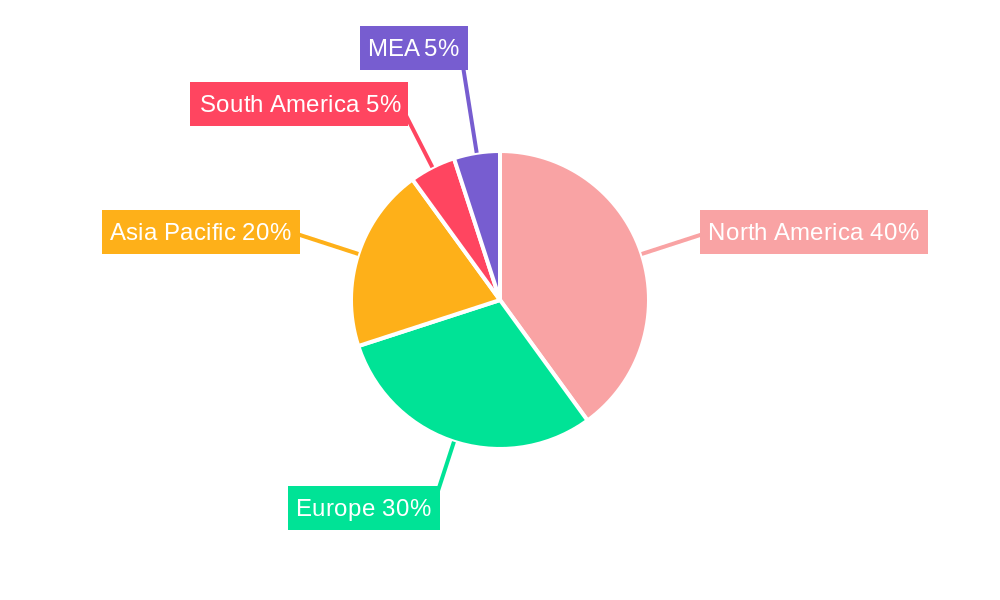
The North American market currently holds a significant share, driven by early adoption and technological advancements. However, regions like Asia-Pacific are expected to witness rapid growth in the coming years due to increasing digitalization and the growing number of businesses adopting advanced procurement technologies. While the market faces challenges such as data integration complexities and the need for skilled professionals, the overall growth trajectory remains positive. The increasing availability of affordable and user-friendly solutions, coupled with growing awareness of the benefits of spend analytics, is expected to offset these restraints and drive continued market expansion throughout the forecast period (2025-2033). The historical period (2019-2024) provides a strong foundation indicating a continued upward trend. Competitive landscape analysis reveals a mix of established players and emerging companies, indicative of a dynamic and innovative market.
Spend Analytics Technology Market Report: 2019-2033
This comprehensive report provides a detailed analysis of the Spend Analytics Technology market, encompassing market size, growth trends, competitive landscape, and future outlook. The study period covers 2019-2033, with 2025 as the base and estimated year. The report segments the market by end-user industry, type, analysis, and deployment, providing granular insights for informed decision-making. This report is invaluable for industry professionals, investors, and businesses seeking to understand and capitalize on opportunities within this rapidly evolving market. The projected market value in 2033 is estimated at xx Million.
Spend Analytics Technology Industry Market Dynamics & Structure
The Spend Analytics Technology market is characterized by a moderately consolidated structure, with several key players competing for market share. The market is driven by technological advancements, particularly in AI and machine learning, enabling more sophisticated analysis and predictive capabilities. Regulatory frameworks, such as GDPR and CCPA, influence data privacy and security practices, shaping market dynamics. Competitive product substitutes, such as basic spreadsheet software, continue to exist, but the advantages of sophisticated spend analytics are driving adoption. The manufacturing, BFSI, and retail sectors are key end-user industries. M&A activity is significant, reflecting the industry's growth and consolidation trends. Over the historical period (2019-2024), there were approximately xx M&A deals, with a trend towards larger acquisitions.
- Market Concentration: Moderately consolidated, with top 5 players holding approximately xx% market share (2024).
- Technological Innovation Drivers: AI/ML, big data analytics, cloud computing.
- Regulatory Frameworks: GDPR, CCPA, impacting data security and privacy.
- Competitive Product Substitutes: Basic spreadsheet software, limiting market penetration in smaller businesses.
- End-User Demographics: Manufacturing, BFSI, and Retail sectors represent the largest market segments.
- M&A Trends: Increasing deal volume, with a focus on strategic acquisitions to enhance capabilities and market reach.
Spend Analytics Technology Industry Growth Trends & Insights
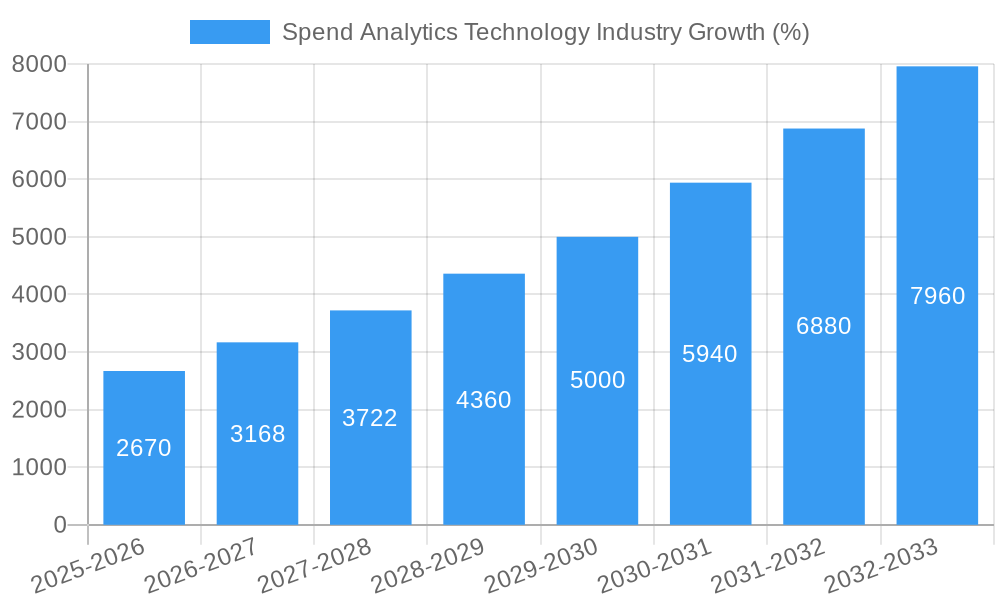
The Spend Analytics Technology market exhibited robust growth between 2019 and 2024, with a CAGR of xx%. This growth is fueled by increasing adoption across diverse industries, driven by the need for cost optimization, enhanced visibility into spending patterns, and improved procurement processes. Technological disruptions, such as the rise of cloud-based solutions and AI-powered analytics, are transforming the market landscape. Consumer behavior is shifting towards more data-driven decision-making, reinforcing the demand for spend analytics solutions. The market is expected to maintain a healthy growth trajectory during the forecast period (2025-2033), with a projected CAGR of xx%, reaching an estimated xx Million by 2033. Market penetration is increasing, particularly in developing economies.
Dominant Regions, Countries, or Segments in Spend Analytics Technology Industry
North America currently holds the largest market share in the Spend Analytics Technology market, driven by high adoption rates in the manufacturing and BFSI sectors and advanced technological infrastructure. However, the Asia-Pacific region is projected to experience the fastest growth over the forecast period due to rapid economic development, increasing digitalization, and rising demand from emerging economies like India and China. Within the segment analysis, the software segment dominates the market with xx% share (2024) because of its scalability and flexibility. The predictive analytics segment is exhibiting rapid growth due to its potential for proactive cost management. Cloud-based deployments are becoming increasingly popular over on-premise solutions.
- Key Drivers by Region:
- North America: High technological advancement, strong adoption rates across industries.
- Europe: Stringent data privacy regulations driving demand for secure solutions.
- Asia-Pacific: Rapid economic growth, increasing digitalization, rising demand from emerging markets.
- Key Drivers by Segment:
- Software: Scalability, flexibility, ease of integration.
- Predictive Analysis: Proactive cost management, improved forecasting accuracy.
- Cloud Deployment: Enhanced accessibility, cost-effectiveness, scalability.
- Manufacturing: High spending on procurement and supply chain optimization.
- BFSI: Stringent regulatory compliance requirements and the need for fraud detection.
Spend Analytics Technology Industry Product Landscape
Spend analytics solutions are evolving rapidly, incorporating advanced AI/ML capabilities for predictive analysis, automated insights generation, and improved user experience. Modern solutions emphasize intuitive interfaces, seamless integration with existing ERP systems, and robust data visualization tools. Unique selling propositions often involve specialized industry-specific solutions, pre-built templates for faster deployment, and advanced reporting capabilities. Technological advancements are leading to increased automation, improved accuracy, and deeper insights.
Key Drivers, Barriers & Challenges in Spend Analytics Technology Industry
Key Drivers:
- Increasing need for cost optimization and efficiency improvements across industries.
- Growing adoption of cloud computing and big data analytics.
- Rise of AI and machine learning capabilities enhancing analytical power.
Challenges & Restraints:
- High initial investment costs for implementation and integration.
- Data security and privacy concerns, particularly with sensitive financial data.
- Complexity in data integration from diverse sources, leading to implementation challenges.
- Lack of skilled professionals to manage and interpret the analytics. This currently represents a xx% barrier to market growth (2024).
Emerging Opportunities in Spend Analytics Technology Industry
- Growing demand for real-time spend visibility and control.
- Expansion into untapped markets, such as small and medium-sized enterprises (SMEs).
- Development of innovative applications, such as integrating spend data with sustainability initiatives.
- Increasing adoption of AI-powered predictive modeling for optimized procurement strategies.
Growth Accelerators in the Spend Analytics Technology Industry
Technological breakthroughs in AI and machine learning continue to drive market growth, enabling more sophisticated analytics and automation. Strategic partnerships between spend analytics providers and ERP vendors are simplifying implementation and integration. Market expansion strategies, targeting SMEs and emerging markets, are creating new growth opportunities.
Key Players Shaping the Spend Analytics Technology Market
- SAS Institute Inc
- Coupa Software
- IBM Corporation
- Genpact
- Zycus Inc
- Oracle Corporation
- Empronc Solutions Pvt Ltd
- JAGGAER Incorporation
- Sievo Oy
- Proactis Inc
- SAP SE
Notable Milestones in Spend Analytics Technology Industry Sector
- July 2022: SAP SE acquired Askdata, enhancing its AI-driven natural language search capabilities for spend analytics.
- February 2022: JAGGAER acquired DocSkiff Inc., integrating AI-powered contract analysis into its platform.
In-Depth Spend Analytics Technology Industry Market Outlook
The Spend Analytics Technology market is poised for continued robust growth, driven by ongoing technological advancements, increased demand for cost optimization, and expansion into new markets. Strategic partnerships, product innovation, and a focus on user experience will be key factors in shaping the future market landscape. The potential for integrating spend analytics with other business intelligence tools presents significant growth opportunities. The market's long-term potential is significant, offering substantial returns for businesses involved in the development and deployment of these solutions.
Spend Analytics Technology Industry Segmentation
-
1. Type
- 1.1. Software
-
1.2. Service
- 1.2.1. Professional Service
- 1.2.2. Managed Service
-
2. Analysis
- 2.1. Descriptive
- 2.2. Prescriptive
- 2.3. Predictive
-
3. Deployment
- 3.1. On-Premise
- 3.2. Cloud
-
4. End-user Industry
- 4.1. Manufacturing
- 4.2. Supply Chain & Logistic
- 4.3. Retail
- 4.4. BFSI
- 4.5. IT & Telecommunication
- 4.6. Education
- 4.7. Healthcare
- 4.8. Other End-user Industries
Spend Analytics Technology Industry Segmentation By Geography
- 1. North America
- 2. Europe
- 3. Asia Pacific
- 4. Latin America
- 5. Middle East
Spend Analytics Technology Industry REPORT HIGHLIGHTS
| Aspects | Details |
|---|---|
| Study Period | 2019-2033 |
| Base Year | 2024 |
| Estimated Year | 2025 |
| Forecast Period | 2025-2033 |
| Historical Period | 2019-2024 |
| Growth Rate | CAGR of 17.90% from 2019-2033 |
| Segmentation |
|
Table of Contents
- 1. Introduction
- 1.1. Research Scope
- 1.2. Market Segmentation
- 1.3. Research Methodology
- 1.4. Definitions and Assumptions
- 2. Executive Summary
- 2.1. Introduction
- 3. Market Dynamics
- 3.1. Introduction
- 3.2. Market Drivers
- 3.2.1. Rising Adoption in Procurement Process in Industries; Rising Adoption of Cloud Services and Increasing Penetration of IoT Applications
- 3.3. Market Restrains
- 3.3.1. Growing Data Breaches Cases
- 3.4. Market Trends
- 3.4.1. Retail Segment is Expected to Hold Significant Share
- 4. Market Factor Analysis
- 4.1. Porters Five Forces
- 4.2. Supply/Value Chain
- 4.3. PESTEL analysis
- 4.4. Market Entropy
- 4.5. Patent/Trademark Analysis
- 5. Global Spend Analytics Technology Industry Analysis, Insights and Forecast, 2019-2031
- 5.1. Market Analysis, Insights and Forecast - by Type
- 5.1.1. Software
- 5.1.2. Service
- 5.1.2.1. Professional Service
- 5.1.2.2. Managed Service
- 5.2. Market Analysis, Insights and Forecast - by Analysis
- 5.2.1. Descriptive
- 5.2.2. Prescriptive
- 5.2.3. Predictive
- 5.3. Market Analysis, Insights and Forecast - by Deployment
- 5.3.1. On-Premise
- 5.3.2. Cloud
- 5.4. Market Analysis, Insights and Forecast - by End-user Industry
- 5.4.1. Manufacturing
- 5.4.2. Supply Chain & Logistic
- 5.4.3. Retail
- 5.4.4. BFSI
- 5.4.5. IT & Telecommunication
- 5.4.6. Education
- 5.4.7. Healthcare
- 5.4.8. Other End-user Industries
- 5.5. Market Analysis, Insights and Forecast - by Region
- 5.5.1. North America
- 5.5.2. Europe
- 5.5.3. Asia Pacific
- 5.5.4. Latin America
- 5.5.5. Middle East
- 5.1. Market Analysis, Insights and Forecast - by Type
- 6. North America Spend Analytics Technology Industry Analysis, Insights and Forecast, 2019-2031
- 6.1. Market Analysis, Insights and Forecast - by Type
- 6.1.1. Software
- 6.1.2. Service
- 6.1.2.1. Professional Service
- 6.1.2.2. Managed Service
- 6.2. Market Analysis, Insights and Forecast - by Analysis
- 6.2.1. Descriptive
- 6.2.2. Prescriptive
- 6.2.3. Predictive
- 6.3. Market Analysis, Insights and Forecast - by Deployment
- 6.3.1. On-Premise
- 6.3.2. Cloud
- 6.4. Market Analysis, Insights and Forecast - by End-user Industry
- 6.4.1. Manufacturing
- 6.4.2. Supply Chain & Logistic
- 6.4.3. Retail
- 6.4.4. BFSI
- 6.4.5. IT & Telecommunication
- 6.4.6. Education
- 6.4.7. Healthcare
- 6.4.8. Other End-user Industries
- 6.1. Market Analysis, Insights and Forecast - by Type
- 7. Europe Spend Analytics Technology Industry Analysis, Insights and Forecast, 2019-2031
- 7.1. Market Analysis, Insights and Forecast - by Type
- 7.1.1. Software
- 7.1.2. Service
- 7.1.2.1. Professional Service
- 7.1.2.2. Managed Service
- 7.2. Market Analysis, Insights and Forecast - by Analysis
- 7.2.1. Descriptive
- 7.2.2. Prescriptive
- 7.2.3. Predictive
- 7.3. Market Analysis, Insights and Forecast - by Deployment
- 7.3.1. On-Premise
- 7.3.2. Cloud
- 7.4. Market Analysis, Insights and Forecast - by End-user Industry
- 7.4.1. Manufacturing
- 7.4.2. Supply Chain & Logistic
- 7.4.3. Retail
- 7.4.4. BFSI
- 7.4.5. IT & Telecommunication
- 7.4.6. Education
- 7.4.7. Healthcare
- 7.4.8. Other End-user Industries
- 7.1. Market Analysis, Insights and Forecast - by Type
- 8. Asia Pacific Spend Analytics Technology Industry Analysis, Insights and Forecast, 2019-2031
- 8.1. Market Analysis, Insights and Forecast - by Type
- 8.1.1. Software
- 8.1.2. Service
- 8.1.2.1. Professional Service
- 8.1.2.2. Managed Service
- 8.2. Market Analysis, Insights and Forecast - by Analysis
- 8.2.1. Descriptive
- 8.2.2. Prescriptive
- 8.2.3. Predictive
- 8.3. Market Analysis, Insights and Forecast - by Deployment
- 8.3.1. On-Premise
- 8.3.2. Cloud
- 8.4. Market Analysis, Insights and Forecast - by End-user Industry
- 8.4.1. Manufacturing
- 8.4.2. Supply Chain & Logistic
- 8.4.3. Retail
- 8.4.4. BFSI
- 8.4.5. IT & Telecommunication
- 8.4.6. Education
- 8.4.7. Healthcare
- 8.4.8. Other End-user Industries
- 8.1. Market Analysis, Insights and Forecast - by Type
- 9. Latin America Spend Analytics Technology Industry Analysis, Insights and Forecast, 2019-2031
- 9.1. Market Analysis, Insights and Forecast - by Type
- 9.1.1. Software
- 9.1.2. Service
- 9.1.2.1. Professional Service
- 9.1.2.2. Managed Service
- 9.2. Market Analysis, Insights and Forecast - by Analysis
- 9.2.1. Descriptive
- 9.2.2. Prescriptive
- 9.2.3. Predictive
- 9.3. Market Analysis, Insights and Forecast - by Deployment
- 9.3.1. On-Premise
- 9.3.2. Cloud
- 9.4. Market Analysis, Insights and Forecast - by End-user Industry
- 9.4.1. Manufacturing
- 9.4.2. Supply Chain & Logistic
- 9.4.3. Retail
- 9.4.4. BFSI
- 9.4.5. IT & Telecommunication
- 9.4.6. Education
- 9.4.7. Healthcare
- 9.4.8. Other End-user Industries
- 9.1. Market Analysis, Insights and Forecast - by Type
- 10. Middle East Spend Analytics Technology Industry Analysis, Insights and Forecast, 2019-2031
- 10.1. Market Analysis, Insights and Forecast - by Type
- 10.1.1. Software
- 10.1.2. Service
- 10.1.2.1. Professional Service
- 10.1.2.2. Managed Service
- 10.2. Market Analysis, Insights and Forecast - by Analysis
- 10.2.1. Descriptive
- 10.2.2. Prescriptive
- 10.2.3. Predictive
- 10.3. Market Analysis, Insights and Forecast - by Deployment
- 10.3.1. On-Premise
- 10.3.2. Cloud
- 10.4. Market Analysis, Insights and Forecast - by End-user Industry
- 10.4.1. Manufacturing
- 10.4.2. Supply Chain & Logistic
- 10.4.3. Retail
- 10.4.4. BFSI
- 10.4.5. IT & Telecommunication
- 10.4.6. Education
- 10.4.7. Healthcare
- 10.4.8. Other End-user Industries
- 10.1. Market Analysis, Insights and Forecast - by Type
- 11. North America Spend Analytics Technology Industry Analysis, Insights and Forecast, 2019-2031
- 11.1. Market Analysis, Insights and Forecast - By Country/Sub-region
- 11.1.1 United States
- 11.1.2 Canada
- 11.1.3 Mexico
- 12. Europe Spend Analytics Technology Industry Analysis, Insights and Forecast, 2019-2031
- 12.1. Market Analysis, Insights and Forecast - By Country/Sub-region
- 12.1.1 Germany
- 12.1.2 United Kingdom
- 12.1.3 France
- 12.1.4 Spain
- 12.1.5 Italy
- 12.1.6 Spain
- 12.1.7 Belgium
- 12.1.8 Netherland
- 12.1.9 Nordics
- 12.1.10 Rest of Europe
- 13. Asia Pacific Spend Analytics Technology Industry Analysis, Insights and Forecast, 2019-2031
- 13.1. Market Analysis, Insights and Forecast - By Country/Sub-region
- 13.1.1 China
- 13.1.2 Japan
- 13.1.3 India
- 13.1.4 South Korea
- 13.1.5 Southeast Asia
- 13.1.6 Australia
- 13.1.7 Indonesia
- 13.1.8 Phillipes
- 13.1.9 Singapore
- 13.1.10 Thailandc
- 13.1.11 Rest of Asia Pacific
- 14. South America Spend Analytics Technology Industry Analysis, Insights and Forecast, 2019-2031
- 14.1. Market Analysis, Insights and Forecast - By Country/Sub-region
- 14.1.1 Brazil
- 14.1.2 Argentina
- 14.1.3 Peru
- 14.1.4 Chile
- 14.1.5 Colombia
- 14.1.6 Ecuador
- 14.1.7 Venezuela
- 14.1.8 Rest of South America
- 15. North America Spend Analytics Technology Industry Analysis, Insights and Forecast, 2019-2031
- 15.1. Market Analysis, Insights and Forecast - By Country/Sub-region
- 15.1.1 United States
- 15.1.2 Canada
- 15.1.3 Mexico
- 16. MEA Spend Analytics Technology Industry Analysis, Insights and Forecast, 2019-2031
- 16.1. Market Analysis, Insights and Forecast - By Country/Sub-region
- 16.1.1 United Arab Emirates
- 16.1.2 Saudi Arabia
- 16.1.3 South Africa
- 16.1.4 Rest of Middle East and Africa
- 17. Competitive Analysis
- 17.1. Global Market Share Analysis 2024
- 17.2. Company Profiles
- 17.2.1 SAS Institute Inc
- 17.2.1.1. Overview
- 17.2.1.2. Products
- 17.2.1.3. SWOT Analysis
- 17.2.1.4. Recent Developments
- 17.2.1.5. Financials (Based on Availability)
- 17.2.2 Coupa Software
- 17.2.2.1. Overview
- 17.2.2.2. Products
- 17.2.2.3. SWOT Analysis
- 17.2.2.4. Recent Developments
- 17.2.2.5. Financials (Based on Availability)
- 17.2.3 IBM Corporation
- 17.2.3.1. Overview
- 17.2.3.2. Products
- 17.2.3.3. SWOT Analysis
- 17.2.3.4. Recent Developments
- 17.2.3.5. Financials (Based on Availability)
- 17.2.4 Genpact
- 17.2.4.1. Overview
- 17.2.4.2. Products
- 17.2.4.3. SWOT Analysis
- 17.2.4.4. Recent Developments
- 17.2.4.5. Financials (Based on Availability)
- 17.2.5 Zycus Inc
- 17.2.5.1. Overview
- 17.2.5.2. Products
- 17.2.5.3. SWOT Analysis
- 17.2.5.4. Recent Developments
- 17.2.5.5. Financials (Based on Availability)
- 17.2.6 Oracle Corporation
- 17.2.6.1. Overview
- 17.2.6.2. Products
- 17.2.6.3. SWOT Analysis
- 17.2.6.4. Recent Developments
- 17.2.6.5. Financials (Based on Availability)
- 17.2.7 Empronc Solutions Pvt Ltd
- 17.2.7.1. Overview
- 17.2.7.2. Products
- 17.2.7.3. SWOT Analysis
- 17.2.7.4. Recent Developments
- 17.2.7.5. Financials (Based on Availability)
- 17.2.8 JAGGAER Incorporation
- 17.2.8.1. Overview
- 17.2.8.2. Products
- 17.2.8.3. SWOT Analysis
- 17.2.8.4. Recent Developments
- 17.2.8.5. Financials (Based on Availability)
- 17.2.9 Sievo Oy*List Not Exhaustive
- 17.2.9.1. Overview
- 17.2.9.2. Products
- 17.2.9.3. SWOT Analysis
- 17.2.9.4. Recent Developments
- 17.2.9.5. Financials (Based on Availability)
- 17.2.10 Proactis Inc
- 17.2.10.1. Overview
- 17.2.10.2. Products
- 17.2.10.3. SWOT Analysis
- 17.2.10.4. Recent Developments
- 17.2.10.5. Financials (Based on Availability)
- 17.2.11 SAP SE
- 17.2.11.1. Overview
- 17.2.11.2. Products
- 17.2.11.3. SWOT Analysis
- 17.2.11.4. Recent Developments
- 17.2.11.5. Financials (Based on Availability)
- 17.2.1 SAS Institute Inc
List of Figures
- Figure 1: Global Spend Analytics Technology Industry Revenue Breakdown (Million, %) by Region 2024 & 2032
- Figure 2: North America Spend Analytics Technology Industry Revenue (Million), by Country 2024 & 2032
- Figure 3: North America Spend Analytics Technology Industry Revenue Share (%), by Country 2024 & 2032
- Figure 4: Europe Spend Analytics Technology Industry Revenue (Million), by Country 2024 & 2032
- Figure 5: Europe Spend Analytics Technology Industry Revenue Share (%), by Country 2024 & 2032
- Figure 6: Asia Pacific Spend Analytics Technology Industry Revenue (Million), by Country 2024 & 2032
- Figure 7: Asia Pacific Spend Analytics Technology Industry Revenue Share (%), by Country 2024 & 2032
- Figure 8: South America Spend Analytics Technology Industry Revenue (Million), by Country 2024 & 2032
- Figure 9: South America Spend Analytics Technology Industry Revenue Share (%), by Country 2024 & 2032
- Figure 10: North America Spend Analytics Technology Industry Revenue (Million), by Country 2024 & 2032
- Figure 11: North America Spend Analytics Technology Industry Revenue Share (%), by Country 2024 & 2032
- Figure 12: MEA Spend Analytics Technology Industry Revenue (Million), by Country 2024 & 2032
- Figure 13: MEA Spend Analytics Technology Industry Revenue Share (%), by Country 2024 & 2032
- Figure 14: North America Spend Analytics Technology Industry Revenue (Million), by Type 2024 & 2032
- Figure 15: North America Spend Analytics Technology Industry Revenue Share (%), by Type 2024 & 2032
- Figure 16: North America Spend Analytics Technology Industry Revenue (Million), by Analysis 2024 & 2032
- Figure 17: North America Spend Analytics Technology Industry Revenue Share (%), by Analysis 2024 & 2032
- Figure 18: North America Spend Analytics Technology Industry Revenue (Million), by Deployment 2024 & 2032
- Figure 19: North America Spend Analytics Technology Industry Revenue Share (%), by Deployment 2024 & 2032
- Figure 20: North America Spend Analytics Technology Industry Revenue (Million), by End-user Industry 2024 & 2032
- Figure 21: North America Spend Analytics Technology Industry Revenue Share (%), by End-user Industry 2024 & 2032
- Figure 22: North America Spend Analytics Technology Industry Revenue (Million), by Country 2024 & 2032
- Figure 23: North America Spend Analytics Technology Industry Revenue Share (%), by Country 2024 & 2032
- Figure 24: Europe Spend Analytics Technology Industry Revenue (Million), by Type 2024 & 2032
- Figure 25: Europe Spend Analytics Technology Industry Revenue Share (%), by Type 2024 & 2032
- Figure 26: Europe Spend Analytics Technology Industry Revenue (Million), by Analysis 2024 & 2032
- Figure 27: Europe Spend Analytics Technology Industry Revenue Share (%), by Analysis 2024 & 2032
- Figure 28: Europe Spend Analytics Technology Industry Revenue (Million), by Deployment 2024 & 2032
- Figure 29: Europe Spend Analytics Technology Industry Revenue Share (%), by Deployment 2024 & 2032
- Figure 30: Europe Spend Analytics Technology Industry Revenue (Million), by End-user Industry 2024 & 2032
- Figure 31: Europe Spend Analytics Technology Industry Revenue Share (%), by End-user Industry 2024 & 2032
- Figure 32: Europe Spend Analytics Technology Industry Revenue (Million), by Country 2024 & 2032
- Figure 33: Europe Spend Analytics Technology Industry Revenue Share (%), by Country 2024 & 2032
- Figure 34: Asia Pacific Spend Analytics Technology Industry Revenue (Million), by Type 2024 & 2032
- Figure 35: Asia Pacific Spend Analytics Technology Industry Revenue Share (%), by Type 2024 & 2032
- Figure 36: Asia Pacific Spend Analytics Technology Industry Revenue (Million), by Analysis 2024 & 2032
- Figure 37: Asia Pacific Spend Analytics Technology Industry Revenue Share (%), by Analysis 2024 & 2032
- Figure 38: Asia Pacific Spend Analytics Technology Industry Revenue (Million), by Deployment 2024 & 2032
- Figure 39: Asia Pacific Spend Analytics Technology Industry Revenue Share (%), by Deployment 2024 & 2032
- Figure 40: Asia Pacific Spend Analytics Technology Industry Revenue (Million), by End-user Industry 2024 & 2032
- Figure 41: Asia Pacific Spend Analytics Technology Industry Revenue Share (%), by End-user Industry 2024 & 2032
- Figure 42: Asia Pacific Spend Analytics Technology Industry Revenue (Million), by Country 2024 & 2032
- Figure 43: Asia Pacific Spend Analytics Technology Industry Revenue Share (%), by Country 2024 & 2032
- Figure 44: Latin America Spend Analytics Technology Industry Revenue (Million), by Type 2024 & 2032
- Figure 45: Latin America Spend Analytics Technology Industry Revenue Share (%), by Type 2024 & 2032
- Figure 46: Latin America Spend Analytics Technology Industry Revenue (Million), by Analysis 2024 & 2032
- Figure 47: Latin America Spend Analytics Technology Industry Revenue Share (%), by Analysis 2024 & 2032
- Figure 48: Latin America Spend Analytics Technology Industry Revenue (Million), by Deployment 2024 & 2032
- Figure 49: Latin America Spend Analytics Technology Industry Revenue Share (%), by Deployment 2024 & 2032
- Figure 50: Latin America Spend Analytics Technology Industry Revenue (Million), by End-user Industry 2024 & 2032
- Figure 51: Latin America Spend Analytics Technology Industry Revenue Share (%), by End-user Industry 2024 & 2032
- Figure 52: Latin America Spend Analytics Technology Industry Revenue (Million), by Country 2024 & 2032
- Figure 53: Latin America Spend Analytics Technology Industry Revenue Share (%), by Country 2024 & 2032
- Figure 54: Middle East Spend Analytics Technology Industry Revenue (Million), by Type 2024 & 2032
- Figure 55: Middle East Spend Analytics Technology Industry Revenue Share (%), by Type 2024 & 2032
- Figure 56: Middle East Spend Analytics Technology Industry Revenue (Million), by Analysis 2024 & 2032
- Figure 57: Middle East Spend Analytics Technology Industry Revenue Share (%), by Analysis 2024 & 2032
- Figure 58: Middle East Spend Analytics Technology Industry Revenue (Million), by Deployment 2024 & 2032
- Figure 59: Middle East Spend Analytics Technology Industry Revenue Share (%), by Deployment 2024 & 2032
- Figure 60: Middle East Spend Analytics Technology Industry Revenue (Million), by End-user Industry 2024 & 2032
- Figure 61: Middle East Spend Analytics Technology Industry Revenue Share (%), by End-user Industry 2024 & 2032
- Figure 62: Middle East Spend Analytics Technology Industry Revenue (Million), by Country 2024 & 2032
- Figure 63: Middle East Spend Analytics Technology Industry Revenue Share (%), by Country 2024 & 2032
List of Tables
- Table 1: Global Spend Analytics Technology Industry Revenue Million Forecast, by Region 2019 & 2032
- Table 2: Global Spend Analytics Technology Industry Revenue Million Forecast, by Type 2019 & 2032
- Table 3: Global Spend Analytics Technology Industry Revenue Million Forecast, by Analysis 2019 & 2032
- Table 4: Global Spend Analytics Technology Industry Revenue Million Forecast, by Deployment 2019 & 2032
- Table 5: Global Spend Analytics Technology Industry Revenue Million Forecast, by End-user Industry 2019 & 2032
- Table 6: Global Spend Analytics Technology Industry Revenue Million Forecast, by Region 2019 & 2032
- Table 7: Global Spend Analytics Technology Industry Revenue Million Forecast, by Country 2019 & 2032
- Table 8: United States Spend Analytics Technology Industry Revenue (Million) Forecast, by Application 2019 & 2032
- Table 9: Canada Spend Analytics Technology Industry Revenue (Million) Forecast, by Application 2019 & 2032
- Table 10: Mexico Spend Analytics Technology Industry Revenue (Million) Forecast, by Application 2019 & 2032
- Table 11: Global Spend Analytics Technology Industry Revenue Million Forecast, by Country 2019 & 2032
- Table 12: Germany Spend Analytics Technology Industry Revenue (Million) Forecast, by Application 2019 & 2032
- Table 13: United Kingdom Spend Analytics Technology Industry Revenue (Million) Forecast, by Application 2019 & 2032
- Table 14: France Spend Analytics Technology Industry Revenue (Million) Forecast, by Application 2019 & 2032
- Table 15: Spain Spend Analytics Technology Industry Revenue (Million) Forecast, by Application 2019 & 2032
- Table 16: Italy Spend Analytics Technology Industry Revenue (Million) Forecast, by Application 2019 & 2032
- Table 17: Spain Spend Analytics Technology Industry Revenue (Million) Forecast, by Application 2019 & 2032
- Table 18: Belgium Spend Analytics Technology Industry Revenue (Million) Forecast, by Application 2019 & 2032
- Table 19: Netherland Spend Analytics Technology Industry Revenue (Million) Forecast, by Application 2019 & 2032
- Table 20: Nordics Spend Analytics Technology Industry Revenue (Million) Forecast, by Application 2019 & 2032
- Table 21: Rest of Europe Spend Analytics Technology Industry Revenue (Million) Forecast, by Application 2019 & 2032
- Table 22: Global Spend Analytics Technology Industry Revenue Million Forecast, by Country 2019 & 2032
- Table 23: China Spend Analytics Technology Industry Revenue (Million) Forecast, by Application 2019 & 2032
- Table 24: Japan Spend Analytics Technology Industry Revenue (Million) Forecast, by Application 2019 & 2032
- Table 25: India Spend Analytics Technology Industry Revenue (Million) Forecast, by Application 2019 & 2032
- Table 26: South Korea Spend Analytics Technology Industry Revenue (Million) Forecast, by Application 2019 & 2032
- Table 27: Southeast Asia Spend Analytics Technology Industry Revenue (Million) Forecast, by Application 2019 & 2032
- Table 28: Australia Spend Analytics Technology Industry Revenue (Million) Forecast, by Application 2019 & 2032
- Table 29: Indonesia Spend Analytics Technology Industry Revenue (Million) Forecast, by Application 2019 & 2032
- Table 30: Phillipes Spend Analytics Technology Industry Revenue (Million) Forecast, by Application 2019 & 2032
- Table 31: Singapore Spend Analytics Technology Industry Revenue (Million) Forecast, by Application 2019 & 2032
- Table 32: Thailandc Spend Analytics Technology Industry Revenue (Million) Forecast, by Application 2019 & 2032
- Table 33: Rest of Asia Pacific Spend Analytics Technology Industry Revenue (Million) Forecast, by Application 2019 & 2032
- Table 34: Global Spend Analytics Technology Industry Revenue Million Forecast, by Country 2019 & 2032
- Table 35: Brazil Spend Analytics Technology Industry Revenue (Million) Forecast, by Application 2019 & 2032
- Table 36: Argentina Spend Analytics Technology Industry Revenue (Million) Forecast, by Application 2019 & 2032
- Table 37: Peru Spend Analytics Technology Industry Revenue (Million) Forecast, by Application 2019 & 2032
- Table 38: Chile Spend Analytics Technology Industry Revenue (Million) Forecast, by Application 2019 & 2032
- Table 39: Colombia Spend Analytics Technology Industry Revenue (Million) Forecast, by Application 2019 & 2032
- Table 40: Ecuador Spend Analytics Technology Industry Revenue (Million) Forecast, by Application 2019 & 2032
- Table 41: Venezuela Spend Analytics Technology Industry Revenue (Million) Forecast, by Application 2019 & 2032
- Table 42: Rest of South America Spend Analytics Technology Industry Revenue (Million) Forecast, by Application 2019 & 2032
- Table 43: Global Spend Analytics Technology Industry Revenue Million Forecast, by Country 2019 & 2032
- Table 44: United States Spend Analytics Technology Industry Revenue (Million) Forecast, by Application 2019 & 2032
- Table 45: Canada Spend Analytics Technology Industry Revenue (Million) Forecast, by Application 2019 & 2032
- Table 46: Mexico Spend Analytics Technology Industry Revenue (Million) Forecast, by Application 2019 & 2032
- Table 47: Global Spend Analytics Technology Industry Revenue Million Forecast, by Country 2019 & 2032
- Table 48: United Arab Emirates Spend Analytics Technology Industry Revenue (Million) Forecast, by Application 2019 & 2032
- Table 49: Saudi Arabia Spend Analytics Technology Industry Revenue (Million) Forecast, by Application 2019 & 2032
- Table 50: South Africa Spend Analytics Technology Industry Revenue (Million) Forecast, by Application 2019 & 2032
- Table 51: Rest of Middle East and Africa Spend Analytics Technology Industry Revenue (Million) Forecast, by Application 2019 & 2032
- Table 52: Global Spend Analytics Technology Industry Revenue Million Forecast, by Type 2019 & 2032
- Table 53: Global Spend Analytics Technology Industry Revenue Million Forecast, by Analysis 2019 & 2032
- Table 54: Global Spend Analytics Technology Industry Revenue Million Forecast, by Deployment 2019 & 2032
- Table 55: Global Spend Analytics Technology Industry Revenue Million Forecast, by End-user Industry 2019 & 2032
- Table 56: Global Spend Analytics Technology Industry Revenue Million Forecast, by Country 2019 & 2032
- Table 57: Global Spend Analytics Technology Industry Revenue Million Forecast, by Type 2019 & 2032
- Table 58: Global Spend Analytics Technology Industry Revenue Million Forecast, by Analysis 2019 & 2032
- Table 59: Global Spend Analytics Technology Industry Revenue Million Forecast, by Deployment 2019 & 2032
- Table 60: Global Spend Analytics Technology Industry Revenue Million Forecast, by End-user Industry 2019 & 2032
- Table 61: Global Spend Analytics Technology Industry Revenue Million Forecast, by Country 2019 & 2032
- Table 62: Global Spend Analytics Technology Industry Revenue Million Forecast, by Type 2019 & 2032
- Table 63: Global Spend Analytics Technology Industry Revenue Million Forecast, by Analysis 2019 & 2032
- Table 64: Global Spend Analytics Technology Industry Revenue Million Forecast, by Deployment 2019 & 2032
- Table 65: Global Spend Analytics Technology Industry Revenue Million Forecast, by End-user Industry 2019 & 2032
- Table 66: Global Spend Analytics Technology Industry Revenue Million Forecast, by Country 2019 & 2032
- Table 67: Global Spend Analytics Technology Industry Revenue Million Forecast, by Type 2019 & 2032
- Table 68: Global Spend Analytics Technology Industry Revenue Million Forecast, by Analysis 2019 & 2032
- Table 69: Global Spend Analytics Technology Industry Revenue Million Forecast, by Deployment 2019 & 2032
- Table 70: Global Spend Analytics Technology Industry Revenue Million Forecast, by End-user Industry 2019 & 2032
- Table 71: Global Spend Analytics Technology Industry Revenue Million Forecast, by Country 2019 & 2032
- Table 72: Global Spend Analytics Technology Industry Revenue Million Forecast, by Type 2019 & 2032
- Table 73: Global Spend Analytics Technology Industry Revenue Million Forecast, by Analysis 2019 & 2032
- Table 74: Global Spend Analytics Technology Industry Revenue Million Forecast, by Deployment 2019 & 2032
- Table 75: Global Spend Analytics Technology Industry Revenue Million Forecast, by End-user Industry 2019 & 2032
- Table 76: Global Spend Analytics Technology Industry Revenue Million Forecast, by Country 2019 & 2032
Frequently Asked Questions
1. What is the projected Compound Annual Growth Rate (CAGR) of the Spend Analytics Technology Industry?
The projected CAGR is approximately 17.90%.
2. Which companies are prominent players in the Spend Analytics Technology Industry?
Key companies in the market include SAS Institute Inc, Coupa Software, IBM Corporation, Genpact, Zycus Inc, Oracle Corporation, Empronc Solutions Pvt Ltd, JAGGAER Incorporation, Sievo Oy*List Not Exhaustive, Proactis Inc, SAP SE.
3. What are the main segments of the Spend Analytics Technology Industry?
The market segments include Type, Analysis, Deployment, End-user Industry.
4. Can you provide details about the market size?
The market size is estimated to be USD XX Million as of 2022.
5. What are some drivers contributing to market growth?
Rising Adoption in Procurement Process in Industries; Rising Adoption of Cloud Services and Increasing Penetration of IoT Applications.
6. What are the notable trends driving market growth?
Retail Segment is Expected to Hold Significant Share.
7. Are there any restraints impacting market growth?
Growing Data Breaches Cases.
8. Can you provide examples of recent developments in the market?
July 2022 - SAP SE announced the acquisition of Askdata, a startup specializing in search-driven analytics. SAP increases its capabilities to help enterprises make better-informed decisions by employing AI-driven natural language searches with the purchase of Askdata. Users may search, interact, and collaborate on real data to gain the most business insights.
9. What pricing options are available for accessing the report?
Pricing options include single-user, multi-user, and enterprise licenses priced at USD 4750, USD 5250, and USD 8750 respectively.
10. Is the market size provided in terms of value or volume?
The market size is provided in terms of value, measured in Million.
11. Are there any specific market keywords associated with the report?
Yes, the market keyword associated with the report is "Spend Analytics Technology Industry," which aids in identifying and referencing the specific market segment covered.
12. How do I determine which pricing option suits my needs best?
The pricing options vary based on user requirements and access needs. Individual users may opt for single-user licenses, while businesses requiring broader access may choose multi-user or enterprise licenses for cost-effective access to the report.
13. Are there any additional resources or data provided in the Spend Analytics Technology Industry report?
While the report offers comprehensive insights, it's advisable to review the specific contents or supplementary materials provided to ascertain if additional resources or data are available.
14. How can I stay updated on further developments or reports in the Spend Analytics Technology Industry?
To stay informed about further developments, trends, and reports in the Spend Analytics Technology Industry, consider subscribing to industry newsletters, following relevant companies and organizations, or regularly checking reputable industry news sources and publications.
Methodology
Step 1 - Identification of Relevant Samples Size from Population Database


Step 2 - Approaches for Defining Global Market Size (Value, Volume* & Price*)

Note*: In applicable scenarios
Step 3 - Data Sources
Primary Research
- Web Analytics
- Survey Reports
- Research Institute
- Latest Research Reports
- Opinion Leaders
Secondary Research
- Annual Reports
- White Paper
- Latest Press Release
- Industry Association
- Paid Database
- Investor Presentations

Step 4 - Data Triangulation
Involves using different sources of information in order to increase the validity of a study
These sources are likely to be stakeholders in a program - participants, other researchers, program staff, other community members, and so on.
Then we put all data in single framework & apply various statistical tools to find out the dynamic on the market.
During the analysis stage, feedback from the stakeholder groups would be compared to determine areas of agreement as well as areas of divergence
