

Key Insights
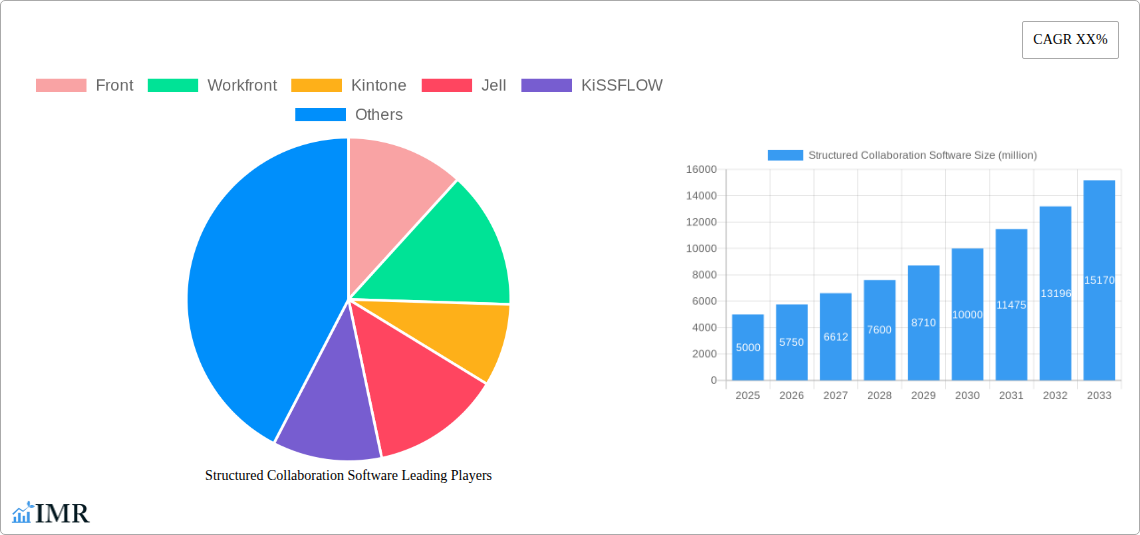
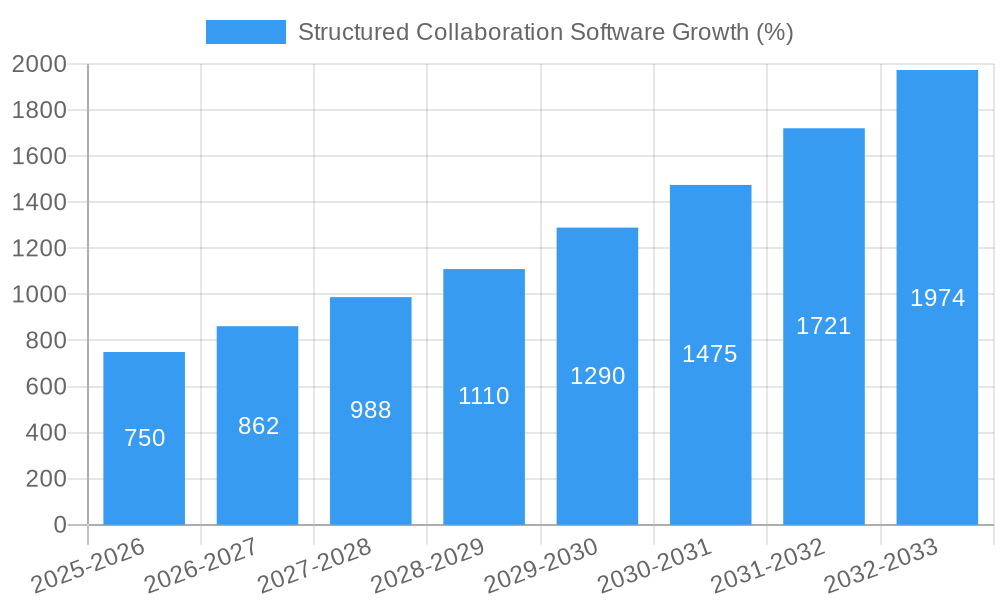
The structured collaboration software market is experiencing robust growth, driven by the increasing need for efficient teamwork and streamlined workflows across diverse industries. The market, estimated at $5 billion in 2025, is projected to exhibit a Compound Annual Growth Rate (CAGR) of 15% from 2025 to 2033, reaching approximately $15 billion by 2033. This expansion is fueled by several key factors. The rising adoption of cloud-based solutions offers scalability and accessibility, enhancing collaboration among geographically dispersed teams. Furthermore, the growing demand for improved project management capabilities and enhanced data security is significantly bolstering market growth. The integration of AI and automation functionalities within structured collaboration platforms is further streamlining processes, boosting productivity, and attracting businesses of all sizes. The market is segmented by deployment type (cloud, on-premise), industry (healthcare, education, finance), and organization size (small, medium, large).
Key players like Front, Workfront, Kintone, Jell, KiSSFLOW, Stride, Nextinit, Pinstriped, AchieveIt, and SpiderOak are actively shaping the market landscape through continuous innovation and strategic partnerships. However, factors such as the complexity of integration with existing systems and the potential for high initial investment costs can act as restraints. Nevertheless, the long-term benefits of improved communication, increased efficiency, and reduced operational costs are outweighing these challenges, ensuring the continued expansion of this dynamic market segment. The increasing emphasis on remote work and hybrid work models further fuels demand, making structured collaboration tools indispensable for businesses aiming to maintain productivity and employee engagement.
Structured Collaboration Software Market Report: 2019-2033
This comprehensive report provides an in-depth analysis of the Structured Collaboration Software market, encompassing market dynamics, growth trends, regional analysis, product landscape, key players, and future outlook. The study period covers 2019-2033, with 2025 as the base and estimated year, and a forecast period of 2025-2033. The report caters to industry professionals, investors, and strategists seeking actionable insights into this rapidly evolving market. The parent market is Enterprise Software, while the child market is Collaboration Software. Market value is presented in million units.
Structured Collaboration Software Market Dynamics & Structure
This section analyzes the competitive landscape, technological advancements, regulatory influences, and market trends within the structured collaboration software market. The market is characterized by moderate concentration, with key players vying for market share. The report quantifies market share percentages for leading vendors and analyzes the volume of M&A activities during the historical period.
- Market Concentration: Moderate, with the top 5 players holding approximately xx% of the market share in 2024.
- Technological Innovation Drivers: AI-powered automation, enhanced security features, and integration with other enterprise software are key drivers.
- Regulatory Frameworks: Data privacy regulations (e.g., GDPR, CCPA) significantly impact the market and influence software development.
- Competitive Product Substitutes: General-purpose collaboration tools pose a competitive threat.
- End-User Demographics: The market is primarily driven by large enterprises and SMEs across various industries.
- M&A Trends: xx M&A deals were recorded between 2019 and 2024, indicating a consolidating market. Innovation barriers include integrating legacy systems and maintaining data security across disparate platforms.
Structured Collaboration Software Growth Trends & Insights
Leveraging proprietary data and market research, this section provides a detailed analysis of the market size evolution, adoption rates, technological disruptions, and shifts in consumer behavior. The report projects a Compound Annual Growth Rate (CAGR) of xx% during the forecast period (2025-2033). Market penetration is currently at xx% and is expected to reach xx% by 2033. Technological disruptions, such as the rise of cloud-based solutions and AI integration, are profoundly influencing market growth. Consumer behavior is shifting towards more intuitive and user-friendly interfaces with enhanced security.
Dominant Regions, Countries, or Segments in Structured Collaboration Software
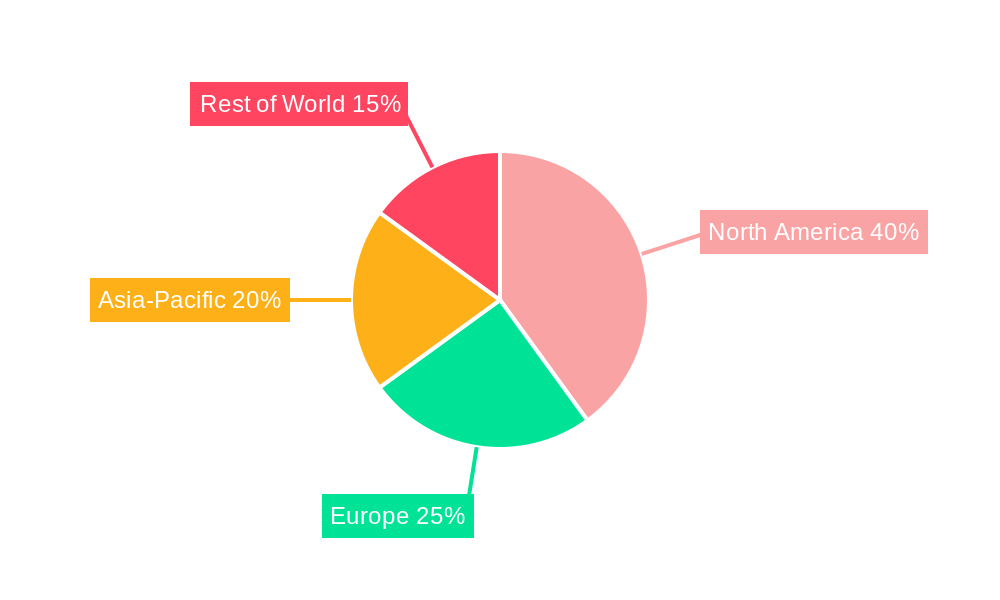
This section identifies the leading geographical regions and market segments driving market growth. North America currently holds the largest market share, driven by high adoption rates among large enterprises and a strong technological infrastructure.
- Key Drivers (North America): Strong technological infrastructure, high adoption rates among enterprises, and a robust venture capital ecosystem.
- Dominance Factors: Early adoption of cloud-based solutions, high spending on IT infrastructure, and presence of major players.
- Growth Potential: Continued growth is anticipated, fueled by increasing digital transformation initiatives and demand for enhanced collaboration tools. Other regions, such as Europe and Asia-Pacific, exhibit strong growth potential driven by increasing internet penetration and digital adoption rates.
Structured Collaboration Software Product Landscape
The market offers a diverse range of products, from basic project management tools to sophisticated enterprise-grade collaboration platforms. Recent innovations include AI-powered features for task automation and improved workflow management, enhanced security protocols, and seamless integration with other enterprise applications. These features are presented as unique selling propositions, setting these solutions apart from more general-purpose collaboration tools.
Key Drivers, Barriers & Challenges in Structured Collaboration Software
Key Drivers: Increasing need for enhanced collaboration across distributed teams, the rise of remote work, and the demand for improved project management tools. Technological advancements, such as AI and cloud computing, are further propelling market growth.
Key Challenges & Restraints: High implementation costs, integration complexities with legacy systems, and concerns regarding data security and privacy are significant challenges. Competitive pressures from general-purpose collaboration tools and the need to comply with evolving data privacy regulations also present hurdles. Supply chain disruptions could impact software delivery and implementation.
Emerging Opportunities in Structured Collaboration Software
The market presents several emerging opportunities, including the untapped potential in the small and medium-sized enterprise (SME) segment, the growing demand for industry-specific solutions, and the integration of extended reality (XR) technologies for immersive collaboration.
Growth Accelerators in the Structured Collaboration Software Industry
Strategic partnerships, technological advancements, and expansion into new geographical markets are key growth accelerators. The development of AI-powered features is enhancing user experience and driving efficiency, while strategic partnerships enable broader market reach.
Key Players Shaping the Structured Collaboration Software Market
Notable Milestones in Structured Collaboration Software Sector
- 2020 Q4: Significant increase in adoption of cloud-based collaboration solutions due to the pandemic.
- 2022 Q1: Launch of several AI-powered features by major players, enhancing task automation and workflow management.
- 2023 Q3: Several key M&A transactions consolidating market share among major players.
In-Depth Structured Collaboration Software Market Outlook
The structured collaboration software market is poised for significant growth, driven by continuous technological advancements, increasing adoption among enterprises, and the expansion into new geographical markets. The focus on AI-powered features, enhanced security, and seamless integration with other enterprise applications will further fuel this growth. Strategic partnerships and effective marketing strategies will be crucial for market players to capitalize on the vast growth opportunities in this dynamic sector.
Structured Collaboration Software Segmentation
-
1. Application
- 1.1. SMEs
- 1.2. Large Enterprises
-
2. Types
- 2.1. Cloud Based
- 2.2. On-Premises
Structured Collaboration Software Segmentation By Geography
-
1. North America
- 1.1. United States
- 1.2. Canada
- 1.3. Mexico
-
2. South America
- 2.1. Brazil
- 2.2. Argentina
- 2.3. Rest of South America
-
3. Europe
- 3.1. United Kingdom
- 3.2. Germany
- 3.3. France
- 3.4. Italy
- 3.5. Spain
- 3.6. Russia
- 3.7. Benelux
- 3.8. Nordics
- 3.9. Rest of Europe
-
4. Middle East & Africa
- 4.1. Turkey
- 4.2. Israel
- 4.3. GCC
- 4.4. North Africa
- 4.5. South Africa
- 4.6. Rest of Middle East & Africa
-
5. Asia Pacific
- 5.1. China
- 5.2. India
- 5.3. Japan
- 5.4. South Korea
- 5.5. ASEAN
- 5.6. Oceania
- 5.7. Rest of Asia Pacific
Structured Collaboration Software REPORT HIGHLIGHTS
| Aspects | Details |
|---|---|
| Study Period | 2019-2033 |
| Base Year | 2024 |
| Estimated Year | 2025 |
| Forecast Period | 2025-2033 |
| Historical Period | 2019-2024 |
| Growth Rate | CAGR of XX% from 2019-2033 |
| Segmentation |
|
Table of Contents
- 1. Introduction
- 1.1. Research Scope
- 1.2. Market Segmentation
- 1.3. Research Methodology
- 1.4. Definitions and Assumptions
- 2. Executive Summary
- 2.1. Introduction
- 3. Market Dynamics
- 3.1. Introduction
- 3.2. Market Drivers
- 3.3. Market Restrains
- 3.4. Market Trends
- 4. Market Factor Analysis
- 4.1. Porters Five Forces
- 4.2. Supply/Value Chain
- 4.3. PESTEL analysis
- 4.4. Market Entropy
- 4.5. Patent/Trademark Analysis
- 5. Global Structured Collaboration Software Analysis, Insights and Forecast, 2019-2031
- 5.1. Market Analysis, Insights and Forecast - by Application
- 5.1.1. SMEs
- 5.1.2. Large Enterprises
- 5.2. Market Analysis, Insights and Forecast - by Types
- 5.2.1. Cloud Based
- 5.2.2. On-Premises
- 5.3. Market Analysis, Insights and Forecast - by Region
- 5.3.1. North America
- 5.3.2. South America
- 5.3.3. Europe
- 5.3.4. Middle East & Africa
- 5.3.5. Asia Pacific
- 5.1. Market Analysis, Insights and Forecast - by Application
- 6. North America Structured Collaboration Software Analysis, Insights and Forecast, 2019-2031
- 6.1. Market Analysis, Insights and Forecast - by Application
- 6.1.1. SMEs
- 6.1.2. Large Enterprises
- 6.2. Market Analysis, Insights and Forecast - by Types
- 6.2.1. Cloud Based
- 6.2.2. On-Premises
- 6.1. Market Analysis, Insights and Forecast - by Application
- 7. South America Structured Collaboration Software Analysis, Insights and Forecast, 2019-2031
- 7.1. Market Analysis, Insights and Forecast - by Application
- 7.1.1. SMEs
- 7.1.2. Large Enterprises
- 7.2. Market Analysis, Insights and Forecast - by Types
- 7.2.1. Cloud Based
- 7.2.2. On-Premises
- 7.1. Market Analysis, Insights and Forecast - by Application
- 8. Europe Structured Collaboration Software Analysis, Insights and Forecast, 2019-2031
- 8.1. Market Analysis, Insights and Forecast - by Application
- 8.1.1. SMEs
- 8.1.2. Large Enterprises
- 8.2. Market Analysis, Insights and Forecast - by Types
- 8.2.1. Cloud Based
- 8.2.2. On-Premises
- 8.1. Market Analysis, Insights and Forecast - by Application
- 9. Middle East & Africa Structured Collaboration Software Analysis, Insights and Forecast, 2019-2031
- 9.1. Market Analysis, Insights and Forecast - by Application
- 9.1.1. SMEs
- 9.1.2. Large Enterprises
- 9.2. Market Analysis, Insights and Forecast - by Types
- 9.2.1. Cloud Based
- 9.2.2. On-Premises
- 9.1. Market Analysis, Insights and Forecast - by Application
- 10. Asia Pacific Structured Collaboration Software Analysis, Insights and Forecast, 2019-2031
- 10.1. Market Analysis, Insights and Forecast - by Application
- 10.1.1. SMEs
- 10.1.2. Large Enterprises
- 10.2. Market Analysis, Insights and Forecast - by Types
- 10.2.1. Cloud Based
- 10.2.2. On-Premises
- 10.1. Market Analysis, Insights and Forecast - by Application
- 11. Competitive Analysis
- 11.1. Global Market Share Analysis 2024
- 11.2. Company Profiles
- 11.2.1 Front
- 11.2.1.1. Overview
- 11.2.1.2. Products
- 11.2.1.3. SWOT Analysis
- 11.2.1.4. Recent Developments
- 11.2.1.5. Financials (Based on Availability)
- 11.2.2 Workfront
- 11.2.2.1. Overview
- 11.2.2.2. Products
- 11.2.2.3. SWOT Analysis
- 11.2.2.4. Recent Developments
- 11.2.2.5. Financials (Based on Availability)
- 11.2.3 Kintone
- 11.2.3.1. Overview
- 11.2.3.2. Products
- 11.2.3.3. SWOT Analysis
- 11.2.3.4. Recent Developments
- 11.2.3.5. Financials (Based on Availability)
- 11.2.4 Jell
- 11.2.4.1. Overview
- 11.2.4.2. Products
- 11.2.4.3. SWOT Analysis
- 11.2.4.4. Recent Developments
- 11.2.4.5. Financials (Based on Availability)
- 11.2.5 KiSSFLOW
- 11.2.5.1. Overview
- 11.2.5.2. Products
- 11.2.5.3. SWOT Analysis
- 11.2.5.4. Recent Developments
- 11.2.5.5. Financials (Based on Availability)
- 11.2.6 Stride
- 11.2.6.1. Overview
- 11.2.6.2. Products
- 11.2.6.3. SWOT Analysis
- 11.2.6.4. Recent Developments
- 11.2.6.5. Financials (Based on Availability)
- 11.2.7 Nextinit
- 11.2.7.1. Overview
- 11.2.7.2. Products
- 11.2.7.3. SWOT Analysis
- 11.2.7.4. Recent Developments
- 11.2.7.5. Financials (Based on Availability)
- 11.2.8 Pinstriped
- 11.2.8.1. Overview
- 11.2.8.2. Products
- 11.2.8.3. SWOT Analysis
- 11.2.8.4. Recent Developments
- 11.2.8.5. Financials (Based on Availability)
- 11.2.9 AchieveIt
- 11.2.9.1. Overview
- 11.2.9.2. Products
- 11.2.9.3. SWOT Analysis
- 11.2.9.4. Recent Developments
- 11.2.9.5. Financials (Based on Availability)
- 11.2.10 SpiderOak
- 11.2.10.1. Overview
- 11.2.10.2. Products
- 11.2.10.3. SWOT Analysis
- 11.2.10.4. Recent Developments
- 11.2.10.5. Financials (Based on Availability)
- 11.2.1 Front
List of Figures
- Figure 1: Global Structured Collaboration Software Revenue Breakdown (million, %) by Region 2024 & 2032
- Figure 2: North America Structured Collaboration Software Revenue (million), by Application 2024 & 2032
- Figure 3: North America Structured Collaboration Software Revenue Share (%), by Application 2024 & 2032
- Figure 4: North America Structured Collaboration Software Revenue (million), by Types 2024 & 2032
- Figure 5: North America Structured Collaboration Software Revenue Share (%), by Types 2024 & 2032
- Figure 6: North America Structured Collaboration Software Revenue (million), by Country 2024 & 2032
- Figure 7: North America Structured Collaboration Software Revenue Share (%), by Country 2024 & 2032
- Figure 8: South America Structured Collaboration Software Revenue (million), by Application 2024 & 2032
- Figure 9: South America Structured Collaboration Software Revenue Share (%), by Application 2024 & 2032
- Figure 10: South America Structured Collaboration Software Revenue (million), by Types 2024 & 2032
- Figure 11: South America Structured Collaboration Software Revenue Share (%), by Types 2024 & 2032
- Figure 12: South America Structured Collaboration Software Revenue (million), by Country 2024 & 2032
- Figure 13: South America Structured Collaboration Software Revenue Share (%), by Country 2024 & 2032
- Figure 14: Europe Structured Collaboration Software Revenue (million), by Application 2024 & 2032
- Figure 15: Europe Structured Collaboration Software Revenue Share (%), by Application 2024 & 2032
- Figure 16: Europe Structured Collaboration Software Revenue (million), by Types 2024 & 2032
- Figure 17: Europe Structured Collaboration Software Revenue Share (%), by Types 2024 & 2032
- Figure 18: Europe Structured Collaboration Software Revenue (million), by Country 2024 & 2032
- Figure 19: Europe Structured Collaboration Software Revenue Share (%), by Country 2024 & 2032
- Figure 20: Middle East & Africa Structured Collaboration Software Revenue (million), by Application 2024 & 2032
- Figure 21: Middle East & Africa Structured Collaboration Software Revenue Share (%), by Application 2024 & 2032
- Figure 22: Middle East & Africa Structured Collaboration Software Revenue (million), by Types 2024 & 2032
- Figure 23: Middle East & Africa Structured Collaboration Software Revenue Share (%), by Types 2024 & 2032
- Figure 24: Middle East & Africa Structured Collaboration Software Revenue (million), by Country 2024 & 2032
- Figure 25: Middle East & Africa Structured Collaboration Software Revenue Share (%), by Country 2024 & 2032
- Figure 26: Asia Pacific Structured Collaboration Software Revenue (million), by Application 2024 & 2032
- Figure 27: Asia Pacific Structured Collaboration Software Revenue Share (%), by Application 2024 & 2032
- Figure 28: Asia Pacific Structured Collaboration Software Revenue (million), by Types 2024 & 2032
- Figure 29: Asia Pacific Structured Collaboration Software Revenue Share (%), by Types 2024 & 2032
- Figure 30: Asia Pacific Structured Collaboration Software Revenue (million), by Country 2024 & 2032
- Figure 31: Asia Pacific Structured Collaboration Software Revenue Share (%), by Country 2024 & 2032
List of Tables
- Table 1: Global Structured Collaboration Software Revenue million Forecast, by Region 2019 & 2032
- Table 2: Global Structured Collaboration Software Revenue million Forecast, by Application 2019 & 2032
- Table 3: Global Structured Collaboration Software Revenue million Forecast, by Types 2019 & 2032
- Table 4: Global Structured Collaboration Software Revenue million Forecast, by Region 2019 & 2032
- Table 5: Global Structured Collaboration Software Revenue million Forecast, by Application 2019 & 2032
- Table 6: Global Structured Collaboration Software Revenue million Forecast, by Types 2019 & 2032
- Table 7: Global Structured Collaboration Software Revenue million Forecast, by Country 2019 & 2032
- Table 8: United States Structured Collaboration Software Revenue (million) Forecast, by Application 2019 & 2032
- Table 9: Canada Structured Collaboration Software Revenue (million) Forecast, by Application 2019 & 2032
- Table 10: Mexico Structured Collaboration Software Revenue (million) Forecast, by Application 2019 & 2032
- Table 11: Global Structured Collaboration Software Revenue million Forecast, by Application 2019 & 2032
- Table 12: Global Structured Collaboration Software Revenue million Forecast, by Types 2019 & 2032
- Table 13: Global Structured Collaboration Software Revenue million Forecast, by Country 2019 & 2032
- Table 14: Brazil Structured Collaboration Software Revenue (million) Forecast, by Application 2019 & 2032
- Table 15: Argentina Structured Collaboration Software Revenue (million) Forecast, by Application 2019 & 2032
- Table 16: Rest of South America Structured Collaboration Software Revenue (million) Forecast, by Application 2019 & 2032
- Table 17: Global Structured Collaboration Software Revenue million Forecast, by Application 2019 & 2032
- Table 18: Global Structured Collaboration Software Revenue million Forecast, by Types 2019 & 2032
- Table 19: Global Structured Collaboration Software Revenue million Forecast, by Country 2019 & 2032
- Table 20: United Kingdom Structured Collaboration Software Revenue (million) Forecast, by Application 2019 & 2032
- Table 21: Germany Structured Collaboration Software Revenue (million) Forecast, by Application 2019 & 2032
- Table 22: France Structured Collaboration Software Revenue (million) Forecast, by Application 2019 & 2032
- Table 23: Italy Structured Collaboration Software Revenue (million) Forecast, by Application 2019 & 2032
- Table 24: Spain Structured Collaboration Software Revenue (million) Forecast, by Application 2019 & 2032
- Table 25: Russia Structured Collaboration Software Revenue (million) Forecast, by Application 2019 & 2032
- Table 26: Benelux Structured Collaboration Software Revenue (million) Forecast, by Application 2019 & 2032
- Table 27: Nordics Structured Collaboration Software Revenue (million) Forecast, by Application 2019 & 2032
- Table 28: Rest of Europe Structured Collaboration Software Revenue (million) Forecast, by Application 2019 & 2032
- Table 29: Global Structured Collaboration Software Revenue million Forecast, by Application 2019 & 2032
- Table 30: Global Structured Collaboration Software Revenue million Forecast, by Types 2019 & 2032
- Table 31: Global Structured Collaboration Software Revenue million Forecast, by Country 2019 & 2032
- Table 32: Turkey Structured Collaboration Software Revenue (million) Forecast, by Application 2019 & 2032
- Table 33: Israel Structured Collaboration Software Revenue (million) Forecast, by Application 2019 & 2032
- Table 34: GCC Structured Collaboration Software Revenue (million) Forecast, by Application 2019 & 2032
- Table 35: North Africa Structured Collaboration Software Revenue (million) Forecast, by Application 2019 & 2032
- Table 36: South Africa Structured Collaboration Software Revenue (million) Forecast, by Application 2019 & 2032
- Table 37: Rest of Middle East & Africa Structured Collaboration Software Revenue (million) Forecast, by Application 2019 & 2032
- Table 38: Global Structured Collaboration Software Revenue million Forecast, by Application 2019 & 2032
- Table 39: Global Structured Collaboration Software Revenue million Forecast, by Types 2019 & 2032
- Table 40: Global Structured Collaboration Software Revenue million Forecast, by Country 2019 & 2032
- Table 41: China Structured Collaboration Software Revenue (million) Forecast, by Application 2019 & 2032
- Table 42: India Structured Collaboration Software Revenue (million) Forecast, by Application 2019 & 2032
- Table 43: Japan Structured Collaboration Software Revenue (million) Forecast, by Application 2019 & 2032
- Table 44: South Korea Structured Collaboration Software Revenue (million) Forecast, by Application 2019 & 2032
- Table 45: ASEAN Structured Collaboration Software Revenue (million) Forecast, by Application 2019 & 2032
- Table 46: Oceania Structured Collaboration Software Revenue (million) Forecast, by Application 2019 & 2032
- Table 47: Rest of Asia Pacific Structured Collaboration Software Revenue (million) Forecast, by Application 2019 & 2032
Frequently Asked Questions
1. What is the projected Compound Annual Growth Rate (CAGR) of the Structured Collaboration Software?
The projected CAGR is approximately XX%.
2. Which companies are prominent players in the Structured Collaboration Software?
Key companies in the market include Front, Workfront, Kintone, Jell, KiSSFLOW, Stride, Nextinit, Pinstriped, AchieveIt, SpiderOak.
3. What are the main segments of the Structured Collaboration Software?
The market segments include Application, Types.
4. Can you provide details about the market size?
The market size is estimated to be USD XXX million as of 2022.
5. What are some drivers contributing to market growth?
N/A
6. What are the notable trends driving market growth?
N/A
7. Are there any restraints impacting market growth?
N/A
8. Can you provide examples of recent developments in the market?
N/A
9. What pricing options are available for accessing the report?
Pricing options include single-user, multi-user, and enterprise licenses priced at USD 4900.00, USD 7350.00, and USD 9800.00 respectively.
10. Is the market size provided in terms of value or volume?
The market size is provided in terms of value, measured in million.
11. Are there any specific market keywords associated with the report?
Yes, the market keyword associated with the report is "Structured Collaboration Software," which aids in identifying and referencing the specific market segment covered.
12. How do I determine which pricing option suits my needs best?
The pricing options vary based on user requirements and access needs. Individual users may opt for single-user licenses, while businesses requiring broader access may choose multi-user or enterprise licenses for cost-effective access to the report.
13. Are there any additional resources or data provided in the Structured Collaboration Software report?
While the report offers comprehensive insights, it's advisable to review the specific contents or supplementary materials provided to ascertain if additional resources or data are available.
14. How can I stay updated on further developments or reports in the Structured Collaboration Software?
To stay informed about further developments, trends, and reports in the Structured Collaboration Software, consider subscribing to industry newsletters, following relevant companies and organizations, or regularly checking reputable industry news sources and publications.
Methodology
Step 1 - Identification of Relevant Samples Size from Population Database


Step 2 - Approaches for Defining Global Market Size (Value, Volume* & Price*)

Note*: In applicable scenarios
Step 3 - Data Sources
Primary Research
- Web Analytics
- Survey Reports
- Research Institute
- Latest Research Reports
- Opinion Leaders
Secondary Research
- Annual Reports
- White Paper
- Latest Press Release
- Industry Association
- Paid Database
- Investor Presentations

Step 4 - Data Triangulation
Involves using different sources of information in order to increase the validity of a study
These sources are likely to be stakeholders in a program - participants, other researchers, program staff, other community members, and so on.
Then we put all data in single framework & apply various statistical tools to find out the dynamic on the market.
During the analysis stage, feedback from the stakeholder groups would be compared to determine areas of agreement as well as areas of divergence
