

Key Insights
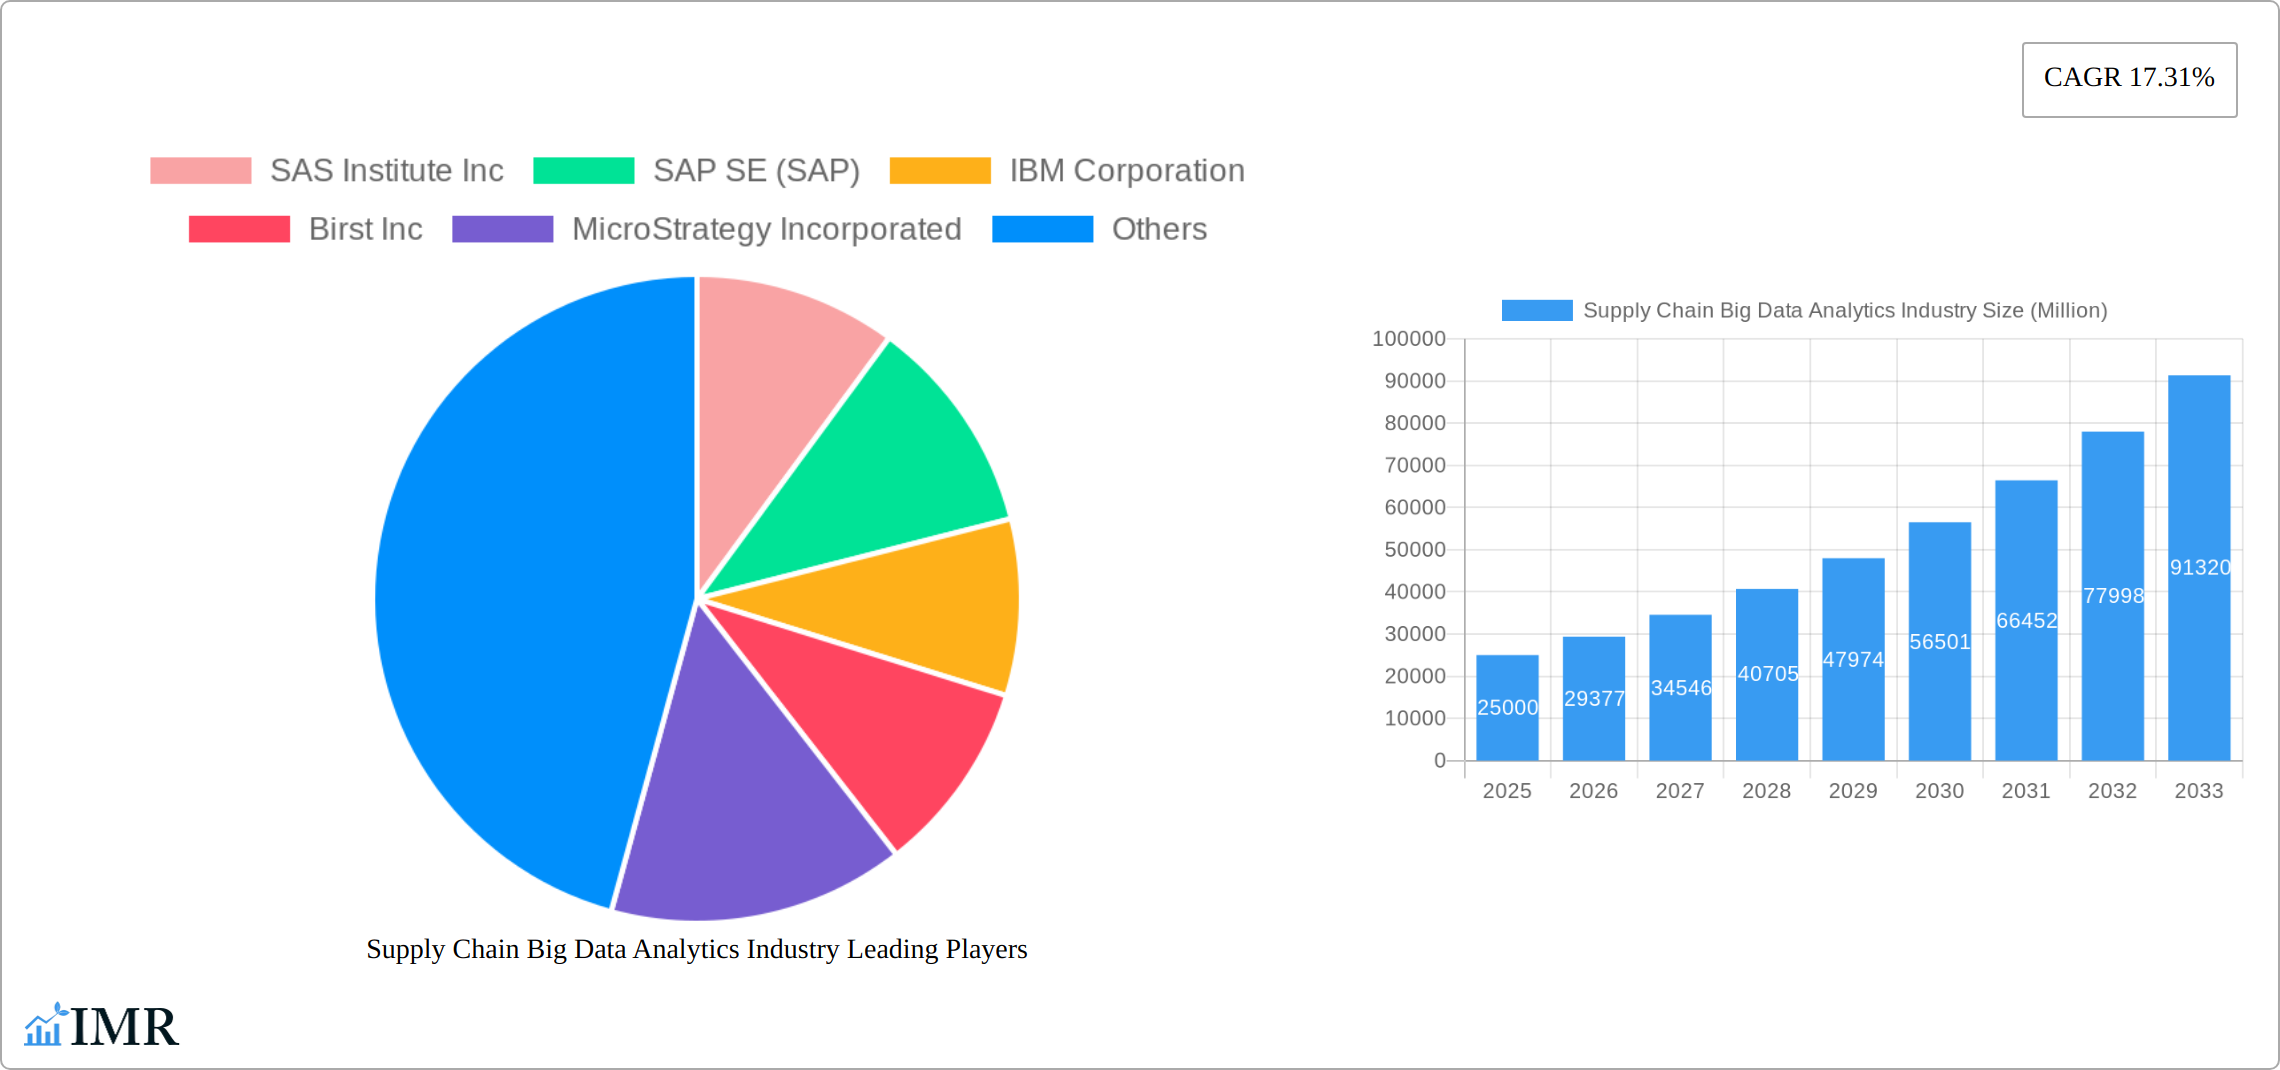
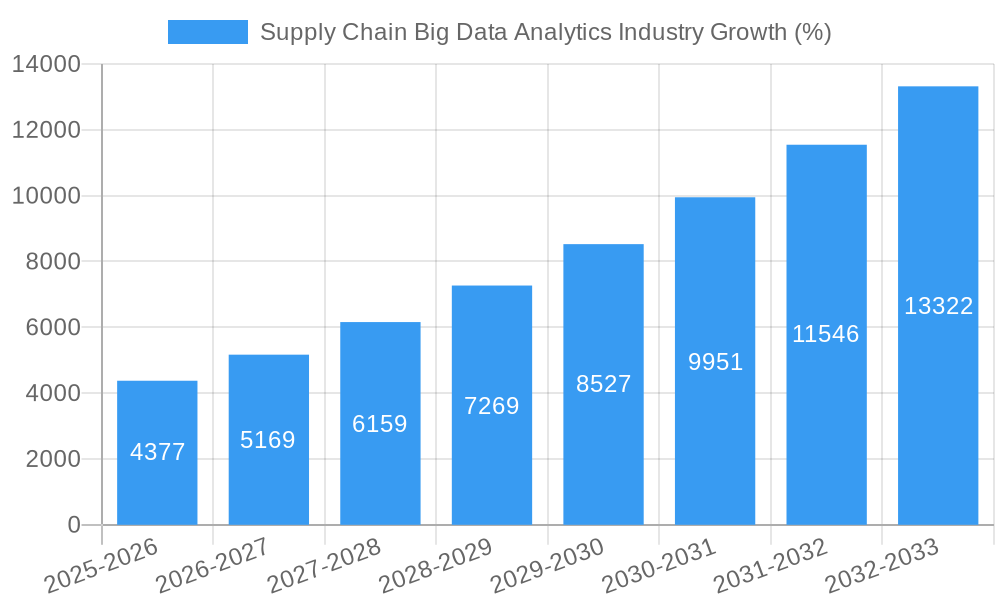
The Supply Chain Big Data Analytics market is experiencing robust growth, projected to reach a substantial size within the forecast period (2025-2033). A Compound Annual Growth Rate (CAGR) of 17.31% indicates significant expansion driven by several key factors. The increasing volume and complexity of supply chain data, coupled with the need for enhanced operational efficiency and improved decision-making, are fueling demand for sophisticated analytics solutions. Businesses across various sectors, including retail, transportation and logistics, manufacturing, and healthcare, are leveraging these solutions to optimize inventory management, streamline logistics, predict demand fluctuations, and mitigate risks. The adoption of cloud-based solutions, advancements in machine learning and artificial intelligence (AI), and the growing need for real-time visibility into supply chain operations are further accelerating market growth. While data security and integration challenges remain as potential restraints, the overall market outlook remains positive, with continued technological advancements and rising digital transformation initiatives expected to drive further expansion.
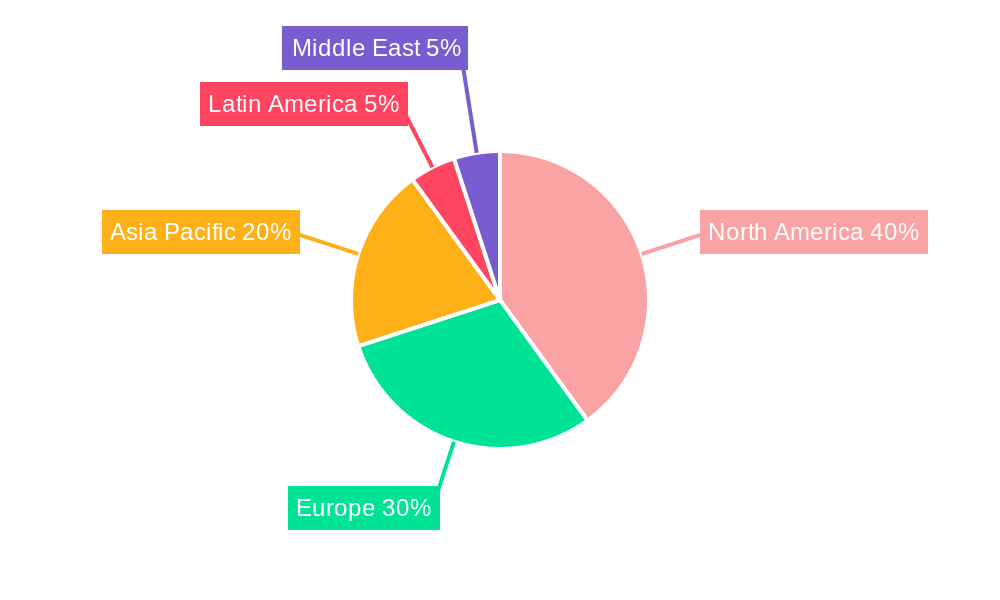
The competitive landscape is characterized by a mix of established players like SAS, SAP, IBM, and Oracle, alongside emerging technology providers and specialized consultancies. These companies offer a diverse range of solutions, from basic reporting tools to advanced predictive analytics platforms. The market is segmented by solution type (inventory planning, optimization analytics, scheduling, and reporting tools), end-user industry, and geography. North America currently holds a significant market share, driven by early adoption and technological advancements. However, Asia-Pacific is expected to witness substantial growth in the coming years, fueled by rapid industrialization and digitalization initiatives in countries like China and India. The continued focus on supply chain resilience and the growing need for proactive risk management will further propel the market's expansion throughout the forecast period. Companies are increasingly investing in advanced analytics capabilities to gain a competitive edge by improving efficiency, reducing costs, and enhancing customer satisfaction.
This comprehensive report provides a deep dive into the Supply Chain Big Data Analytics industry, analyzing market dynamics, growth trends, key players, and future opportunities. With a study period spanning 2019-2033, a base year of 2025, and a forecast period of 2025-2033, this report offers invaluable insights for businesses, investors, and industry professionals seeking to navigate this rapidly evolving landscape. The parent market is the broader Big Data Analytics market, while the child market is specifically focused on Supply Chain applications.
Supply Chain Big Data Analytics Industry Market Dynamics & Structure
The Supply Chain Big Data Analytics market, valued at xx million in 2024, is characterized by moderate concentration, with several key players holding significant market share. Technological innovation, driven by advancements in AI, machine learning, and cloud computing, is a primary growth driver. Stringent regulatory frameworks, particularly concerning data privacy and security (e.g., GDPR), influence market practices. Competitive pressure stems from both established players and emerging technology providers. The end-user landscape is diverse, with significant contributions from retail, manufacturing, transportation and logistics, and healthcare. M&A activity, as evidenced by recent acquisitions, indicates ongoing consolidation and expansion within the industry.
- Market Concentration: Moderately concentrated, with top 5 players holding approximately xx% market share in 2024.
- Technological Innovation: Rapid advancements in AI, machine learning, and cloud-based solutions are fueling growth.
- Regulatory Landscape: GDPR and similar regulations impact data handling and security protocols.
- Competitive Substitutes: Traditional supply chain management systems pose a competitive threat.
- End-User Demographics: Retail, Manufacturing, Transportation & Logistics, Healthcare are major end-user segments.
- M&A Trends: Increasing M&A activity signals industry consolidation and expansion. An estimated xx deals occurred between 2019-2024.
Supply Chain Big Data Analytics Industry Growth Trends & Insights
The Supply Chain Big Data Analytics market demonstrates robust growth, fueled by the increasing adoption of data-driven decision-making across various industries. The market size expanded significantly from xx million in 2019 to xx million in 2024, exhibiting a CAGR of xx% during the historical period. This growth is propelled by the need for enhanced supply chain visibility, optimization, and resilience. Technological disruptions, such as the increasing adoption of cloud-based solutions and AI-powered analytics, further accelerate market expansion. Consumer behavior shifts, including rising demand for personalized products and faster delivery times, also contribute to the growth. Market penetration is expected to reach xx% by 2033, driven by increasing awareness of the benefits of data analytics in supply chain management.
Dominant Regions, Countries, or Segments in Supply Chain Big Data Analytics Industry
North America currently holds the largest market share in the Supply Chain Big Data Analytics industry, followed by Europe and Asia-Pacific. This dominance is attributed to factors such as high technological adoption rates, robust digital infrastructure, and the presence of major industry players. The Manufacturing segment within the end-user category exhibits strong growth, driven by the increasing need for efficient production planning and inventory management. Within the solution types, the software segment dominates, offering scalability and integration capabilities across various supply chain processes.
- North America: High technological adoption, strong digital infrastructure, presence of major players.
- Europe: Growing adoption of data analytics solutions across various industries.
- Asia-Pacific: Rapid economic growth and increasing investment in digital technologies.
- Manufacturing Segment: High demand for production optimization and inventory management solutions.
- Software Solutions: Dominant due to scalability and integration capabilities.
Supply Chain Big Data Analytics Industry Product Landscape
The Supply Chain Big Data Analytics market offers a diverse range of products, encompassing software solutions for inventory planning, predictive analytics, and real-time tracking. These solutions integrate with existing Enterprise Resource Planning (ERP) systems and leverage advanced analytics techniques to provide actionable insights. Key product features include predictive modeling, real-time dashboards, and automated reporting. Unique selling propositions often include specific industry vertical focuses or integration with specific technologies (e.g., blockchain, IoT). Continuous innovation is driving the development of more sophisticated, user-friendly, and cloud-based solutions.
Key Drivers, Barriers & Challenges in Supply Chain Big Data Analytics Industry
Key Drivers:
- Increasing need for supply chain optimization and visibility.
- Growing adoption of advanced analytics technologies (AI, machine learning).
- Rising demand for real-time data and decision-making capabilities.
- Government initiatives promoting digital transformation in supply chain management.
Challenges & Restraints:
- High implementation costs and complexity.
- Data security and privacy concerns.
- Lack of skilled professionals to manage and interpret big data.
- Integration challenges with existing legacy systems. This can lead to a xx% failure rate in initial deployments.
Emerging Opportunities in Supply Chain Big Data Analytics Industry
Emerging opportunities include the growing adoption of blockchain technology for enhanced transparency and traceability, the integration of IoT devices for real-time data capture, and the expansion into untapped markets in developing economies. Furthermore, the development of specialized solutions for niche industries like pharmaceuticals and logistics will create new revenue streams. The increasing focus on sustainability and ethical sourcing presents another key opportunity, allowing businesses to leverage analytics to optimize environmental impact.
Growth Accelerators in the Supply Chain Big Data Analytics Industry
Long-term growth will be significantly propelled by advancements in AI and machine learning, enabling more sophisticated predictive models and automation. Strategic partnerships between technology providers and logistics companies are also critical, allowing for seamless integration of solutions. Market expansion into developing economies with burgeoning supply chains will further contribute to overall growth. Finally, a focus on user-friendly interfaces and enhanced data visualization capabilities will drive broader adoption.
Key Players Shaping the Supply Chain Big Data Analytics Market
- SAS Institute Inc
- SAP SE (SAP)
- IBM Corporation
- Birst Inc
- MicroStrategy Incorporated
- Salesforce com Inc (Tableau Software Inc)
- Capgemini Group
- Sage Clarity Systems
- Oracle Corporation
- Kinaxis Inc
- Genpact Limited
Notable Milestones in Supply Chain Big Data Analytics Industry Sector
- September 2022: Accenture's acquisition of MacGregor Partner expands its supply chain capabilities and strengthens its Blue Yonder-powered network.
- November 2022: o9 Solutions and Genpact's collaboration streamlines Eckes-Granini's supply chain through digitization.
- November 2022: Microsoft launches its Supply Chain System, offering an open platform for supply chain optimization.
In-Depth Supply Chain Big Data Analytics Industry Market Outlook
The future of the Supply Chain Big Data Analytics market is bright, driven by persistent demand for efficiency and resilience. Strategic investments in AI, cloud computing, and IoT integration will shape the market landscape. The continuous development of user-friendly, scalable, and secure solutions will be critical in driving broader adoption. Companies that successfully leverage partnerships and prioritize data security will be well-positioned for sustained growth and market leadership. The overall market is poised for significant expansion in the coming years, presenting compelling opportunities for both established players and innovative newcomers.
Supply Chain Big Data Analytics Industry Segmentation
-
1. Type
-
1.1. Solution
- 1.1.1. Supply Chain Procurement and Planning Tool
- 1.1.2. Sales and Operations Planning
- 1.1.3. Manufacturing Analytics
- 1.1.4. Transportation and Logistics Analytics
- 1.1.5. Other So
-
1.2. Service
- 1.2.1. Professional Service
- 1.2.2. Support and Maintenance Service
-
1.1. Solution
-
2. End User
- 2.1. Retail
- 2.2. Transportation and Logistics
- 2.3. Manufacturing
- 2.4. Healthcare
- 2.5. Other End Users
Supply Chain Big Data Analytics Industry Segmentation By Geography
-
1. North America
- 1.1. United States
- 1.2. Canada
-
2. Europe
- 2.1. United Kingdom
- 2.2. Germany
- 2.3. France
- 2.4. Italy
- 2.5. Rest of Europe
-
3. Asia Pacific
- 3.1. China
- 3.2. Japan
- 3.3. South Korea
- 3.4. India
- 3.5. Rest of Asia Pacific
-
4. Latin America
- 4.1. Mexico
- 4.2. Brazil
- 4.3. Argentina
- 4.4. Rest of Latin America
- 5. Middle East
-
6. United Arab Emirates
- 6.1. Saudi Arabia
- 6.2. South Africa
- 6.3. Rest of Middle East
Supply Chain Big Data Analytics Industry REPORT HIGHLIGHTS
| Aspects | Details |
|---|---|
| Study Period | 2019-2033 |
| Base Year | 2024 |
| Estimated Year | 2025 |
| Forecast Period | 2025-2033 |
| Historical Period | 2019-2024 |
| Growth Rate | CAGR of 17.31% from 2019-2033 |
| Segmentation |
|
Table of Contents
- 1. Introduction
- 1.1. Research Scope
- 1.2. Market Segmentation
- 1.3. Research Methodology
- 1.4. Definitions and Assumptions
- 2. Executive Summary
- 2.1. Introduction
- 3. Market Dynamics
- 3.1. Introduction
- 3.2. Market Drivers
- 3.2.1. Increasing Need of Business Data to Improve Efficiency
- 3.3. Market Restrains
- 3.3.1. Operational Complexity Coupled with High Maintenance Costs
- 3.4. Market Trends
- 3.4.1. Retail is Expected to Register a Significant Growth
- 4. Market Factor Analysis
- 4.1. Porters Five Forces
- 4.2. Supply/Value Chain
- 4.3. PESTEL analysis
- 4.4. Market Entropy
- 4.5. Patent/Trademark Analysis
- 5. Global Supply Chain Big Data Analytics Industry Analysis, Insights and Forecast, 2019-2031
- 5.1. Market Analysis, Insights and Forecast - by Type
- 5.1.1. Solution
- 5.1.1.1. Supply Chain Procurement and Planning Tool
- 5.1.1.2. Sales and Operations Planning
- 5.1.1.3. Manufacturing Analytics
- 5.1.1.4. Transportation and Logistics Analytics
- 5.1.1.5. Other So
- 5.1.2. Service
- 5.1.2.1. Professional Service
- 5.1.2.2. Support and Maintenance Service
- 5.1.1. Solution
- 5.2. Market Analysis, Insights and Forecast - by End User
- 5.2.1. Retail
- 5.2.2. Transportation and Logistics
- 5.2.3. Manufacturing
- 5.2.4. Healthcare
- 5.2.5. Other End Users
- 5.3. Market Analysis, Insights and Forecast - by Region
- 5.3.1. North America
- 5.3.2. Europe
- 5.3.3. Asia Pacific
- 5.3.4. Latin America
- 5.3.5. Middle East
- 5.3.6. United Arab Emirates
- 5.1. Market Analysis, Insights and Forecast - by Type
- 6. North America Supply Chain Big Data Analytics Industry Analysis, Insights and Forecast, 2019-2031
- 6.1. Market Analysis, Insights and Forecast - by Type
- 6.1.1. Solution
- 6.1.1.1. Supply Chain Procurement and Planning Tool
- 6.1.1.2. Sales and Operations Planning
- 6.1.1.3. Manufacturing Analytics
- 6.1.1.4. Transportation and Logistics Analytics
- 6.1.1.5. Other So
- 6.1.2. Service
- 6.1.2.1. Professional Service
- 6.1.2.2. Support and Maintenance Service
- 6.1.1. Solution
- 6.2. Market Analysis, Insights and Forecast - by End User
- 6.2.1. Retail
- 6.2.2. Transportation and Logistics
- 6.2.3. Manufacturing
- 6.2.4. Healthcare
- 6.2.5. Other End Users
- 6.1. Market Analysis, Insights and Forecast - by Type
- 7. Europe Supply Chain Big Data Analytics Industry Analysis, Insights and Forecast, 2019-2031
- 7.1. Market Analysis, Insights and Forecast - by Type
- 7.1.1. Solution
- 7.1.1.1. Supply Chain Procurement and Planning Tool
- 7.1.1.2. Sales and Operations Planning
- 7.1.1.3. Manufacturing Analytics
- 7.1.1.4. Transportation and Logistics Analytics
- 7.1.1.5. Other So
- 7.1.2. Service
- 7.1.2.1. Professional Service
- 7.1.2.2. Support and Maintenance Service
- 7.1.1. Solution
- 7.2. Market Analysis, Insights and Forecast - by End User
- 7.2.1. Retail
- 7.2.2. Transportation and Logistics
- 7.2.3. Manufacturing
- 7.2.4. Healthcare
- 7.2.5. Other End Users
- 7.1. Market Analysis, Insights and Forecast - by Type
- 8. Asia Pacific Supply Chain Big Data Analytics Industry Analysis, Insights and Forecast, 2019-2031
- 8.1. Market Analysis, Insights and Forecast - by Type
- 8.1.1. Solution
- 8.1.1.1. Supply Chain Procurement and Planning Tool
- 8.1.1.2. Sales and Operations Planning
- 8.1.1.3. Manufacturing Analytics
- 8.1.1.4. Transportation and Logistics Analytics
- 8.1.1.5. Other So
- 8.1.2. Service
- 8.1.2.1. Professional Service
- 8.1.2.2. Support and Maintenance Service
- 8.1.1. Solution
- 8.2. Market Analysis, Insights and Forecast - by End User
- 8.2.1. Retail
- 8.2.2. Transportation and Logistics
- 8.2.3. Manufacturing
- 8.2.4. Healthcare
- 8.2.5. Other End Users
- 8.1. Market Analysis, Insights and Forecast - by Type
- 9. Latin America Supply Chain Big Data Analytics Industry Analysis, Insights and Forecast, 2019-2031
- 9.1. Market Analysis, Insights and Forecast - by Type
- 9.1.1. Solution
- 9.1.1.1. Supply Chain Procurement and Planning Tool
- 9.1.1.2. Sales and Operations Planning
- 9.1.1.3. Manufacturing Analytics
- 9.1.1.4. Transportation and Logistics Analytics
- 9.1.1.5. Other So
- 9.1.2. Service
- 9.1.2.1. Professional Service
- 9.1.2.2. Support and Maintenance Service
- 9.1.1. Solution
- 9.2. Market Analysis, Insights and Forecast - by End User
- 9.2.1. Retail
- 9.2.2. Transportation and Logistics
- 9.2.3. Manufacturing
- 9.2.4. Healthcare
- 9.2.5. Other End Users
- 9.1. Market Analysis, Insights and Forecast - by Type
- 10. Middle East Supply Chain Big Data Analytics Industry Analysis, Insights and Forecast, 2019-2031
- 10.1. Market Analysis, Insights and Forecast - by Type
- 10.1.1. Solution
- 10.1.1.1. Supply Chain Procurement and Planning Tool
- 10.1.1.2. Sales and Operations Planning
- 10.1.1.3. Manufacturing Analytics
- 10.1.1.4. Transportation and Logistics Analytics
- 10.1.1.5. Other So
- 10.1.2. Service
- 10.1.2.1. Professional Service
- 10.1.2.2. Support and Maintenance Service
- 10.1.1. Solution
- 10.2. Market Analysis, Insights and Forecast - by End User
- 10.2.1. Retail
- 10.2.2. Transportation and Logistics
- 10.2.3. Manufacturing
- 10.2.4. Healthcare
- 10.2.5. Other End Users
- 10.1. Market Analysis, Insights and Forecast - by Type
- 11. United Arab Emirates Supply Chain Big Data Analytics Industry Analysis, Insights and Forecast, 2019-2031
- 11.1. Market Analysis, Insights and Forecast - by Type
- 11.1.1. Solution
- 11.1.1.1. Supply Chain Procurement and Planning Tool
- 11.1.1.2. Sales and Operations Planning
- 11.1.1.3. Manufacturing Analytics
- 11.1.1.4. Transportation and Logistics Analytics
- 11.1.1.5. Other So
- 11.1.2. Service
- 11.1.2.1. Professional Service
- 11.1.2.2. Support and Maintenance Service
- 11.1.1. Solution
- 11.2. Market Analysis, Insights and Forecast - by End User
- 11.2.1. Retail
- 11.2.2. Transportation and Logistics
- 11.2.3. Manufacturing
- 11.2.4. Healthcare
- 11.2.5. Other End Users
- 11.1. Market Analysis, Insights and Forecast - by Type
- 12. North America Supply Chain Big Data Analytics Industry Analysis, Insights and Forecast, 2019-2031
- 12.1. Market Analysis, Insights and Forecast - By Country/Sub-region
- 12.1.1 United States
- 12.1.2 Canada
- 13. Europe Supply Chain Big Data Analytics Industry Analysis, Insights and Forecast, 2019-2031
- 13.1. Market Analysis, Insights and Forecast - By Country/Sub-region
- 13.1.1 United Kingdom
- 13.1.2 Germany
- 13.1.3 France
- 13.1.4 Italy
- 13.1.5 Rest of Europe
- 14. Asia Pacific Supply Chain Big Data Analytics Industry Analysis, Insights and Forecast, 2019-2031
- 14.1. Market Analysis, Insights and Forecast - By Country/Sub-region
- 14.1.1 China
- 14.1.2 Japan
- 14.1.3 South Korea
- 14.1.4 India
- 14.1.5 Rest of Asia Pacific
- 15. Latin America Supply Chain Big Data Analytics Industry Analysis, Insights and Forecast, 2019-2031
- 15.1. Market Analysis, Insights and Forecast - By Country/Sub-region
- 15.1.1 Mexico
- 15.1.2 Brazil
- 15.1.3 Argentina
- 15.1.4 Rest of Latin America
- 16. Middle East Supply Chain Big Data Analytics Industry Analysis, Insights and Forecast, 2019-2031
- 16.1. Market Analysis, Insights and Forecast - By Country/Sub-region
- 16.1.1.
- 17. United Arab Emirates Supply Chain Big Data Analytics Industry Analysis, Insights and Forecast, 2019-2031
- 17.1. Market Analysis, Insights and Forecast - By Country/Sub-region
- 17.1.1 Saudi Arabia
- 17.1.2 South Africa
- 17.1.3 Rest of Middle East
- 18. Competitive Analysis
- 18.1. Global Market Share Analysis 2024
- 18.2. Company Profiles
- 18.2.1 SAS Institute Inc
- 18.2.1.1. Overview
- 18.2.1.2. Products
- 18.2.1.3. SWOT Analysis
- 18.2.1.4. Recent Developments
- 18.2.1.5. Financials (Based on Availability)
- 18.2.2 SAP SE (SAP)
- 18.2.2.1. Overview
- 18.2.2.2. Products
- 18.2.2.3. SWOT Analysis
- 18.2.2.4. Recent Developments
- 18.2.2.5. Financials (Based on Availability)
- 18.2.3 IBM Corporation
- 18.2.3.1. Overview
- 18.2.3.2. Products
- 18.2.3.3. SWOT Analysis
- 18.2.3.4. Recent Developments
- 18.2.3.5. Financials (Based on Availability)
- 18.2.4 Birst Inc
- 18.2.4.1. Overview
- 18.2.4.2. Products
- 18.2.4.3. SWOT Analysis
- 18.2.4.4. Recent Developments
- 18.2.4.5. Financials (Based on Availability)
- 18.2.5 MicroStrategy Incorporated
- 18.2.5.1. Overview
- 18.2.5.2. Products
- 18.2.5.3. SWOT Analysis
- 18.2.5.4. Recent Developments
- 18.2.5.5. Financials (Based on Availability)
- 18.2.6 Salesforce com Inc (Tableau Software Inc )
- 18.2.6.1. Overview
- 18.2.6.2. Products
- 18.2.6.3. SWOT Analysis
- 18.2.6.4. Recent Developments
- 18.2.6.5. Financials (Based on Availability)
- 18.2.7 Capgemini Group
- 18.2.7.1. Overview
- 18.2.7.2. Products
- 18.2.7.3. SWOT Analysis
- 18.2.7.4. Recent Developments
- 18.2.7.5. Financials (Based on Availability)
- 18.2.8 Sage Clarity Systems
- 18.2.8.1. Overview
- 18.2.8.2. Products
- 18.2.8.3. SWOT Analysis
- 18.2.8.4. Recent Developments
- 18.2.8.5. Financials (Based on Availability)
- 18.2.9 Oracle Corporation
- 18.2.9.1. Overview
- 18.2.9.2. Products
- 18.2.9.3. SWOT Analysis
- 18.2.9.4. Recent Developments
- 18.2.9.5. Financials (Based on Availability)
- 18.2.10 Kinaxis Inc *List Not Exhaustive
- 18.2.10.1. Overview
- 18.2.10.2. Products
- 18.2.10.3. SWOT Analysis
- 18.2.10.4. Recent Developments
- 18.2.10.5. Financials (Based on Availability)
- 18.2.11 Genpact Limited
- 18.2.11.1. Overview
- 18.2.11.2. Products
- 18.2.11.3. SWOT Analysis
- 18.2.11.4. Recent Developments
- 18.2.11.5. Financials (Based on Availability)
- 18.2.1 SAS Institute Inc
List of Figures
- Figure 1: Global Supply Chain Big Data Analytics Industry Revenue Breakdown (Million, %) by Region 2024 & 2032
- Figure 2: North America Supply Chain Big Data Analytics Industry Revenue (Million), by Country 2024 & 2032
- Figure 3: North America Supply Chain Big Data Analytics Industry Revenue Share (%), by Country 2024 & 2032
- Figure 4: Europe Supply Chain Big Data Analytics Industry Revenue (Million), by Country 2024 & 2032
- Figure 5: Europe Supply Chain Big Data Analytics Industry Revenue Share (%), by Country 2024 & 2032
- Figure 6: Asia Pacific Supply Chain Big Data Analytics Industry Revenue (Million), by Country 2024 & 2032
- Figure 7: Asia Pacific Supply Chain Big Data Analytics Industry Revenue Share (%), by Country 2024 & 2032
- Figure 8: Latin America Supply Chain Big Data Analytics Industry Revenue (Million), by Country 2024 & 2032
- Figure 9: Latin America Supply Chain Big Data Analytics Industry Revenue Share (%), by Country 2024 & 2032
- Figure 10: Middle East Supply Chain Big Data Analytics Industry Revenue (Million), by Country 2024 & 2032
- Figure 11: Middle East Supply Chain Big Data Analytics Industry Revenue Share (%), by Country 2024 & 2032
- Figure 12: United Arab Emirates Supply Chain Big Data Analytics Industry Revenue (Million), by Country 2024 & 2032
- Figure 13: United Arab Emirates Supply Chain Big Data Analytics Industry Revenue Share (%), by Country 2024 & 2032
- Figure 14: North America Supply Chain Big Data Analytics Industry Revenue (Million), by Type 2024 & 2032
- Figure 15: North America Supply Chain Big Data Analytics Industry Revenue Share (%), by Type 2024 & 2032
- Figure 16: North America Supply Chain Big Data Analytics Industry Revenue (Million), by End User 2024 & 2032
- Figure 17: North America Supply Chain Big Data Analytics Industry Revenue Share (%), by End User 2024 & 2032
- Figure 18: North America Supply Chain Big Data Analytics Industry Revenue (Million), by Country 2024 & 2032
- Figure 19: North America Supply Chain Big Data Analytics Industry Revenue Share (%), by Country 2024 & 2032
- Figure 20: Europe Supply Chain Big Data Analytics Industry Revenue (Million), by Type 2024 & 2032
- Figure 21: Europe Supply Chain Big Data Analytics Industry Revenue Share (%), by Type 2024 & 2032
- Figure 22: Europe Supply Chain Big Data Analytics Industry Revenue (Million), by End User 2024 & 2032
- Figure 23: Europe Supply Chain Big Data Analytics Industry Revenue Share (%), by End User 2024 & 2032
- Figure 24: Europe Supply Chain Big Data Analytics Industry Revenue (Million), by Country 2024 & 2032
- Figure 25: Europe Supply Chain Big Data Analytics Industry Revenue Share (%), by Country 2024 & 2032
- Figure 26: Asia Pacific Supply Chain Big Data Analytics Industry Revenue (Million), by Type 2024 & 2032
- Figure 27: Asia Pacific Supply Chain Big Data Analytics Industry Revenue Share (%), by Type 2024 & 2032
- Figure 28: Asia Pacific Supply Chain Big Data Analytics Industry Revenue (Million), by End User 2024 & 2032
- Figure 29: Asia Pacific Supply Chain Big Data Analytics Industry Revenue Share (%), by End User 2024 & 2032
- Figure 30: Asia Pacific Supply Chain Big Data Analytics Industry Revenue (Million), by Country 2024 & 2032
- Figure 31: Asia Pacific Supply Chain Big Data Analytics Industry Revenue Share (%), by Country 2024 & 2032
- Figure 32: Latin America Supply Chain Big Data Analytics Industry Revenue (Million), by Type 2024 & 2032
- Figure 33: Latin America Supply Chain Big Data Analytics Industry Revenue Share (%), by Type 2024 & 2032
- Figure 34: Latin America Supply Chain Big Data Analytics Industry Revenue (Million), by End User 2024 & 2032
- Figure 35: Latin America Supply Chain Big Data Analytics Industry Revenue Share (%), by End User 2024 & 2032
- Figure 36: Latin America Supply Chain Big Data Analytics Industry Revenue (Million), by Country 2024 & 2032
- Figure 37: Latin America Supply Chain Big Data Analytics Industry Revenue Share (%), by Country 2024 & 2032
- Figure 38: Middle East Supply Chain Big Data Analytics Industry Revenue (Million), by Type 2024 & 2032
- Figure 39: Middle East Supply Chain Big Data Analytics Industry Revenue Share (%), by Type 2024 & 2032
- Figure 40: Middle East Supply Chain Big Data Analytics Industry Revenue (Million), by End User 2024 & 2032
- Figure 41: Middle East Supply Chain Big Data Analytics Industry Revenue Share (%), by End User 2024 & 2032
- Figure 42: Middle East Supply Chain Big Data Analytics Industry Revenue (Million), by Country 2024 & 2032
- Figure 43: Middle East Supply Chain Big Data Analytics Industry Revenue Share (%), by Country 2024 & 2032
- Figure 44: United Arab Emirates Supply Chain Big Data Analytics Industry Revenue (Million), by Type 2024 & 2032
- Figure 45: United Arab Emirates Supply Chain Big Data Analytics Industry Revenue Share (%), by Type 2024 & 2032
- Figure 46: United Arab Emirates Supply Chain Big Data Analytics Industry Revenue (Million), by End User 2024 & 2032
- Figure 47: United Arab Emirates Supply Chain Big Data Analytics Industry Revenue Share (%), by End User 2024 & 2032
- Figure 48: United Arab Emirates Supply Chain Big Data Analytics Industry Revenue (Million), by Country 2024 & 2032
- Figure 49: United Arab Emirates Supply Chain Big Data Analytics Industry Revenue Share (%), by Country 2024 & 2032
List of Tables
- Table 1: Global Supply Chain Big Data Analytics Industry Revenue Million Forecast, by Region 2019 & 2032
- Table 2: Global Supply Chain Big Data Analytics Industry Revenue Million Forecast, by Type 2019 & 2032
- Table 3: Global Supply Chain Big Data Analytics Industry Revenue Million Forecast, by End User 2019 & 2032
- Table 4: Global Supply Chain Big Data Analytics Industry Revenue Million Forecast, by Region 2019 & 2032
- Table 5: Global Supply Chain Big Data Analytics Industry Revenue Million Forecast, by Country 2019 & 2032
- Table 6: United States Supply Chain Big Data Analytics Industry Revenue (Million) Forecast, by Application 2019 & 2032
- Table 7: Canada Supply Chain Big Data Analytics Industry Revenue (Million) Forecast, by Application 2019 & 2032
- Table 8: Global Supply Chain Big Data Analytics Industry Revenue Million Forecast, by Country 2019 & 2032
- Table 9: United Kingdom Supply Chain Big Data Analytics Industry Revenue (Million) Forecast, by Application 2019 & 2032
- Table 10: Germany Supply Chain Big Data Analytics Industry Revenue (Million) Forecast, by Application 2019 & 2032
- Table 11: France Supply Chain Big Data Analytics Industry Revenue (Million) Forecast, by Application 2019 & 2032
- Table 12: Italy Supply Chain Big Data Analytics Industry Revenue (Million) Forecast, by Application 2019 & 2032
- Table 13: Rest of Europe Supply Chain Big Data Analytics Industry Revenue (Million) Forecast, by Application 2019 & 2032
- Table 14: Global Supply Chain Big Data Analytics Industry Revenue Million Forecast, by Country 2019 & 2032
- Table 15: China Supply Chain Big Data Analytics Industry Revenue (Million) Forecast, by Application 2019 & 2032
- Table 16: Japan Supply Chain Big Data Analytics Industry Revenue (Million) Forecast, by Application 2019 & 2032
- Table 17: South Korea Supply Chain Big Data Analytics Industry Revenue (Million) Forecast, by Application 2019 & 2032
- Table 18: India Supply Chain Big Data Analytics Industry Revenue (Million) Forecast, by Application 2019 & 2032
- Table 19: Rest of Asia Pacific Supply Chain Big Data Analytics Industry Revenue (Million) Forecast, by Application 2019 & 2032
- Table 20: Global Supply Chain Big Data Analytics Industry Revenue Million Forecast, by Country 2019 & 2032
- Table 21: Mexico Supply Chain Big Data Analytics Industry Revenue (Million) Forecast, by Application 2019 & 2032
- Table 22: Brazil Supply Chain Big Data Analytics Industry Revenue (Million) Forecast, by Application 2019 & 2032
- Table 23: Argentina Supply Chain Big Data Analytics Industry Revenue (Million) Forecast, by Application 2019 & 2032
- Table 24: Rest of Latin America Supply Chain Big Data Analytics Industry Revenue (Million) Forecast, by Application 2019 & 2032
- Table 25: Global Supply Chain Big Data Analytics Industry Revenue Million Forecast, by Country 2019 & 2032
- Table 26: Supply Chain Big Data Analytics Industry Revenue (Million) Forecast, by Application 2019 & 2032
- Table 27: Global Supply Chain Big Data Analytics Industry Revenue Million Forecast, by Country 2019 & 2032
- Table 28: Saudi Arabia Supply Chain Big Data Analytics Industry Revenue (Million) Forecast, by Application 2019 & 2032
- Table 29: South Africa Supply Chain Big Data Analytics Industry Revenue (Million) Forecast, by Application 2019 & 2032
- Table 30: Rest of Middle East Supply Chain Big Data Analytics Industry Revenue (Million) Forecast, by Application 2019 & 2032
- Table 31: Global Supply Chain Big Data Analytics Industry Revenue Million Forecast, by Type 2019 & 2032
- Table 32: Global Supply Chain Big Data Analytics Industry Revenue Million Forecast, by End User 2019 & 2032
- Table 33: Global Supply Chain Big Data Analytics Industry Revenue Million Forecast, by Country 2019 & 2032
- Table 34: United States Supply Chain Big Data Analytics Industry Revenue (Million) Forecast, by Application 2019 & 2032
- Table 35: Canada Supply Chain Big Data Analytics Industry Revenue (Million) Forecast, by Application 2019 & 2032
- Table 36: Global Supply Chain Big Data Analytics Industry Revenue Million Forecast, by Type 2019 & 2032
- Table 37: Global Supply Chain Big Data Analytics Industry Revenue Million Forecast, by End User 2019 & 2032
- Table 38: Global Supply Chain Big Data Analytics Industry Revenue Million Forecast, by Country 2019 & 2032
- Table 39: United Kingdom Supply Chain Big Data Analytics Industry Revenue (Million) Forecast, by Application 2019 & 2032
- Table 40: Germany Supply Chain Big Data Analytics Industry Revenue (Million) Forecast, by Application 2019 & 2032
- Table 41: France Supply Chain Big Data Analytics Industry Revenue (Million) Forecast, by Application 2019 & 2032
- Table 42: Italy Supply Chain Big Data Analytics Industry Revenue (Million) Forecast, by Application 2019 & 2032
- Table 43: Rest of Europe Supply Chain Big Data Analytics Industry Revenue (Million) Forecast, by Application 2019 & 2032
- Table 44: Global Supply Chain Big Data Analytics Industry Revenue Million Forecast, by Type 2019 & 2032
- Table 45: Global Supply Chain Big Data Analytics Industry Revenue Million Forecast, by End User 2019 & 2032
- Table 46: Global Supply Chain Big Data Analytics Industry Revenue Million Forecast, by Country 2019 & 2032
- Table 47: China Supply Chain Big Data Analytics Industry Revenue (Million) Forecast, by Application 2019 & 2032
- Table 48: Japan Supply Chain Big Data Analytics Industry Revenue (Million) Forecast, by Application 2019 & 2032
- Table 49: South Korea Supply Chain Big Data Analytics Industry Revenue (Million) Forecast, by Application 2019 & 2032
- Table 50: India Supply Chain Big Data Analytics Industry Revenue (Million) Forecast, by Application 2019 & 2032
- Table 51: Rest of Asia Pacific Supply Chain Big Data Analytics Industry Revenue (Million) Forecast, by Application 2019 & 2032
- Table 52: Global Supply Chain Big Data Analytics Industry Revenue Million Forecast, by Type 2019 & 2032
- Table 53: Global Supply Chain Big Data Analytics Industry Revenue Million Forecast, by End User 2019 & 2032
- Table 54: Global Supply Chain Big Data Analytics Industry Revenue Million Forecast, by Country 2019 & 2032
- Table 55: Mexico Supply Chain Big Data Analytics Industry Revenue (Million) Forecast, by Application 2019 & 2032
- Table 56: Brazil Supply Chain Big Data Analytics Industry Revenue (Million) Forecast, by Application 2019 & 2032
- Table 57: Argentina Supply Chain Big Data Analytics Industry Revenue (Million) Forecast, by Application 2019 & 2032
- Table 58: Rest of Latin America Supply Chain Big Data Analytics Industry Revenue (Million) Forecast, by Application 2019 & 2032
- Table 59: Global Supply Chain Big Data Analytics Industry Revenue Million Forecast, by Type 2019 & 2032
- Table 60: Global Supply Chain Big Data Analytics Industry Revenue Million Forecast, by End User 2019 & 2032
- Table 61: Global Supply Chain Big Data Analytics Industry Revenue Million Forecast, by Country 2019 & 2032
- Table 62: Global Supply Chain Big Data Analytics Industry Revenue Million Forecast, by Type 2019 & 2032
- Table 63: Global Supply Chain Big Data Analytics Industry Revenue Million Forecast, by End User 2019 & 2032
- Table 64: Global Supply Chain Big Data Analytics Industry Revenue Million Forecast, by Country 2019 & 2032
- Table 65: Saudi Arabia Supply Chain Big Data Analytics Industry Revenue (Million) Forecast, by Application 2019 & 2032
- Table 66: South Africa Supply Chain Big Data Analytics Industry Revenue (Million) Forecast, by Application 2019 & 2032
- Table 67: Rest of Middle East Supply Chain Big Data Analytics Industry Revenue (Million) Forecast, by Application 2019 & 2032
Frequently Asked Questions
1. What is the projected Compound Annual Growth Rate (CAGR) of the Supply Chain Big Data Analytics Industry?
The projected CAGR is approximately 17.31%.
2. Which companies are prominent players in the Supply Chain Big Data Analytics Industry?
Key companies in the market include SAS Institute Inc, SAP SE (SAP), IBM Corporation, Birst Inc, MicroStrategy Incorporated, Salesforce com Inc (Tableau Software Inc ), Capgemini Group, Sage Clarity Systems, Oracle Corporation, Kinaxis Inc *List Not Exhaustive, Genpact Limited.
3. What are the main segments of the Supply Chain Big Data Analytics Industry?
The market segments include Type, End User.
4. Can you provide details about the market size?
The market size is estimated to be USD XX Million as of 2022.
5. What are some drivers contributing to market growth?
Increasing Need of Business Data to Improve Efficiency.
6. What are the notable trends driving market growth?
Retail is Expected to Register a Significant Growth.
7. Are there any restraints impacting market growth?
Operational Complexity Coupled with High Maintenance Costs.
8. Can you provide examples of recent developments in the market?
September 2022: Accenture announced the acquisition of MacGregor Partner, a prominent supply chain consultant and technology supplier specializing in smart logistics and warehouse administration. It is an intelligent logistics and warehouse management company, as well as a supply chain consultant and technology supplier. Accenture's supply chain network, powered by Blue Yonder technology, has grown due to the acquisition.
9. What pricing options are available for accessing the report?
Pricing options include single-user, multi-user, and enterprise licenses priced at USD 4750, USD 5250, and USD 8750 respectively.
10. Is the market size provided in terms of value or volume?
The market size is provided in terms of value, measured in Million.
11. Are there any specific market keywords associated with the report?
Yes, the market keyword associated with the report is "Supply Chain Big Data Analytics Industry," which aids in identifying and referencing the specific market segment covered.
12. How do I determine which pricing option suits my needs best?
The pricing options vary based on user requirements and access needs. Individual users may opt for single-user licenses, while businesses requiring broader access may choose multi-user or enterprise licenses for cost-effective access to the report.
13. Are there any additional resources or data provided in the Supply Chain Big Data Analytics Industry report?
While the report offers comprehensive insights, it's advisable to review the specific contents or supplementary materials provided to ascertain if additional resources or data are available.
14. How can I stay updated on further developments or reports in the Supply Chain Big Data Analytics Industry?
To stay informed about further developments, trends, and reports in the Supply Chain Big Data Analytics Industry, consider subscribing to industry newsletters, following relevant companies and organizations, or regularly checking reputable industry news sources and publications.
Methodology
Step 1 - Identification of Relevant Samples Size from Population Database


Step 2 - Approaches for Defining Global Market Size (Value, Volume* & Price*)

Note*: In applicable scenarios
Step 3 - Data Sources
Primary Research
- Web Analytics
- Survey Reports
- Research Institute
- Latest Research Reports
- Opinion Leaders
Secondary Research
- Annual Reports
- White Paper
- Latest Press Release
- Industry Association
- Paid Database
- Investor Presentations

Step 4 - Data Triangulation
Involves using different sources of information in order to increase the validity of a study
These sources are likely to be stakeholders in a program - participants, other researchers, program staff, other community members, and so on.
Then we put all data in single framework & apply various statistical tools to find out the dynamic on the market.
During the analysis stage, feedback from the stakeholder groups would be compared to determine areas of agreement as well as areas of divergence
