

Key Insights
The Top Drive Drilling market, valued at approximately $XX million in 2025, is projected to experience robust growth, exceeding a 4.50% CAGR through 2033. This expansion is driven by several key factors. Firstly, the increasing demand for oil and gas globally fuels the need for efficient and technologically advanced drilling solutions. Top drives offer significant advantages over traditional rotary drilling systems, including enhanced control, automation capabilities, and improved drilling speeds, resulting in reduced operational costs and increased drilling efficiency. Secondly, the ongoing trend towards deepwater and harsh environment drilling necessitates the use of robust and reliable top drives capable of withstanding challenging conditions. Finally, the growing adoption of digitalization and automation within the oil and gas industry further propels the demand for technologically sophisticated top drives. The market segments, encompassing electric and hydraulic top drives deployed onshore and offshore, present diverse growth opportunities, with the electric top drive segment anticipated to witness faster adoption due to its energy efficiency and environmental benefits.
Regional growth is expected to be varied. North America and the Asia-Pacific region, particularly China and India, are poised for substantial market expansion, driven by robust energy demand and significant investments in oil and gas exploration and production. Europe and the Middle East & Africa regions will also contribute, albeit at potentially slower rates depending on their respective exploration activities and regulatory frameworks. Market restraints include volatile oil prices, stringent environmental regulations, and potential supply chain disruptions. However, the long-term outlook for the top drive drilling market remains positive, driven by the continuous need for improved drilling efficiency and the adoption of advanced technologies within the oil and gas industry. Companies like Aker Solutions, CNPC, and National-Oilwell Varco are key players, continuously innovating to maintain market share and capitalize on emerging trends.
Top Drive Drilling Industry Market Report: 2019-2033
This comprehensive report provides a detailed analysis of the Top Drive Drilling industry, encompassing market dynamics, growth trends, regional dominance, product landscape, key players, and future outlook. The report covers both parent markets (Oil and Gas Drilling Equipment) and child markets (Electric and Hydraulic Top Drives, Onshore and Offshore deployments), offering granular insights for industry professionals, investors, and strategic decision-makers. The study period spans 2019-2033, with 2025 as the base and estimated year.
Top Drive Drilling Industry Market Dynamics & Structure
The Top Drive Drilling market, valued at xx Million in 2024, exhibits a moderately concentrated structure with key players holding significant market share. Technological innovation, particularly in electric top drives and automation, is a major growth driver. Stringent regulatory frameworks concerning safety and environmental impact influence market dynamics. Competitive substitutes, such as traditional rotary systems, pose a challenge, although the advantages of top drives in terms of efficiency and precision are increasingly recognized. End-user demographics are primarily oil and gas exploration and production companies, with a growing emphasis on sustainability driving demand for efficient and environmentally friendly systems. Mergers and acquisitions (M&A) activity, while not excessively high (xx deals in the last 5 years), indicate consolidation within the market.
- Market Concentration: Moderately concentrated, with top 5 players holding approximately xx% market share.
- Technological Innovation: Focus on electric top drives, automation, and improved drilling efficiency.
- Regulatory Framework: Stringent safety and environmental regulations influence design and deployment.
- Competitive Substitutes: Traditional rotary systems present a moderate competitive threat.
- End-User Demographics: Primarily oil and gas exploration and production companies, with increasing focus on renewable energy exploration.
- M&A Trends: Moderate activity, with xx major M&A deals recorded between 2019 and 2024.
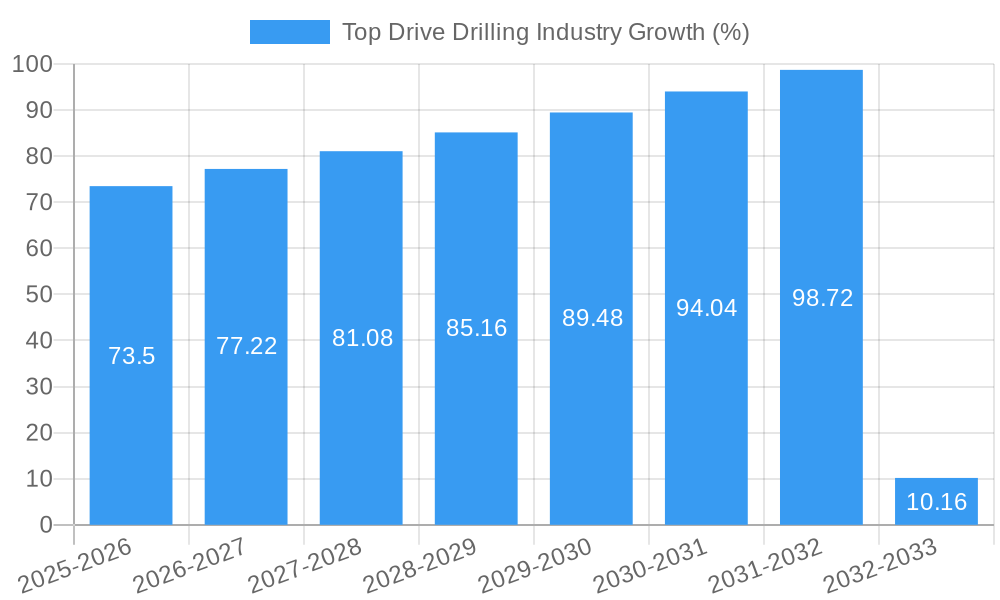
Top Drive Drilling Industry Growth Trends & Insights
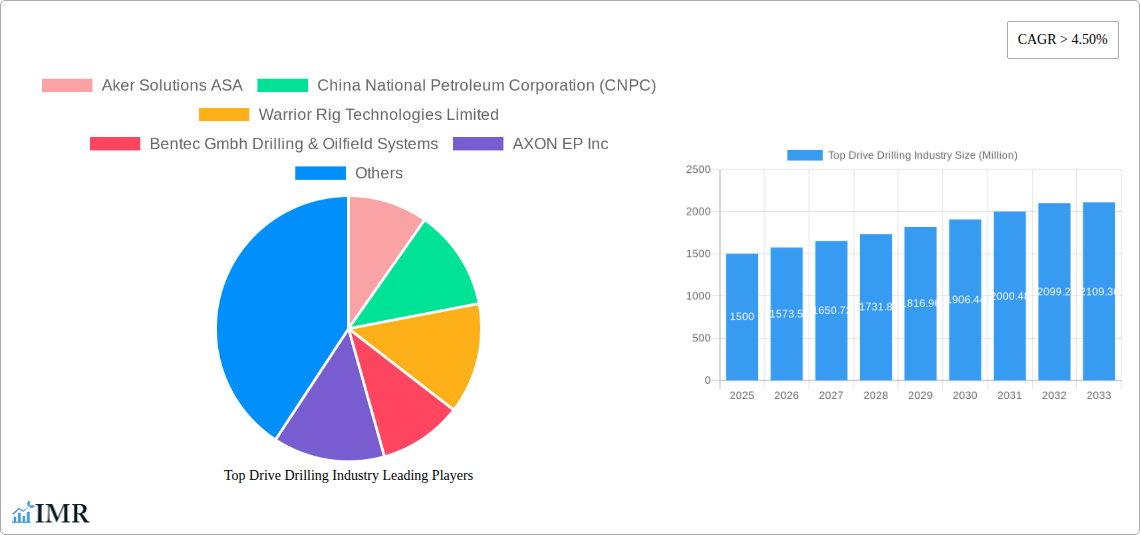
The Top Drive Drilling market experienced a CAGR of xx% during the historical period (2019-2024), driven by increasing oil and gas exploration and production activities globally. Adoption rates for electric top drives are increasing due to their energy efficiency and reduced environmental impact. Technological disruptions, such as advancements in automation and remote operation, are significantly impacting market growth. Shifting consumer behavior towards sustainable practices is influencing demand for environmentally friendly drilling technologies. Market penetration of electric top drives is expected to reach xx% by 2033, indicating significant future growth. The market size is projected to reach xx Million by 2033.
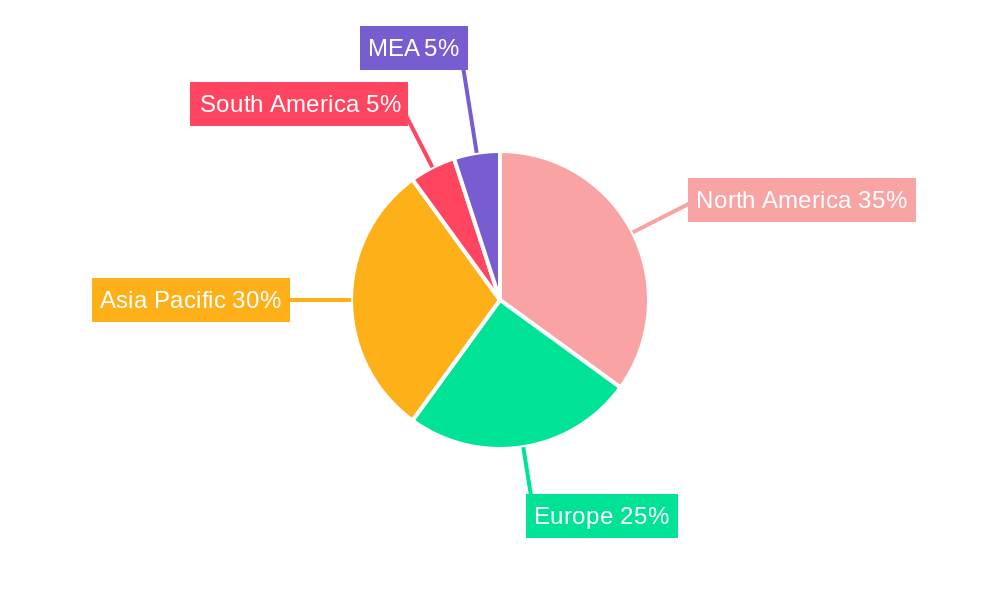
Dominant Regions, Countries, or Segments in Top Drive Drilling Industry
The North American and Middle Eastern regions are currently dominating the Top Drive Drilling market, driven by robust oil and gas production activities. Within these regions, countries like the US, Canada, Saudi Arabia, and the UAE are key contributors. The offshore segment holds a larger market share compared to onshore due to the high demand for efficient and precise drilling in deepwater environments. Electric top drives are witnessing higher growth compared to hydraulic top drives due to their superior efficiency and reduced environmental footprint.
- Key Drivers:
- Robust oil and gas exploration and production activities in North America and the Middle East.
- High demand for efficient drilling in deepwater environments (offshore segment).
- Growing adoption of electric top drives due to energy efficiency and environmental concerns.
- Favorable government policies and infrastructure development in key regions.
- Dominance Factors:
- High oil and gas production capacity in North America and Middle East.
- Significant investments in offshore drilling infrastructure.
- Technological advancements in electric top drives leading to increased adoption.
Top Drive Drilling Industry Product Landscape
Top drive systems are evolving from simple hydraulic units to sophisticated electric and hybrid systems offering enhanced control, precision, and efficiency. Key product innovations focus on automation, remote operation capabilities, and improved safety features. Electric top drives offer higher efficiency and reduced emissions, while hybrid systems combine the advantages of both hydraulic and electric technologies. These advancements cater to the growing demand for sustainable and cost-effective drilling solutions.
Key Drivers, Barriers & Challenges in Top Drive Drilling Industry
Key Drivers:
- Increasing global demand for oil and gas.
- Advancements in automation and remote operation capabilities.
- Growing preference for environmentally friendly drilling technologies.
Challenges and Restraints:
- Fluctuations in oil and gas prices.
- Supply chain disruptions impacting component availability.
- Stringent environmental regulations and compliance costs.
Emerging Opportunities in Top Drive Drilling Industry
Untapped markets in developing economies present significant growth potential. Innovative applications, such as directional drilling and extended-reach drilling, are creating new opportunities. Evolving consumer preferences towards sustainable drilling solutions drive demand for efficient and environmentally friendly technologies.
Growth Accelerators in the Top Drive Drilling Industry
Technological breakthroughs in automation, robotics, and digitalization are accelerating market growth. Strategic partnerships between top drive manufacturers and oil and gas companies are driving innovation and market expansion. The increasing adoption of electric top drives and the development of hybrid systems are further accelerating market growth.
Key Players Shaping the Top Drive Drilling Industry Market
- Aker Solutions ASA
- China National Petroleum Corporation (CNPC)
- Warrior Rig Technologies Limited
- Bentec Gmbh Drilling & Oilfield Systems
- AXON EP Inc
- Herrenknecht Vertical Gmbh
- Nabors Industries Ltd
- Drillmec Inc
- National-Oilwell Varco Inc
- Schlumberger Limited
- Atlas Copco Ltd
Notable Milestones in Top Drive Drilling Industry Sector
- January 2022: Abu Dhabi National Oil Company (ADNOC) awarded USD 1.94 billion in framework agreements to Adnoc Drilling, Schlumberger, Haliburton, and Weatherford, boosting drilling activities and supporting ADNOC’s production increase target.
In-Depth Top Drive Drilling Industry Market Outlook
The Top Drive Drilling market is poised for robust growth, driven by technological advancements, increasing oil and gas exploration activities, and a growing focus on sustainability. Strategic partnerships, market expansion into developing economies, and the continued adoption of efficient and environmentally friendly technologies present significant opportunities for market players. The market is expected to experience sustained growth throughout the forecast period (2025-2033).
Top Drive Drilling Industry Segmentation
-
1. Type
- 1.1. Electric Top Drive
- 1.2. Hydraulic Top Drive
-
2. Location of Deployment
- 2.1. Onshore
- 2.2. Offshore
Top Drive Drilling Industry Segmentation By Geography
- 1. North America
- 2. Europe
- 3. Asia Pacific
- 4. South America
- 5. Middle East and Africa
Top Drive Drilling Industry REPORT HIGHLIGHTS
| Aspects | Details |
|---|---|
| Study Period | 2019-2033 |
| Base Year | 2024 |
| Estimated Year | 2025 |
| Forecast Period | 2025-2033 |
| Historical Period | 2019-2024 |
| Growth Rate | CAGR of > 4.50% from 2019-2033 |
| Segmentation |
|
Table of Contents
- 1. Introduction
- 1.1. Research Scope
- 1.2. Market Segmentation
- 1.3. Research Methodology
- 1.4. Definitions and Assumptions
- 2. Executive Summary
- 2.1. Introduction
- 3. Market Dynamics
- 3.1. Introduction
- 3.2. Market Drivers
- 3.2.1. 4.; Improved Viability Of Offshore Oil And Gas Projects
- 3.3. Market Restrains
- 3.3.1. 4.; Ban On Offshore Exploration And Production Activities In Multiple Regions
- 3.4. Market Trends
- 3.4.1. Onshore Sector to Dominate the Market
- 4. Market Factor Analysis
- 4.1. Porters Five Forces
- 4.2. Supply/Value Chain
- 4.3. PESTEL analysis
- 4.4. Market Entropy
- 4.5. Patent/Trademark Analysis
- 5. Global Top Drive Drilling Industry Analysis, Insights and Forecast, 2019-2031
- 5.1. Market Analysis, Insights and Forecast - by Type
- 5.1.1. Electric Top Drive
- 5.1.2. Hydraulic Top Drive
- 5.2. Market Analysis, Insights and Forecast - by Location of Deployment
- 5.2.1. Onshore
- 5.2.2. Offshore
- 5.3. Market Analysis, Insights and Forecast - by Region
- 5.3.1. North America
- 5.3.2. Europe
- 5.3.3. Asia Pacific
- 5.3.4. South America
- 5.3.5. Middle East and Africa
- 5.1. Market Analysis, Insights and Forecast - by Type
- 6. North America Top Drive Drilling Industry Analysis, Insights and Forecast, 2019-2031
- 6.1. Market Analysis, Insights and Forecast - by Type
- 6.1.1. Electric Top Drive
- 6.1.2. Hydraulic Top Drive
- 6.2. Market Analysis, Insights and Forecast - by Location of Deployment
- 6.2.1. Onshore
- 6.2.2. Offshore
- 6.1. Market Analysis, Insights and Forecast - by Type
- 7. Europe Top Drive Drilling Industry Analysis, Insights and Forecast, 2019-2031
- 7.1. Market Analysis, Insights and Forecast - by Type
- 7.1.1. Electric Top Drive
- 7.1.2. Hydraulic Top Drive
- 7.2. Market Analysis, Insights and Forecast - by Location of Deployment
- 7.2.1. Onshore
- 7.2.2. Offshore
- 7.1. Market Analysis, Insights and Forecast - by Type
- 8. Asia Pacific Top Drive Drilling Industry Analysis, Insights and Forecast, 2019-2031
- 8.1. Market Analysis, Insights and Forecast - by Type
- 8.1.1. Electric Top Drive
- 8.1.2. Hydraulic Top Drive
- 8.2. Market Analysis, Insights and Forecast - by Location of Deployment
- 8.2.1. Onshore
- 8.2.2. Offshore
- 8.1. Market Analysis, Insights and Forecast - by Type
- 9. South America Top Drive Drilling Industry Analysis, Insights and Forecast, 2019-2031
- 9.1. Market Analysis, Insights and Forecast - by Type
- 9.1.1. Electric Top Drive
- 9.1.2. Hydraulic Top Drive
- 9.2. Market Analysis, Insights and Forecast - by Location of Deployment
- 9.2.1. Onshore
- 9.2.2. Offshore
- 9.1. Market Analysis, Insights and Forecast - by Type
- 10. Middle East and Africa Top Drive Drilling Industry Analysis, Insights and Forecast, 2019-2031
- 10.1. Market Analysis, Insights and Forecast - by Type
- 10.1.1. Electric Top Drive
- 10.1.2. Hydraulic Top Drive
- 10.2. Market Analysis, Insights and Forecast - by Location of Deployment
- 10.2.1. Onshore
- 10.2.2. Offshore
- 10.1. Market Analysis, Insights and Forecast - by Type
- 11. North America Top Drive Drilling Industry Analysis, Insights and Forecast, 2019-2031
- 11.1. Market Analysis, Insights and Forecast - By Country/Sub-region
- 11.1.1 United States
- 11.1.2 Canada
- 11.1.3 Mexico
- 12. Europe Top Drive Drilling Industry Analysis, Insights and Forecast, 2019-2031
- 12.1. Market Analysis, Insights and Forecast - By Country/Sub-region
- 12.1.1 Germany
- 12.1.2 United Kingdom
- 12.1.3 France
- 12.1.4 Spain
- 12.1.5 Italy
- 12.1.6 Spain
- 12.1.7 Belgium
- 12.1.8 Netherland
- 12.1.9 Nordics
- 12.1.10 Rest of Europe
- 13. Asia Pacific Top Drive Drilling Industry Analysis, Insights and Forecast, 2019-2031
- 13.1. Market Analysis, Insights and Forecast - By Country/Sub-region
- 13.1.1 China
- 13.1.2 Japan
- 13.1.3 India
- 13.1.4 South Korea
- 13.1.5 Southeast Asia
- 13.1.6 Australia
- 13.1.7 Indonesia
- 13.1.8 Phillipes
- 13.1.9 Singapore
- 13.1.10 Thailandc
- 13.1.11 Rest of Asia Pacific
- 14. South America Top Drive Drilling Industry Analysis, Insights and Forecast, 2019-2031
- 14.1. Market Analysis, Insights and Forecast - By Country/Sub-region
- 14.1.1 Brazil
- 14.1.2 Argentina
- 14.1.3 Peru
- 14.1.4 Chile
- 14.1.5 Colombia
- 14.1.6 Ecuador
- 14.1.7 Venezuela
- 14.1.8 Rest of South America
- 15. North America Top Drive Drilling Industry Analysis, Insights and Forecast, 2019-2031
- 15.1. Market Analysis, Insights and Forecast - By Country/Sub-region
- 15.1.1 United States
- 15.1.2 Canada
- 15.1.3 Mexico
- 16. MEA Top Drive Drilling Industry Analysis, Insights and Forecast, 2019-2031
- 16.1. Market Analysis, Insights and Forecast - By Country/Sub-region
- 16.1.1 United Arab Emirates
- 16.1.2 Saudi Arabia
- 16.1.3 South Africa
- 16.1.4 Rest of Middle East and Africa
- 17. Competitive Analysis
- 17.1. Global Market Share Analysis 2024
- 17.2. Company Profiles
- 17.2.1 Aker Solutions ASA
- 17.2.1.1. Overview
- 17.2.1.2. Products
- 17.2.1.3. SWOT Analysis
- 17.2.1.4. Recent Developments
- 17.2.1.5. Financials (Based on Availability)
- 17.2.2 China National Petroleum Corporation (CNPC)
- 17.2.2.1. Overview
- 17.2.2.2. Products
- 17.2.2.3. SWOT Analysis
- 17.2.2.4. Recent Developments
- 17.2.2.5. Financials (Based on Availability)
- 17.2.3 Warrior Rig Technologies Limited
- 17.2.3.1. Overview
- 17.2.3.2. Products
- 17.2.3.3. SWOT Analysis
- 17.2.3.4. Recent Developments
- 17.2.3.5. Financials (Based on Availability)
- 17.2.4 Bentec Gmbh Drilling & Oilfield Systems
- 17.2.4.1. Overview
- 17.2.4.2. Products
- 17.2.4.3. SWOT Analysis
- 17.2.4.4. Recent Developments
- 17.2.4.5. Financials (Based on Availability)
- 17.2.5 AXON EP Inc
- 17.2.5.1. Overview
- 17.2.5.2. Products
- 17.2.5.3. SWOT Analysis
- 17.2.5.4. Recent Developments
- 17.2.5.5. Financials (Based on Availability)
- 17.2.6 Herrenknecht Vertical Gmbh
- 17.2.6.1. Overview
- 17.2.6.2. Products
- 17.2.6.3. SWOT Analysis
- 17.2.6.4. Recent Developments
- 17.2.6.5. Financials (Based on Availability)
- 17.2.7 Nabors Industries Ltd*List Not Exhaustive
- 17.2.7.1. Overview
- 17.2.7.2. Products
- 17.2.7.3. SWOT Analysis
- 17.2.7.4. Recent Developments
- 17.2.7.5. Financials (Based on Availability)
- 17.2.8 Drillmec Inc
- 17.2.8.1. Overview
- 17.2.8.2. Products
- 17.2.8.3. SWOT Analysis
- 17.2.8.4. Recent Developments
- 17.2.8.5. Financials (Based on Availability)
- 17.2.9 National-Oilwell Varco Inc
- 17.2.9.1. Overview
- 17.2.9.2. Products
- 17.2.9.3. SWOT Analysis
- 17.2.9.4. Recent Developments
- 17.2.9.5. Financials (Based on Availability)
- 17.2.10 Schlumberger Limited
- 17.2.10.1. Overview
- 17.2.10.2. Products
- 17.2.10.3. SWOT Analysis
- 17.2.10.4. Recent Developments
- 17.2.10.5. Financials (Based on Availability)
- 17.2.11 Atlas Copco Ltd
- 17.2.11.1. Overview
- 17.2.11.2. Products
- 17.2.11.3. SWOT Analysis
- 17.2.11.4. Recent Developments
- 17.2.11.5. Financials (Based on Availability)
- 17.2.1 Aker Solutions ASA
List of Figures
- Figure 1: Global Top Drive Drilling Industry Revenue Breakdown (Million, %) by Region 2024 & 2032
- Figure 2: North America Top Drive Drilling Industry Revenue (Million), by Country 2024 & 2032
- Figure 3: North America Top Drive Drilling Industry Revenue Share (%), by Country 2024 & 2032
- Figure 4: Europe Top Drive Drilling Industry Revenue (Million), by Country 2024 & 2032
- Figure 5: Europe Top Drive Drilling Industry Revenue Share (%), by Country 2024 & 2032
- Figure 6: Asia Pacific Top Drive Drilling Industry Revenue (Million), by Country 2024 & 2032
- Figure 7: Asia Pacific Top Drive Drilling Industry Revenue Share (%), by Country 2024 & 2032
- Figure 8: South America Top Drive Drilling Industry Revenue (Million), by Country 2024 & 2032
- Figure 9: South America Top Drive Drilling Industry Revenue Share (%), by Country 2024 & 2032
- Figure 10: North America Top Drive Drilling Industry Revenue (Million), by Country 2024 & 2032
- Figure 11: North America Top Drive Drilling Industry Revenue Share (%), by Country 2024 & 2032
- Figure 12: MEA Top Drive Drilling Industry Revenue (Million), by Country 2024 & 2032
- Figure 13: MEA Top Drive Drilling Industry Revenue Share (%), by Country 2024 & 2032
- Figure 14: North America Top Drive Drilling Industry Revenue (Million), by Type 2024 & 2032
- Figure 15: North America Top Drive Drilling Industry Revenue Share (%), by Type 2024 & 2032
- Figure 16: North America Top Drive Drilling Industry Revenue (Million), by Location of Deployment 2024 & 2032
- Figure 17: North America Top Drive Drilling Industry Revenue Share (%), by Location of Deployment 2024 & 2032
- Figure 18: North America Top Drive Drilling Industry Revenue (Million), by Country 2024 & 2032
- Figure 19: North America Top Drive Drilling Industry Revenue Share (%), by Country 2024 & 2032
- Figure 20: Europe Top Drive Drilling Industry Revenue (Million), by Type 2024 & 2032
- Figure 21: Europe Top Drive Drilling Industry Revenue Share (%), by Type 2024 & 2032
- Figure 22: Europe Top Drive Drilling Industry Revenue (Million), by Location of Deployment 2024 & 2032
- Figure 23: Europe Top Drive Drilling Industry Revenue Share (%), by Location of Deployment 2024 & 2032
- Figure 24: Europe Top Drive Drilling Industry Revenue (Million), by Country 2024 & 2032
- Figure 25: Europe Top Drive Drilling Industry Revenue Share (%), by Country 2024 & 2032
- Figure 26: Asia Pacific Top Drive Drilling Industry Revenue (Million), by Type 2024 & 2032
- Figure 27: Asia Pacific Top Drive Drilling Industry Revenue Share (%), by Type 2024 & 2032
- Figure 28: Asia Pacific Top Drive Drilling Industry Revenue (Million), by Location of Deployment 2024 & 2032
- Figure 29: Asia Pacific Top Drive Drilling Industry Revenue Share (%), by Location of Deployment 2024 & 2032
- Figure 30: Asia Pacific Top Drive Drilling Industry Revenue (Million), by Country 2024 & 2032
- Figure 31: Asia Pacific Top Drive Drilling Industry Revenue Share (%), by Country 2024 & 2032
- Figure 32: South America Top Drive Drilling Industry Revenue (Million), by Type 2024 & 2032
- Figure 33: South America Top Drive Drilling Industry Revenue Share (%), by Type 2024 & 2032
- Figure 34: South America Top Drive Drilling Industry Revenue (Million), by Location of Deployment 2024 & 2032
- Figure 35: South America Top Drive Drilling Industry Revenue Share (%), by Location of Deployment 2024 & 2032
- Figure 36: South America Top Drive Drilling Industry Revenue (Million), by Country 2024 & 2032
- Figure 37: South America Top Drive Drilling Industry Revenue Share (%), by Country 2024 & 2032
- Figure 38: Middle East and Africa Top Drive Drilling Industry Revenue (Million), by Type 2024 & 2032
- Figure 39: Middle East and Africa Top Drive Drilling Industry Revenue Share (%), by Type 2024 & 2032
- Figure 40: Middle East and Africa Top Drive Drilling Industry Revenue (Million), by Location of Deployment 2024 & 2032
- Figure 41: Middle East and Africa Top Drive Drilling Industry Revenue Share (%), by Location of Deployment 2024 & 2032
- Figure 42: Middle East and Africa Top Drive Drilling Industry Revenue (Million), by Country 2024 & 2032
- Figure 43: Middle East and Africa Top Drive Drilling Industry Revenue Share (%), by Country 2024 & 2032
List of Tables
- Table 1: Global Top Drive Drilling Industry Revenue Million Forecast, by Region 2019 & 2032
- Table 2: Global Top Drive Drilling Industry Revenue Million Forecast, by Type 2019 & 2032
- Table 3: Global Top Drive Drilling Industry Revenue Million Forecast, by Location of Deployment 2019 & 2032
- Table 4: Global Top Drive Drilling Industry Revenue Million Forecast, by Region 2019 & 2032
- Table 5: Global Top Drive Drilling Industry Revenue Million Forecast, by Country 2019 & 2032
- Table 6: United States Top Drive Drilling Industry Revenue (Million) Forecast, by Application 2019 & 2032
- Table 7: Canada Top Drive Drilling Industry Revenue (Million) Forecast, by Application 2019 & 2032
- Table 8: Mexico Top Drive Drilling Industry Revenue (Million) Forecast, by Application 2019 & 2032
- Table 9: Global Top Drive Drilling Industry Revenue Million Forecast, by Country 2019 & 2032
- Table 10: Germany Top Drive Drilling Industry Revenue (Million) Forecast, by Application 2019 & 2032
- Table 11: United Kingdom Top Drive Drilling Industry Revenue (Million) Forecast, by Application 2019 & 2032
- Table 12: France Top Drive Drilling Industry Revenue (Million) Forecast, by Application 2019 & 2032
- Table 13: Spain Top Drive Drilling Industry Revenue (Million) Forecast, by Application 2019 & 2032
- Table 14: Italy Top Drive Drilling Industry Revenue (Million) Forecast, by Application 2019 & 2032
- Table 15: Spain Top Drive Drilling Industry Revenue (Million) Forecast, by Application 2019 & 2032
- Table 16: Belgium Top Drive Drilling Industry Revenue (Million) Forecast, by Application 2019 & 2032
- Table 17: Netherland Top Drive Drilling Industry Revenue (Million) Forecast, by Application 2019 & 2032
- Table 18: Nordics Top Drive Drilling Industry Revenue (Million) Forecast, by Application 2019 & 2032
- Table 19: Rest of Europe Top Drive Drilling Industry Revenue (Million) Forecast, by Application 2019 & 2032
- Table 20: Global Top Drive Drilling Industry Revenue Million Forecast, by Country 2019 & 2032
- Table 21: China Top Drive Drilling Industry Revenue (Million) Forecast, by Application 2019 & 2032
- Table 22: Japan Top Drive Drilling Industry Revenue (Million) Forecast, by Application 2019 & 2032
- Table 23: India Top Drive Drilling Industry Revenue (Million) Forecast, by Application 2019 & 2032
- Table 24: South Korea Top Drive Drilling Industry Revenue (Million) Forecast, by Application 2019 & 2032
- Table 25: Southeast Asia Top Drive Drilling Industry Revenue (Million) Forecast, by Application 2019 & 2032
- Table 26: Australia Top Drive Drilling Industry Revenue (Million) Forecast, by Application 2019 & 2032
- Table 27: Indonesia Top Drive Drilling Industry Revenue (Million) Forecast, by Application 2019 & 2032
- Table 28: Phillipes Top Drive Drilling Industry Revenue (Million) Forecast, by Application 2019 & 2032
- Table 29: Singapore Top Drive Drilling Industry Revenue (Million) Forecast, by Application 2019 & 2032
- Table 30: Thailandc Top Drive Drilling Industry Revenue (Million) Forecast, by Application 2019 & 2032
- Table 31: Rest of Asia Pacific Top Drive Drilling Industry Revenue (Million) Forecast, by Application 2019 & 2032
- Table 32: Global Top Drive Drilling Industry Revenue Million Forecast, by Country 2019 & 2032
- Table 33: Brazil Top Drive Drilling Industry Revenue (Million) Forecast, by Application 2019 & 2032
- Table 34: Argentina Top Drive Drilling Industry Revenue (Million) Forecast, by Application 2019 & 2032
- Table 35: Peru Top Drive Drilling Industry Revenue (Million) Forecast, by Application 2019 & 2032
- Table 36: Chile Top Drive Drilling Industry Revenue (Million) Forecast, by Application 2019 & 2032
- Table 37: Colombia Top Drive Drilling Industry Revenue (Million) Forecast, by Application 2019 & 2032
- Table 38: Ecuador Top Drive Drilling Industry Revenue (Million) Forecast, by Application 2019 & 2032
- Table 39: Venezuela Top Drive Drilling Industry Revenue (Million) Forecast, by Application 2019 & 2032
- Table 40: Rest of South America Top Drive Drilling Industry Revenue (Million) Forecast, by Application 2019 & 2032
- Table 41: Global Top Drive Drilling Industry Revenue Million Forecast, by Country 2019 & 2032
- Table 42: United States Top Drive Drilling Industry Revenue (Million) Forecast, by Application 2019 & 2032
- Table 43: Canada Top Drive Drilling Industry Revenue (Million) Forecast, by Application 2019 & 2032
- Table 44: Mexico Top Drive Drilling Industry Revenue (Million) Forecast, by Application 2019 & 2032
- Table 45: Global Top Drive Drilling Industry Revenue Million Forecast, by Country 2019 & 2032
- Table 46: United Arab Emirates Top Drive Drilling Industry Revenue (Million) Forecast, by Application 2019 & 2032
- Table 47: Saudi Arabia Top Drive Drilling Industry Revenue (Million) Forecast, by Application 2019 & 2032
- Table 48: South Africa Top Drive Drilling Industry Revenue (Million) Forecast, by Application 2019 & 2032
- Table 49: Rest of Middle East and Africa Top Drive Drilling Industry Revenue (Million) Forecast, by Application 2019 & 2032
- Table 50: Global Top Drive Drilling Industry Revenue Million Forecast, by Type 2019 & 2032
- Table 51: Global Top Drive Drilling Industry Revenue Million Forecast, by Location of Deployment 2019 & 2032
- Table 52: Global Top Drive Drilling Industry Revenue Million Forecast, by Country 2019 & 2032
- Table 53: Global Top Drive Drilling Industry Revenue Million Forecast, by Type 2019 & 2032
- Table 54: Global Top Drive Drilling Industry Revenue Million Forecast, by Location of Deployment 2019 & 2032
- Table 55: Global Top Drive Drilling Industry Revenue Million Forecast, by Country 2019 & 2032
- Table 56: Global Top Drive Drilling Industry Revenue Million Forecast, by Type 2019 & 2032
- Table 57: Global Top Drive Drilling Industry Revenue Million Forecast, by Location of Deployment 2019 & 2032
- Table 58: Global Top Drive Drilling Industry Revenue Million Forecast, by Country 2019 & 2032
- Table 59: Global Top Drive Drilling Industry Revenue Million Forecast, by Type 2019 & 2032
- Table 60: Global Top Drive Drilling Industry Revenue Million Forecast, by Location of Deployment 2019 & 2032
- Table 61: Global Top Drive Drilling Industry Revenue Million Forecast, by Country 2019 & 2032
- Table 62: Global Top Drive Drilling Industry Revenue Million Forecast, by Type 2019 & 2032
- Table 63: Global Top Drive Drilling Industry Revenue Million Forecast, by Location of Deployment 2019 & 2032
- Table 64: Global Top Drive Drilling Industry Revenue Million Forecast, by Country 2019 & 2032
Frequently Asked Questions
1. What is the projected Compound Annual Growth Rate (CAGR) of the Top Drive Drilling Industry?
The projected CAGR is approximately > 4.50%.
2. Which companies are prominent players in the Top Drive Drilling Industry?
Key companies in the market include Aker Solutions ASA, China National Petroleum Corporation (CNPC), Warrior Rig Technologies Limited, Bentec Gmbh Drilling & Oilfield Systems, AXON EP Inc, Herrenknecht Vertical Gmbh, Nabors Industries Ltd*List Not Exhaustive, Drillmec Inc, National-Oilwell Varco Inc, Schlumberger Limited, Atlas Copco Ltd.
3. What are the main segments of the Top Drive Drilling Industry?
The market segments include Type, Location of Deployment.
4. Can you provide details about the market size?
The market size is estimated to be USD XX Million as of 2022.
5. What are some drivers contributing to market growth?
4.; Improved Viability Of Offshore Oil And Gas Projects.
6. What are the notable trends driving market growth?
Onshore Sector to Dominate the Market.
7. Are there any restraints impacting market growth?
4.; Ban On Offshore Exploration And Production Activities In Multiple Regions.
8. Can you provide examples of recent developments in the market?
In January 2022, Abu Dhabi National Oil Company (ADNOC) awarded framework agreements worth USD 1.94 billion to four top-tier companies aiming to boost drilling activities. The contracts were awarded to Adnoc Drilling (a subsidiary of ADNOC), Schlumberger, Haliburton, and Weatherford. The framework agreement awards are likely to cover ADNOC's onshore and offshore fields and run for five years, with an option for a further two years. The deal builds on ADNOC's recent record investments in drilling-related equipment and services. It is also expected to support its strategy to boost crude oil production capacity to 5 mmbpd by 2030 and, thus, help the growth of the top drive systems market.
9. What pricing options are available for accessing the report?
Pricing options include single-user, multi-user, and enterprise licenses priced at USD 4750, USD 5250, and USD 8750 respectively.
10. Is the market size provided in terms of value or volume?
The market size is provided in terms of value, measured in Million.
11. Are there any specific market keywords associated with the report?
Yes, the market keyword associated with the report is "Top Drive Drilling Industry," which aids in identifying and referencing the specific market segment covered.
12. How do I determine which pricing option suits my needs best?
The pricing options vary based on user requirements and access needs. Individual users may opt for single-user licenses, while businesses requiring broader access may choose multi-user or enterprise licenses for cost-effective access to the report.
13. Are there any additional resources or data provided in the Top Drive Drilling Industry report?
While the report offers comprehensive insights, it's advisable to review the specific contents or supplementary materials provided to ascertain if additional resources or data are available.
14. How can I stay updated on further developments or reports in the Top Drive Drilling Industry?
To stay informed about further developments, trends, and reports in the Top Drive Drilling Industry, consider subscribing to industry newsletters, following relevant companies and organizations, or regularly checking reputable industry news sources and publications.
Methodology
Step 1 - Identification of Relevant Samples Size from Population Database


Step 2 - Approaches for Defining Global Market Size (Value, Volume* & Price*)

Note*: In applicable scenarios
Step 3 - Data Sources
Primary Research
- Web Analytics
- Survey Reports
- Research Institute
- Latest Research Reports
- Opinion Leaders
Secondary Research
- Annual Reports
- White Paper
- Latest Press Release
- Industry Association
- Paid Database
- Investor Presentations

Step 4 - Data Triangulation
Involves using different sources of information in order to increase the validity of a study
These sources are likely to be stakeholders in a program - participants, other researchers, program staff, other community members, and so on.
Then we put all data in single framework & apply various statistical tools to find out the dynamic on the market.
During the analysis stage, feedback from the stakeholder groups would be compared to determine areas of agreement as well as areas of divergence
