

Key Insights
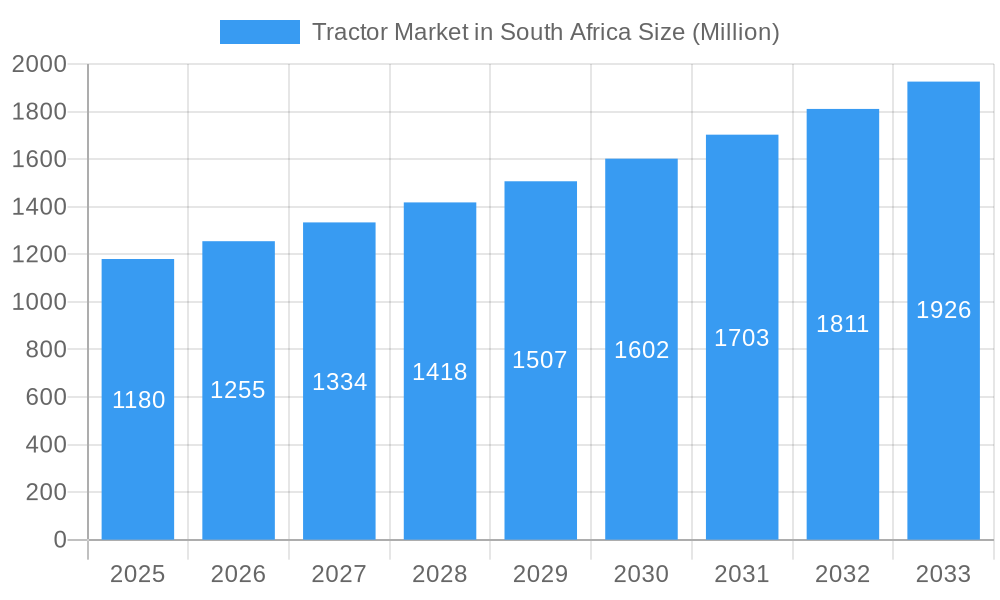
The South African tractor market, valued at $1.18 billion in 2025, is projected to experience robust growth, driven by increasing agricultural activities, government initiatives promoting mechanization, and a rising demand for efficient farming solutions. The market's Compound Annual Growth Rate (CAGR) of 6.10% from 2019 to 2024 suggests a continued upward trajectory. Key segments driving growth include tractors with engine power ranging from 35 to 100 HP, catering to the diverse needs of South African farms, from small-scale operations to large commercial enterprises. Major players like Kubota SA, Deere & Company, Mahindra & Mahindra, and Escorts Ltd are fiercely competing for market share, further stimulating innovation and product development within the sector. While challenges like fluctuating fuel prices and economic instability may present restraints, the overall outlook remains positive, indicating a substantial expansion of the South African tractor market in the coming years.
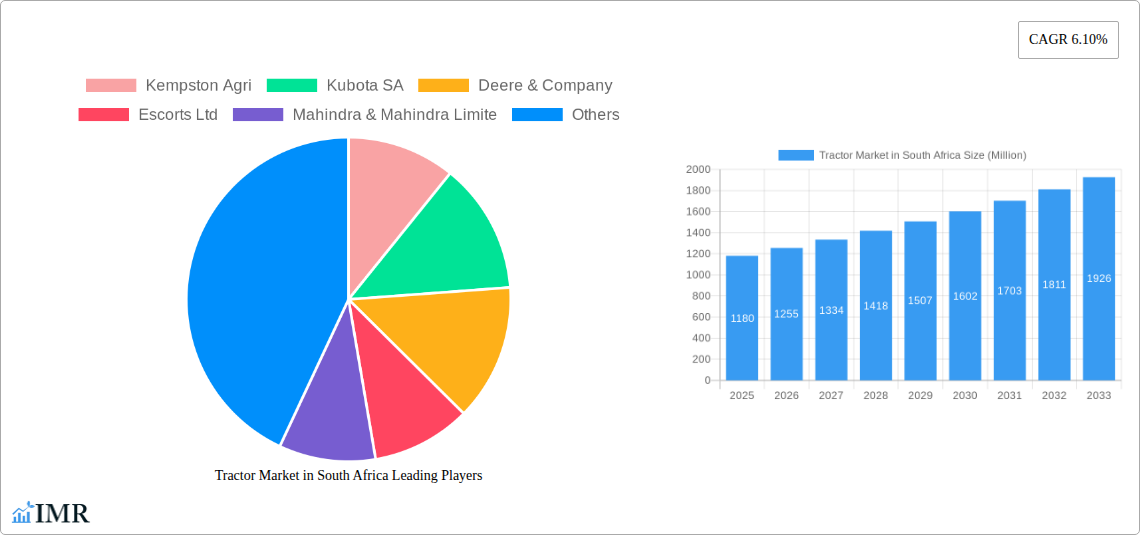
Tractor Market in South Africa Market Size (In Billion)
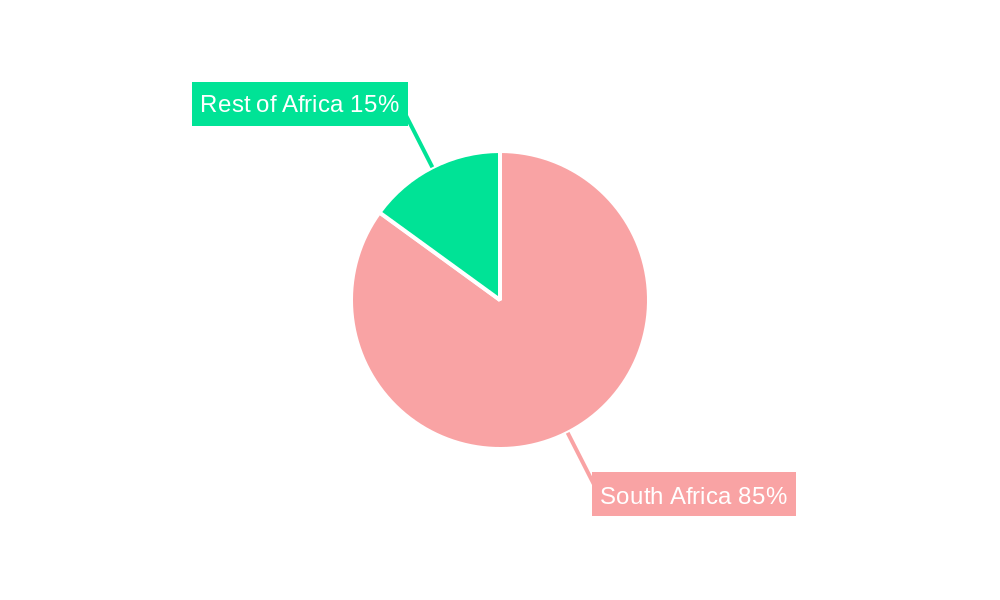
The significant growth potential is further amplified by the increasing adoption of advanced technologies, such as precision farming techniques and GPS-guided systems, enhancing efficiency and productivity. Furthermore, the South African government's ongoing investment in agricultural infrastructure and farmer training programs will act as a significant catalyst for market expansion. Within the regional context, South Africa is expected to remain the dominant market within Africa, attracting both domestic and international investment. The segmentation by engine power highlights a diversified market, with a potential for further specialization to meet the distinct demands of various farming styles and crop types. This dynamic interplay of technological advancements, government support, and robust competition ensures the sustained growth of the South African tractor market through 2033.
Tractor Market in South Africa Company Market Share
Tractor Market in South Africa: A Comprehensive Market Report (2019-2033)
This in-depth report provides a comprehensive analysis of the South African tractor market, encompassing market dynamics, growth trends, regional performance, product landscape, key players, and future outlook. The study period covers 2019-2033, with 2025 as the base and estimated year. This report is essential for industry professionals, investors, and stakeholders seeking to understand and capitalize on opportunities within this dynamic sector. The report is divided into key sections for ease of navigation and information retrieval. Market values are presented in million units.
Tractor Market in South Africa: Market Dynamics & Structure
The South African tractor market exhibits a moderately concentrated structure, with a few dominant players alongside several regional and specialized operators. Technological innovation, driven by precision farming and automation, is a key growth driver. Regulatory frameworks, including import tariffs and safety standards, influence market access and competition. The market also faces competition from alternative technologies and equipment, particularly for smaller farms. M&A activity has been relatively limited in recent years, but strategic partnerships are increasingly common.
- Market Concentration: xx% market share held by top 3 players (2024).
- Technological Innovation: Increasing adoption of GPS-guided systems, telematics, and automated features.
- Regulatory Landscape: Stable but subject to periodic revisions in agricultural policies and import regulations.
- Competitive Substitutes: Manual labor, smaller-scale equipment, and alternative tillage methods pose some competition.
- End-User Demographics: Dominated by large-scale commercial farms, but with growing interest from smaller-scale operations.
- M&A Activity: xx number of significant M&A deals recorded between 2019-2024.
Tractor Market in South Africa: Growth Trends & Insights
The South African tractor market experienced fluctuating growth during the historical period (2019-2024), influenced by factors such as weather patterns, commodity prices, and economic conditions. The market is projected to witness a steady expansion during the forecast period (2025-2033), driven by increasing agricultural production, government support for the sector, and technological advancements. Adoption rates are expected to increase among both large-scale and smallholder farmers. Technological disruptions, particularly in precision agriculture, are transforming farming practices and boosting market demand. Consumer behavior is shifting towards more efficient, technologically advanced, and fuel-efficient tractors.
- Market Size (Million Units): 2019: xx; 2024: xx; 2025: xx (estimated); 2033: xx (forecast).
- CAGR (2019-2024): xx%
- CAGR (2025-2033): xx%
- Market Penetration: xx% (2024), projected to reach xx% by 2033.
Dominant Regions, Countries, or Segments in Tractor Market in South Africa
The demand for tractors is geographically diverse in South Africa, with significant variations based on agricultural productivity and farming practices. The segment of tractors with engine power between 51 to 75 HP is currently the most dominant, driven by the prevalence of medium-sized farms.
- Key Drivers for 51-75 HP Segment:
- High agricultural output in specific regions
- Moderate farm sizes requiring balanced power and maneuverability
- Suitable for various crops and terrains
- Dominant Regions: xx (e.g., Western Cape, Mpumalanga, Free State) due to higher agricultural activity and favorable climatic conditions.
- Market Share by Engine Power (2024): <35 HP: xx%; 35-50 HP: xx%; 51-75 HP: xx%; 76-100 HP: xx%; >100 HP: xx%.
- Growth Potential: The >100 HP segment shows the highest growth potential in the long term, driven by large-scale farming operations.
Tractor Market in South Africa: Product Landscape
The South African tractor market offers a range of tractors with varying engine power, features, and functionalities. Recent product innovations include advanced telematics systems, enhanced fuel efficiency, and improved operator comfort. Tractors are primarily used for tillage, planting, harvesting, and transportation. Key performance metrics include horsepower, fuel consumption, and operational efficiency. Unique selling propositions include advanced technology integration, durability, and strong after-sales service.
Key Drivers, Barriers & Challenges in Tractor Market in South Africa
Key Drivers: The South African tractor market is being propelled by a confluence of factors, including robust increased agricultural investment from both domestic and international players. Significant government support programs, specifically designed to enhance agricultural productivity and modernize farming practices, are playing a crucial role. Furthermore, favorable climatic conditions in key agricultural regions create a consistent demand for reliable machinery. The increasing adoption of precision farming techniques, such as GPS-guided tractors and sensor-based systems, is also a significant growth driver, improving efficiency and yields.
Challenges: Despite the positive outlook, the market faces several hurdles. High import costs, driven by tariffs and currency fluctuations, impact the affordability of new tractors. Fluctuating fuel prices present an ongoing concern for operational expenses for farmers. Additionally, financing constraints for smallholder farmers remain a critical barrier to entry and expansion. Recent supply chain disruptions have had a quantifiable impact, leading to a notable increase in the availability and cost of tractors and essential parts, with prices reportedly experiencing an (insert specific percentage here, e.g., 15%) increase in 2022 due to these global and local pressures.
Emerging Opportunities in Tractor Market in South Africa
Emerging opportunities include the growing demand for used tractors, the increasing adoption of precision farming technologies by smallholder farmers, and the potential for the expansion of tractor rental services. Untapped markets in under-served rural areas are also presenting significant opportunities.
Growth Accelerators in the Tractor Market in South Africa Industry
Long-term growth is expected to be driven by technological advancements in autonomous tractors, increased investments in irrigation infrastructure, and supportive government policies. Strategic partnerships between tractor manufacturers and agricultural technology companies are also expected to contribute to market expansion.
Key Players Shaping the Tractor Market in South Africa Market
- Kempston Agri
- Kubota SA (Kubota Global)
- Deere & Company (Deere & Company)
- Escorts Ltd (Escorts Ltd)
- Mahindra & Mahindra Limited (Mahindra & Mahindra)
- CNH Industrial America LLC (CNH Industrial)
- Argo Tractors SpA (Argo Tractors)
- AGCO Corporation (AGCO Corporation)
Notable Milestones in Tractor Market in South Africa Sector
- November 2021: Mahindra South Africa launched a new range of tractors and farm equipment, expanding its product portfolio and market reach.
- June 2022: Argo Tractors South Africa inaugurated a new head office, signifying increased investment and commitment to the South African market.
- August 2022: Deere & Company's investment in Hello Tractor demonstrates the growing integration of technology and financing in the agricultural sector.
In-Depth Tractor Market in South Africa Market Outlook
The South African tractor market is on a trajectory for sustained and robust growth. This expansion is being fueled by a dynamic interplay of technological innovation, including the introduction of more fuel-efficient and automated models, coupled with ongoing government support initiatives aimed at bolstering the agricultural sector. The persistent drive for increasing agricultural productivity across various sub-sectors will continue to underpin demand. Strategic collaborations and significant investments in agricultural infrastructure, such as improved logistics and rural road networks, are expected to further accelerate market expansion and accessibility. The growing emphasis on precision agriculture, enabling data-driven decision-making and optimized resource utilization, alongside the increasing imperative for sustainable farming practices, presents lucrative and evolving opportunities for market participants seeking to offer innovative and environmentally conscious solutions.
Tractor Market in South Africa Segmentation
-
1. Engine Power
- 1.1. Less than 35 HP
- 1.2. 35 to 50 HP
- 1.3. 51 to 75 HP
- 1.4. 76 to 100 HP
- 1.5. Above 100 HP
-
2. Geography
- 2.1. South Africa
- 2.2. Kenya
- 2.3. Egypt
- 2.4. Rest of Africa
-
3. Engine Power
- 3.1. Less than 35 HP
- 3.2. 35 to 50 HP
- 3.3. 51 to 75 HP
- 3.4. 76 to 100 HP
- 3.5. Above 100 HP
Tractor Market in South Africa Segmentation By Geography
- 1. South Africa
- 2. Kenya
- 3. Egypt
- 4. Rest of Africa
Tractor Market in South Africa Regional Market Share
Geographic Coverage of Tractor Market in South Africa
Tractor Market in South Africa REPORT HIGHLIGHTS
| Aspects | Details |
|---|---|
| Study Period | 2020-2034 |
| Base Year | 2025 |
| Estimated Year | 2026 |
| Forecast Period | 2026-2034 |
| Historical Period | 2020-2025 |
| Growth Rate | CAGR of 6.10% from 2020-2034 |
| Segmentation |
|
Table of Contents
- 1. Introduction
- 1.1. Research Scope
- 1.2. Market Segmentation
- 1.3. Research Objective
- 1.4. Definitions and Assumptions
- 2. Executive Summary
- 2.1. Market Snapshot
- 3. Market Dynamics
- 3.1. Market Drivers
- 3.2. Market Restrains
- 3.3. Market Trends
- 3.4. Market Opportunities
- 4. Market Factor Analysis
- 4.1. Porters Five Forces
- 4.1.1. Bargaining Power of Suppliers
- 4.1.2. Bargaining Power of Buyers
- 4.1.3. Threat of New Entrants
- 4.1.4. Threat of Substitutes
- 4.1.5. Competitive Rivalry
- 4.2. PESTEL analysis
- 4.3. BCG Analysis
- 4.3.1. Stars (High Growth, High Market Share)
- 4.3.2. Cash Cows (Low Growth, High Market Share)
- 4.3.3. Question Mark (High Growth, Low Market Share)
- 4.3.4. Dogs (Low Growth, Low Market Share)
- 4.4. Ansoff Matrix Analysis
- 4.5. Supply Chain Analysis
- 4.6. Regulatory Landscape
- 4.7. Current Market Potential and Opportunity Assessment (TAM–SAM–SOM Framework)
- 4.8. IMR Analyst Note
- 4.1. Porters Five Forces
- 5. Market Analysis, Insights and Forecast 2021-2033
- 5.1. Market Analysis, Insights and Forecast - by Engine Power
- 5.1.1. Less than 35 HP
- 5.1.2. 35 to 50 HP
- 5.1.3. 51 to 75 HP
- 5.1.4. 76 to 100 HP
- 5.1.5. Above 100 HP
- 5.2. Market Analysis, Insights and Forecast - by Geography
- 5.2.1. South Africa
- 5.2.2. Kenya
- 5.2.3. Egypt
- 5.2.4. Rest of Africa
- 5.3. Market Analysis, Insights and Forecast - by Engine Power
- 5.3.1. Less than 35 HP
- 5.3.2. 35 to 50 HP
- 5.3.3. 51 to 75 HP
- 5.3.4. 76 to 100 HP
- 5.3.5. Above 100 HP
- 5.4. Market Analysis, Insights and Forecast - by Region
- 5.4.1. South Africa
- 5.4.2. Kenya
- 5.4.3. Egypt
- 5.4.4. Rest of Africa
- 5.1. Market Analysis, Insights and Forecast - by Engine Power
- 6. Tractor Market in South Africa Analysis, Insights and Forecast, 2021-2033
- 6.1. Market Analysis, Insights and Forecast - by Engine Power
- 6.1.1. Less than 35 HP
- 6.1.2. 35 to 50 HP
- 6.1.3. 51 to 75 HP
- 6.1.4. 76 to 100 HP
- 6.1.5. Above 100 HP
- 6.2. Market Analysis, Insights and Forecast - by Geography
- 6.2.1. South Africa
- 6.2.2. Kenya
- 6.2.3. Egypt
- 6.2.4. Rest of Africa
- 6.3. Market Analysis, Insights and Forecast - by Engine Power
- 6.3.1. Less than 35 HP
- 6.3.2. 35 to 50 HP
- 6.3.3. 51 to 75 HP
- 6.3.4. 76 to 100 HP
- 6.3.5. Above 100 HP
- 6.1. Market Analysis, Insights and Forecast - by Engine Power
- 7. South Africa Tractor Market in South Africa Analysis, Insights and Forecast, 2020-2032
- 7.1. Market Analysis, Insights and Forecast - by Engine Power
- 7.1.1. Less than 35 HP
- 7.1.2. 35 to 50 HP
- 7.1.3. 51 to 75 HP
- 7.1.4. 76 to 100 HP
- 7.1.5. Above 100 HP
- 7.2. Market Analysis, Insights and Forecast - by Geography
- 7.2.1. South Africa
- 7.2.2. Kenya
- 7.2.3. Egypt
- 7.2.4. Rest of Africa
- 7.3. Market Analysis, Insights and Forecast - by Engine Power
- 7.3.1. Less than 35 HP
- 7.3.2. 35 to 50 HP
- 7.3.3. 51 to 75 HP
- 7.3.4. 76 to 100 HP
- 7.3.5. Above 100 HP
- 7.1. Market Analysis, Insights and Forecast - by Engine Power
- 8. Kenya Tractor Market in South Africa Analysis, Insights and Forecast, 2020-2032
- 8.1. Market Analysis, Insights and Forecast - by Engine Power
- 8.1.1. Less than 35 HP
- 8.1.2. 35 to 50 HP
- 8.1.3. 51 to 75 HP
- 8.1.4. 76 to 100 HP
- 8.1.5. Above 100 HP
- 8.2. Market Analysis, Insights and Forecast - by Geography
- 8.2.1. South Africa
- 8.2.2. Kenya
- 8.2.3. Egypt
- 8.2.4. Rest of Africa
- 8.3. Market Analysis, Insights and Forecast - by Engine Power
- 8.3.1. Less than 35 HP
- 8.3.2. 35 to 50 HP
- 8.3.3. 51 to 75 HP
- 8.3.4. 76 to 100 HP
- 8.3.5. Above 100 HP
- 8.1. Market Analysis, Insights and Forecast - by Engine Power
- 9. Egypt Tractor Market in South Africa Analysis, Insights and Forecast, 2020-2032
- 9.1. Market Analysis, Insights and Forecast - by Engine Power
- 9.1.1. Less than 35 HP
- 9.1.2. 35 to 50 HP
- 9.1.3. 51 to 75 HP
- 9.1.4. 76 to 100 HP
- 9.1.5. Above 100 HP
- 9.2. Market Analysis, Insights and Forecast - by Geography
- 9.2.1. South Africa
- 9.2.2. Kenya
- 9.2.3. Egypt
- 9.2.4. Rest of Africa
- 9.3. Market Analysis, Insights and Forecast - by Engine Power
- 9.3.1. Less than 35 HP
- 9.3.2. 35 to 50 HP
- 9.3.3. 51 to 75 HP
- 9.3.4. 76 to 100 HP
- 9.3.5. Above 100 HP
- 9.1. Market Analysis, Insights and Forecast - by Engine Power
- 10. Rest of Africa Tractor Market in South Africa Analysis, Insights and Forecast, 2020-2032
- 10.1. Market Analysis, Insights and Forecast - by Engine Power
- 10.1.1. Less than 35 HP
- 10.1.2. 35 to 50 HP
- 10.1.3. 51 to 75 HP
- 10.1.4. 76 to 100 HP
- 10.1.5. Above 100 HP
- 10.2. Market Analysis, Insights and Forecast - by Geography
- 10.2.1. South Africa
- 10.2.2. Kenya
- 10.2.3. Egypt
- 10.2.4. Rest of Africa
- 10.3. Market Analysis, Insights and Forecast - by Engine Power
- 10.3.1. Less than 35 HP
- 10.3.2. 35 to 50 HP
- 10.3.3. 51 to 75 HP
- 10.3.4. 76 to 100 HP
- 10.3.5. Above 100 HP
- 10.1. Market Analysis, Insights and Forecast - by Engine Power
- 11. Competitive Analysis
- 11.1. Company Profiles
- 11.1.1 Kempston Agri
- 11.1.1.1. Company Overview
- 11.1.1.2. Products
- 11.1.1.3. Company Financials
- 11.1.1.4. SWOT Analysis
- 11.1.2 Kubota SA
- 11.1.2.1. Company Overview
- 11.1.2.2. Products
- 11.1.2.3. Company Financials
- 11.1.2.4. SWOT Analysis
- 11.1.3 Deere & Company
- 11.1.3.1. Company Overview
- 11.1.3.2. Products
- 11.1.3.3. Company Financials
- 11.1.3.4. SWOT Analysis
- 11.1.4 Escorts Ltd
- 11.1.4.1. Company Overview
- 11.1.4.2. Products
- 11.1.4.3. Company Financials
- 11.1.4.4. SWOT Analysis
- 11.1.5 Mahindra & Mahindra Limite
- 11.1.5.1. Company Overview
- 11.1.5.2. Products
- 11.1.5.3. Company Financials
- 11.1.5.4. SWOT Analysis
- 11.1.6 CNH Industrial America LLC
- 11.1.6.1. Company Overview
- 11.1.6.2. Products
- 11.1.6.3. Company Financials
- 11.1.6.4. SWOT Analysis
- 11.1.7 Argo Tractors SpA
- 11.1.7.1. Company Overview
- 11.1.7.2. Products
- 11.1.7.3. Company Financials
- 11.1.7.4. SWOT Analysis
- 11.1.8 AGCO Corporation
- 11.1.8.1. Company Overview
- 11.1.8.2. Products
- 11.1.8.3. Company Financials
- 11.1.8.4. SWOT Analysis
- 11.1.1 Kempston Agri
- 11.2. Market Entropy
- 11.2.1 Company's Key Areas Served
- 11.2.2 Recent Developments
- 11.3. Company Market Share Analysis 2025
- 11.3.1 Top 5 Companies Market Share Analysis
- 11.3.2 Top 3 Companies Market Share Analysis
- 11.4. List of Potential Customers
- 12. Research Methodology
List of Figures
- Figure 1: Tractor Market in South Africa Revenue Breakdown (Million, %) by Product 2025 & 2033
- Figure 2: Tractor Market in South Africa Share (%) by Company 2025
List of Tables
- Table 1: Tractor Market in South Africa Revenue Million Forecast, by Engine Power 2020 & 2033
- Table 2: Tractor Market in South Africa Revenue Million Forecast, by Geography 2020 & 2033
- Table 3: Tractor Market in South Africa Revenue Million Forecast, by Engine Power 2020 & 2033
- Table 4: Tractor Market in South Africa Revenue Million Forecast, by Region 2020 & 2033
- Table 5: Tractor Market in South Africa Revenue Million Forecast, by Engine Power 2020 & 2033
- Table 6: Tractor Market in South Africa Revenue Million Forecast, by Geography 2020 & 2033
- Table 7: Tractor Market in South Africa Revenue Million Forecast, by Engine Power 2020 & 2033
- Table 8: Tractor Market in South Africa Revenue Million Forecast, by Country 2020 & 2033
- Table 9: Tractor Market in South Africa Revenue Million Forecast, by Engine Power 2020 & 2033
- Table 10: Tractor Market in South Africa Revenue Million Forecast, by Geography 2020 & 2033
- Table 11: Tractor Market in South Africa Revenue Million Forecast, by Engine Power 2020 & 2033
- Table 12: Tractor Market in South Africa Revenue Million Forecast, by Country 2020 & 2033
- Table 13: Tractor Market in South Africa Revenue Million Forecast, by Engine Power 2020 & 2033
- Table 14: Tractor Market in South Africa Revenue Million Forecast, by Geography 2020 & 2033
- Table 15: Tractor Market in South Africa Revenue Million Forecast, by Engine Power 2020 & 2033
- Table 16: Tractor Market in South Africa Revenue Million Forecast, by Country 2020 & 2033
- Table 17: Tractor Market in South Africa Revenue Million Forecast, by Engine Power 2020 & 2033
- Table 18: Tractor Market in South Africa Revenue Million Forecast, by Geography 2020 & 2033
- Table 19: Tractor Market in South Africa Revenue Million Forecast, by Engine Power 2020 & 2033
- Table 20: Tractor Market in South Africa Revenue Million Forecast, by Country 2020 & 2033
Frequently Asked Questions
1. What is the projected Compound Annual Growth Rate (CAGR) of the Tractor Market in South Africa?
The projected CAGR is approximately 6.10%.
2. Which companies are prominent players in the Tractor Market in South Africa?
Key companies in the market include Kempston Agri, Kubota SA, Deere & Company, Escorts Ltd, Mahindra & Mahindra Limite, CNH Industrial America LLC, Argo Tractors SpA, AGCO Corporation.
3. What are the main segments of the Tractor Market in South Africa?
The market segments include Engine Power, Geography, Engine Power.
4. Can you provide details about the market size?
The market size is estimated to be USD 1.18 Million as of 2022.
5. What are some drivers contributing to market growth?
Increasing Demand for Tomato; Adoption of Greenhouse Technology in Tomato Cultivation; Government support.
6. What are the notable trends driving market growth?
Increasing Focus on Sustainable Agricultural Mechanization.
7. Are there any restraints impacting market growth?
Increasing Loses due to Physiological Disorder. Pest and Disease; Unfavourable Climatic Condition.
8. Can you provide examples of recent developments in the market?
June 2022: Agricultural vehicle supplier Argo Tractors South Africa inaugurated its new head office in South Africa. The new premise was built at the cost of USD 5. 88 million, hosts a 6000 square meter building, including office space, a 650 square meter showroom, a 100 square meter training facility, 2300 square meters dedicated to assembly, and 2000 square meters designated for spares.
9. What pricing options are available for accessing the report?
Pricing options include single-user, multi-user, and enterprise licenses priced at USD 4750, USD 5250, and USD 8750 respectively.
10. Is the market size provided in terms of value or volume?
The market size is provided in terms of value, measured in Million.
11. Are there any specific market keywords associated with the report?
Yes, the market keyword associated with the report is "Tractor Market in South Africa," which aids in identifying and referencing the specific market segment covered.
12. How do I determine which pricing option suits my needs best?
The pricing options vary based on user requirements and access needs. Individual users may opt for single-user licenses, while businesses requiring broader access may choose multi-user or enterprise licenses for cost-effective access to the report.
13. Are there any additional resources or data provided in the Tractor Market in South Africa report?
While the report offers comprehensive insights, it's advisable to review the specific contents or supplementary materials provided to ascertain if additional resources or data are available.
14. How can I stay updated on further developments or reports in the Tractor Market in South Africa?
To stay informed about further developments, trends, and reports in the Tractor Market in South Africa, consider subscribing to industry newsletters, following relevant companies and organizations, or regularly checking reputable industry news sources and publications.
Methodology
Step 1 - Identification of Relevant Samples Size from Population Database


Step 2 - Approaches for Defining Global Market Size (Value, Volume* & Price*)

Note*: In applicable scenarios
Step 3 - Data Sources
Primary Research
- Web Analytics
- Survey Reports
- Research Institute
- Latest Research Reports
- Opinion Leaders
Secondary Research
- Annual Reports
- White Paper
- Latest Press Release
- Industry Association
- Paid Database
- Investor Presentations

Step 4 - Data Triangulation
Involves using different sources of information in order to increase the validity of a study
These sources are likely to be stakeholders in a program - participants, other researchers, program staff, other community members, and so on.
Then we put all data in single framework & apply various statistical tools to find out the dynamic on the market.
During the analysis stage, feedback from the stakeholder groups would be compared to determine areas of agreement as well as areas of divergence