

Key Insights
The global bio insecticides market is experiencing robust growth, projected to reach a substantial size driven by increasing consumer demand for environmentally friendly agricultural practices and stringent regulations on chemical pesticides. The market's Compound Annual Growth Rate (CAGR) of 12.30% from 2019 to 2024 indicates a significant upward trajectory, with further expansion expected through 2033. Key drivers include the rising awareness of the harmful effects of synthetic pesticides on human health and the environment, coupled with the growing adoption of sustainable agriculture practices globally. The increasing prevalence of insect-resistant crops is also fueling demand for effective bioinsecticide solutions. Market segmentation reveals significant application across various crops, with grains & cereals, pulses & oilseeds, and fruits & vegetables representing major segments. Leading players like Marrone Bio Innovations, Bayer CropScience AG, and others are investing heavily in research and development to introduce innovative and effective bioinsecticides, further stimulating market growth.
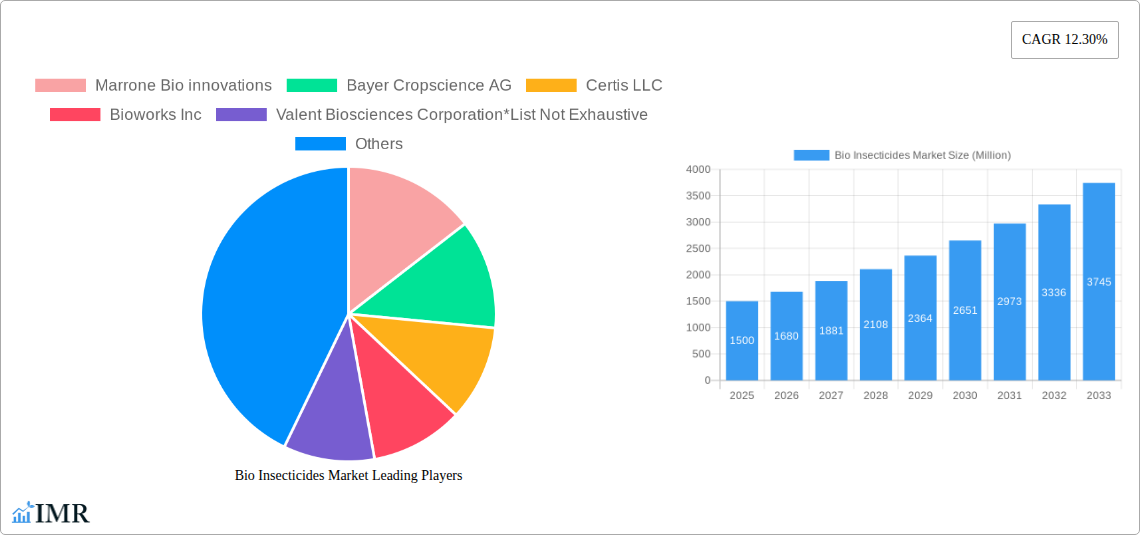
Bio Insecticides Market Market Size (In Billion)
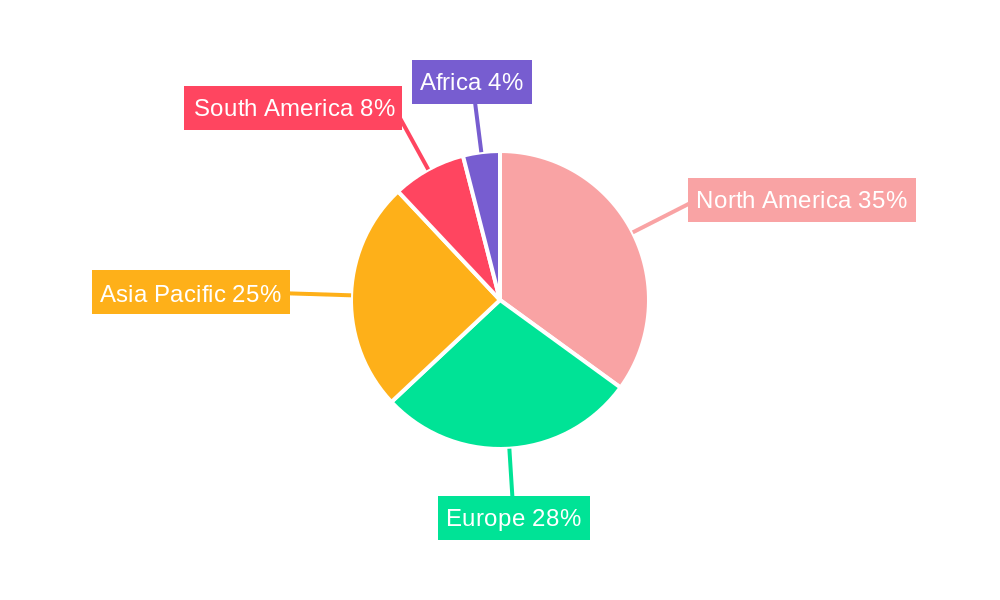
The regional distribution of the bio insecticides market shows a strong presence across North America, Europe, and Asia-Pacific, with significant growth potential in emerging markets. North America is currently a dominant region due to high adoption rates of sustainable agricultural techniques and a strong regulatory framework supporting biopesticides. However, Asia-Pacific is projected to witness accelerated growth due to the expanding agricultural sector and increasing awareness of the benefits of bioinsecticides. While the market faces certain restraints such as high initial investment costs for farmers and potential efficacy limitations compared to chemical pesticides in some applications, the overall trend indicates continued expansion driven by strong consumer preferences for organic and sustainably produced food. The market is characterized by intense competition, with both established players and emerging companies vying for market share through innovation and strategic partnerships.
Bio Insecticides Market Company Market Share
Bio Insecticides Market: A Comprehensive Report (2019-2033)
This comprehensive report provides an in-depth analysis of the Bio Insecticides Market, encompassing market dynamics, growth trends, regional dominance, product landscape, key players, and future outlook. The study period covers 2019-2033, with a base year of 2025 and a forecast period of 2025-2033. The report leverages extensive primary and secondary research to deliver actionable insights for industry professionals, investors, and stakeholders. The parent market is the broader agricultural pesticides market, while the child market focuses specifically on biologically-derived insecticides. Market values are presented in million units.
Bio Insecticides Market Dynamics & Structure
The Bio Insecticides market is characterized by moderate concentration, with several major players vying for market share alongside numerous smaller, specialized firms. Technological innovation, driven by advancements in biotechnology and genetic engineering, is a key driver. Stringent regulatory frameworks governing pesticide use impact market growth and necessitate compliance. The market faces competition from traditional chemical insecticides, although consumer preference for sustainable agricultural practices is increasingly favoring bio-insecticides. M&A activity is moderate, with strategic acquisitions aimed at expanding product portfolios and geographical reach.
- Market Concentration: Moderately concentrated, with a Herfindahl-Hirschman Index (HHI) estimated at xx.
- Technological Innovation: Significant advancements in microbial-based and bio-pesticide formulations.
- Regulatory Framework: Stringent regulations governing registration and usage, creating both challenges and opportunities.
- Competitive Substitutes: Chemical insecticides represent the main competitive pressure.
- M&A Trends: Moderate activity, focused on expansion and diversification. xx M&A deals recorded between 2019-2024.
- Innovation Barriers: High R&D costs and lengthy regulatory approval processes.
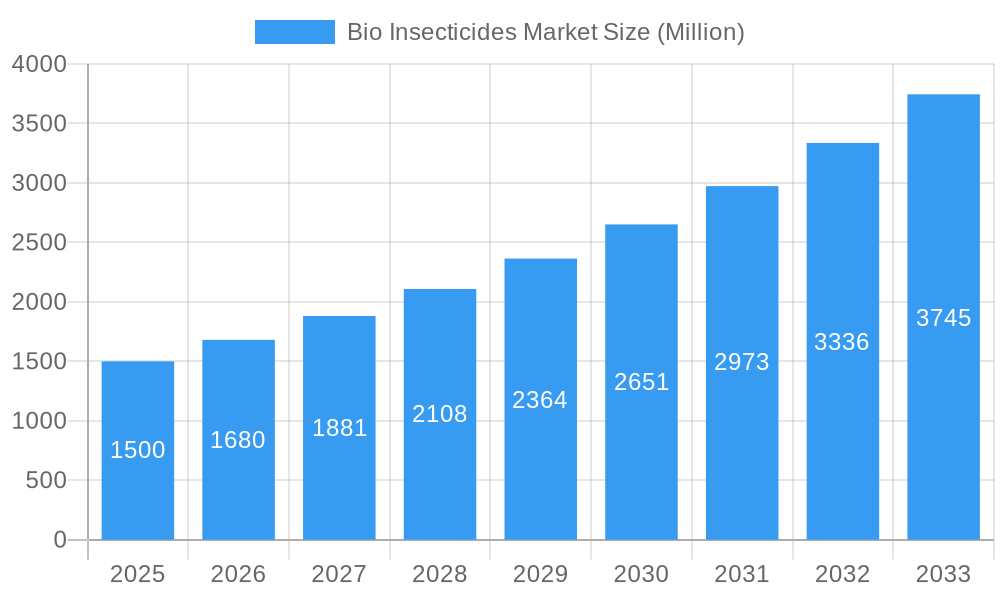
Bio Insecticides Market Growth Trends & Insights
The Bio Insecticides market experienced robust growth during the historical period (2019-2024), driven by rising consumer awareness of environmentally friendly farming practices and growing concerns about pesticide residues in food. The market size reached xx million units in 2024, and is projected to reach xx million units in 2025. Technological disruptions, such as the development of novel biopesticides and improved application methods, are accelerating market adoption. The increasing demand for organic and sustainably produced food is fueling growth across various agricultural segments. The market is expected to exhibit a CAGR of xx% during the forecast period (2025-2033), reaching an estimated market size of xx million units by 2033. Market penetration is expected to increase from xx% in 2025 to xx% by 2033, driven by wider adoption in various crop applications.
Dominant Regions, Countries, or Segments in Bio Insecticides Market
North America currently holds the largest market share in the Bio Insecticides market, driven by strong demand for organic produce and stringent regulations favoring bio-pesticides. Europe follows closely, with substantial growth propelled by similar factors. Within application segments, Grains & Cereals represent the largest market segment, due to extensive acreage and high pest pressures. Fruits & Vegetables are a rapidly expanding segment, fueled by rising consumer preference for organically grown fruits and vegetables.
- North America: High consumer demand for organic products and favorable regulatory environment.
- Europe: Similar to North America, with strong environmental regulations and consumer awareness.
- Asia-Pacific: Rapid growth potential, though hampered by lower awareness in certain regions and less stringent regulations in some areas.
- Grains & Cereals: Largest application segment due to high acreage and pest incidence.
- Fruits & Vegetables: Fastest-growing segment due to strong consumer demand for organic produce.
Bio Insecticides Market Product Landscape
The Bio Insecticides market offers a diverse range of products, including microbial-based insecticides (bacteria, fungi, viruses), botanical insecticides (derived from plants), and pheromone-based insecticides. These products are formulated for various application methods, such as spraying, dusting, and seed treatment. Recent technological advancements have focused on enhancing efficacy, improving shelf life, and developing more targeted formulations to minimize environmental impact. Key innovations include encapsulated biopesticides for improved efficacy and extended release formulations.
Key Drivers, Barriers & Challenges in Bio Insecticides Market
Key Drivers: Growing consumer preference for organic and sustainably produced food, increasing regulatory pressure to reduce chemical pesticide use, and rising awareness of the negative environmental impacts of synthetic pesticides.
Challenges & Restraints: High production costs compared to chemical insecticides, lower efficacy compared to certain chemical pesticides in some cases, and potential supply chain limitations for certain bio-based ingredients. Regulatory hurdles and lengthy approval processes can also hinder market expansion.
Emerging Opportunities in Bio Insecticides Market
Emerging opportunities include the development of novel bio-insecticides targeting specific pests, expansion into untapped markets (e.g., developing countries with high agricultural output), and the application of biopesticides in integrated pest management (IPM) strategies. The development of targeted formulations for specific crops and pests also represents a major growth opportunity.
Growth Accelerators in the Bio Insecticides Market Industry
Technological advancements, such as improved formulation techniques and enhanced efficacy, are key growth catalysts. Strategic partnerships between biopesticide manufacturers and agricultural companies are expanding market reach and accelerating adoption. Market expansion into developing economies, driven by rising agricultural production and increasing awareness of sustainable farming practices, will also contribute to significant growth.
Key Players Shaping the Bio Insecticides Market Market
Notable Milestones in Bio Insecticides Market Sector
- 2020: Launch of a novel biopesticide targeting a specific insect pest by Company X.
- 2022: Acquisition of Company Y by Company Z, expanding the market presence of Company Z.
- 2023: Approval of a new biopesticide formulation in key markets. (Further details needed for accurate reporting).
- 2024: Introduction of a new biopesticide delivery system improving efficacy. (Further details needed for accurate reporting).
In-Depth Bio Insecticides Market Market Outlook
The Bio Insecticides market is poised for significant growth in the coming years, driven by the factors outlined above. The continued development of innovative biopesticides, coupled with increasing regulatory pressure and consumer demand for sustainable agricultural practices, will contribute to substantial market expansion. Strategic partnerships, investments in R&D, and market penetration in developing economies will create lucrative opportunities for industry players. The market's long-term potential is considerable, offering substantial growth prospects for businesses engaged in the development, manufacturing, and distribution of bio-insecticides.
Bio Insecticides Market Segmentation
- 1. Production Analysis
- 2. Consumption Analysis
- 3. Import Market Analysis (Value & Volume)
- 4. Export Market Analysis (Value & Volume)
- 5. Price Trend Analysis
Bio Insecticides Market Segmentation By Geography
-
1. North America
- 1.1. United States
- 1.2. Canada
- 1.3. Mexico
-
2. South America
- 2.1. Brazil
- 2.2. Argentina
- 2.3. Rest of South America
-
3. Europe
- 3.1. United Kingdom
- 3.2. Germany
- 3.3. France
- 3.4. Italy
- 3.5. Spain
- 3.6. Russia
- 3.7. Benelux
- 3.8. Nordics
- 3.9. Rest of Europe
-
4. Middle East & Africa
- 4.1. Turkey
- 4.2. Israel
- 4.3. GCC
- 4.4. North Africa
- 4.5. South Africa
- 4.6. Rest of Middle East & Africa
-
5. Asia Pacific
- 5.1. China
- 5.2. India
- 5.3. Japan
- 5.4. South Korea
- 5.5. ASEAN
- 5.6. Oceania
- 5.7. Rest of Asia Pacific
Bio Insecticides Market Regional Market Share
Geographic Coverage of Bio Insecticides Market
Bio Insecticides Market REPORT HIGHLIGHTS
| Aspects | Details |
|---|---|
| Study Period | 2020-2034 |
| Base Year | 2025 |
| Estimated Year | 2026 |
| Forecast Period | 2026-2034 |
| Historical Period | 2020-2025 |
| Growth Rate | CAGR of 12.2% from 2020-2034 |
| Segmentation |
|
Table of Contents
- 1. Introduction
- 1.1. Research Scope
- 1.2. Market Segmentation
- 1.3. Research Objective
- 1.4. Definitions and Assumptions
- 2. Executive Summary
- 2.1. Market Snapshot
- 3. Market Dynamics
- 3.1. Market Drivers
- 3.2. Market Restrains
- 3.3. Market Trends
- 3.4. Market Opportunities
- 4. Market Factor Analysis
- 4.1. Porters Five Forces
- 4.1.1. Bargaining Power of Suppliers
- 4.1.2. Bargaining Power of Buyers
- 4.1.3. Threat of New Entrants
- 4.1.4. Threat of Substitutes
- 4.1.5. Competitive Rivalry
- 4.2. PESTEL analysis
- 4.3. BCG Analysis
- 4.3.1. Stars (High Growth, High Market Share)
- 4.3.2. Cash Cows (Low Growth, High Market Share)
- 4.3.3. Question Mark (High Growth, Low Market Share)
- 4.3.4. Dogs (Low Growth, Low Market Share)
- 4.4. Ansoff Matrix Analysis
- 4.5. Supply Chain Analysis
- 4.6. Regulatory Landscape
- 4.7. Current Market Potential and Opportunity Assessment (TAM–SAM–SOM Framework)
- 4.8. IMR Analyst Note
- 4.1. Porters Five Forces
- 5. Market Analysis, Insights and Forecast 2021-2033
- 5.1. Market Analysis, Insights and Forecast - by Production Analysis
- 5.2. Market Analysis, Insights and Forecast - by Consumption Analysis
- 5.3. Market Analysis, Insights and Forecast - by Import Market Analysis (Value & Volume)
- 5.4. Market Analysis, Insights and Forecast - by Export Market Analysis (Value & Volume)
- 5.5. Market Analysis, Insights and Forecast - by Price Trend Analysis
- 5.6. Market Analysis, Insights and Forecast - by Region
- 5.6.1. North America
- 5.6.2. South America
- 5.6.3. Europe
- 5.6.4. Middle East & Africa
- 5.6.5. Asia Pacific
- 6. Global Bio Insecticides Market Analysis, Insights and Forecast, 2021-2033
- 6.1. Market Analysis, Insights and Forecast - by Production Analysis
- 6.2. Market Analysis, Insights and Forecast - by Consumption Analysis
- 6.3. Market Analysis, Insights and Forecast - by Import Market Analysis (Value & Volume)
- 6.4. Market Analysis, Insights and Forecast - by Export Market Analysis (Value & Volume)
- 6.5. Market Analysis, Insights and Forecast - by Price Trend Analysis
- 7. North America Bio Insecticides Market Analysis, Insights and Forecast, 2020-2032
- 7.1. Market Analysis, Insights and Forecast - by Production Analysis
- 7.2. Market Analysis, Insights and Forecast - by Consumption Analysis
- 7.3. Market Analysis, Insights and Forecast - by Import Market Analysis (Value & Volume)
- 7.4. Market Analysis, Insights and Forecast - by Export Market Analysis (Value & Volume)
- 7.5. Market Analysis, Insights and Forecast - by Price Trend Analysis
- 8. South America Bio Insecticides Market Analysis, Insights and Forecast, 2020-2032
- 8.1. Market Analysis, Insights and Forecast - by Production Analysis
- 8.2. Market Analysis, Insights and Forecast - by Consumption Analysis
- 8.3. Market Analysis, Insights and Forecast - by Import Market Analysis (Value & Volume)
- 8.4. Market Analysis, Insights and Forecast - by Export Market Analysis (Value & Volume)
- 8.5. Market Analysis, Insights and Forecast - by Price Trend Analysis
- 9. Europe Bio Insecticides Market Analysis, Insights and Forecast, 2020-2032
- 9.1. Market Analysis, Insights and Forecast - by Production Analysis
- 9.2. Market Analysis, Insights and Forecast - by Consumption Analysis
- 9.3. Market Analysis, Insights and Forecast - by Import Market Analysis (Value & Volume)
- 9.4. Market Analysis, Insights and Forecast - by Export Market Analysis (Value & Volume)
- 9.5. Market Analysis, Insights and Forecast - by Price Trend Analysis
- 10. Middle East & Africa Bio Insecticides Market Analysis, Insights and Forecast, 2020-2032
- 10.1. Market Analysis, Insights and Forecast - by Production Analysis
- 10.2. Market Analysis, Insights and Forecast - by Consumption Analysis
- 10.3. Market Analysis, Insights and Forecast - by Import Market Analysis (Value & Volume)
- 10.4. Market Analysis, Insights and Forecast - by Export Market Analysis (Value & Volume)
- 10.5. Market Analysis, Insights and Forecast - by Price Trend Analysis
- 11. Asia Pacific Bio Insecticides Market Analysis, Insights and Forecast, 2020-2032
- 11.1. Market Analysis, Insights and Forecast - by Production Analysis
- 11.2. Market Analysis, Insights and Forecast - by Consumption Analysis
- 11.3. Market Analysis, Insights and Forecast - by Import Market Analysis (Value & Volume)
- 11.4. Market Analysis, Insights and Forecast - by Export Market Analysis (Value & Volume)
- 11.5. Market Analysis, Insights and Forecast - by Price Trend Analysis
- 12. Competitive Analysis
- 12.1. Company Profiles
- 12.1.1 Marrone Bio innovations
- 12.1.1.1. Company Overview
- 12.1.1.2. Products
- 12.1.1.3. Company Financials
- 12.1.1.4. SWOT Analysis
- 12.1.2 Bayer Cropscience AG
- 12.1.2.1. Company Overview
- 12.1.2.2. Products
- 12.1.2.3. Company Financials
- 12.1.2.4. SWOT Analysis
- 12.1.3 Certis LLC
- 12.1.3.1. Company Overview
- 12.1.3.2. Products
- 12.1.3.3. Company Financials
- 12.1.3.4. SWOT Analysis
- 12.1.4 Bioworks Inc
- 12.1.4.1. Company Overview
- 12.1.4.2. Products
- 12.1.4.3. Company Financials
- 12.1.4.4. SWOT Analysis
- 12.1.5 Valent Biosciences Corporation*List Not Exhaustive
- 12.1.5.1. Company Overview
- 12.1.5.2. Products
- 12.1.5.3. Company Financials
- 12.1.5.4. SWOT Analysis
- 12.1.6 Isagro Spa
- 12.1.6.1. Company Overview
- 12.1.6.2. Products
- 12.1.6.3. Company Financials
- 12.1.6.4. SWOT Analysis
- 12.1.7 Corteva Agriscience
- 12.1.7.1. Company Overview
- 12.1.7.2. Products
- 12.1.7.3. Company Financials
- 12.1.7.4. SWOT Analysis
- 12.1.8 Novozymes AS
- 12.1.8.1. Company Overview
- 12.1.8.2. Products
- 12.1.8.3. Company Financials
- 12.1.8.4. SWOT Analysis
- 12.1.9 Koppert Biological Systems
- 12.1.9.1. Company Overview
- 12.1.9.2. Products
- 12.1.9.3. Company Financials
- 12.1.9.4. SWOT Analysis
- 12.1.10 BASF SE
- 12.1.10.1. Company Overview
- 12.1.10.2. Products
- 12.1.10.3. Company Financials
- 12.1.10.4. SWOT Analysis
- 12.1.1 Marrone Bio innovations
- 12.2. Market Entropy
- 12.2.1 Company's Key Areas Served
- 12.2.2 Recent Developments
- 12.3. Company Market Share Analysis 2025
- 12.3.1 Top 5 Companies Market Share Analysis
- 12.3.2 Top 3 Companies Market Share Analysis
- 12.4. List of Potential Customers
- 13. Research Methodology
List of Figures
- Figure 1: Global Bio Insecticides Market Revenue Breakdown (million, %) by Region 2025 & 2033
- Figure 2: North America Bio Insecticides Market Revenue (million), by Production Analysis 2025 & 2033
- Figure 3: North America Bio Insecticides Market Revenue Share (%), by Production Analysis 2025 & 2033
- Figure 4: North America Bio Insecticides Market Revenue (million), by Consumption Analysis 2025 & 2033
- Figure 5: North America Bio Insecticides Market Revenue Share (%), by Consumption Analysis 2025 & 2033
- Figure 6: North America Bio Insecticides Market Revenue (million), by Import Market Analysis (Value & Volume) 2025 & 2033
- Figure 7: North America Bio Insecticides Market Revenue Share (%), by Import Market Analysis (Value & Volume) 2025 & 2033
- Figure 8: North America Bio Insecticides Market Revenue (million), by Export Market Analysis (Value & Volume) 2025 & 2033
- Figure 9: North America Bio Insecticides Market Revenue Share (%), by Export Market Analysis (Value & Volume) 2025 & 2033
- Figure 10: North America Bio Insecticides Market Revenue (million), by Price Trend Analysis 2025 & 2033
- Figure 11: North America Bio Insecticides Market Revenue Share (%), by Price Trend Analysis 2025 & 2033
- Figure 12: North America Bio Insecticides Market Revenue (million), by Country 2025 & 2033
- Figure 13: North America Bio Insecticides Market Revenue Share (%), by Country 2025 & 2033
- Figure 14: South America Bio Insecticides Market Revenue (million), by Production Analysis 2025 & 2033
- Figure 15: South America Bio Insecticides Market Revenue Share (%), by Production Analysis 2025 & 2033
- Figure 16: South America Bio Insecticides Market Revenue (million), by Consumption Analysis 2025 & 2033
- Figure 17: South America Bio Insecticides Market Revenue Share (%), by Consumption Analysis 2025 & 2033
- Figure 18: South America Bio Insecticides Market Revenue (million), by Import Market Analysis (Value & Volume) 2025 & 2033
- Figure 19: South America Bio Insecticides Market Revenue Share (%), by Import Market Analysis (Value & Volume) 2025 & 2033
- Figure 20: South America Bio Insecticides Market Revenue (million), by Export Market Analysis (Value & Volume) 2025 & 2033
- Figure 21: South America Bio Insecticides Market Revenue Share (%), by Export Market Analysis (Value & Volume) 2025 & 2033
- Figure 22: South America Bio Insecticides Market Revenue (million), by Price Trend Analysis 2025 & 2033
- Figure 23: South America Bio Insecticides Market Revenue Share (%), by Price Trend Analysis 2025 & 2033
- Figure 24: South America Bio Insecticides Market Revenue (million), by Country 2025 & 2033
- Figure 25: South America Bio Insecticides Market Revenue Share (%), by Country 2025 & 2033
- Figure 26: Europe Bio Insecticides Market Revenue (million), by Production Analysis 2025 & 2033
- Figure 27: Europe Bio Insecticides Market Revenue Share (%), by Production Analysis 2025 & 2033
- Figure 28: Europe Bio Insecticides Market Revenue (million), by Consumption Analysis 2025 & 2033
- Figure 29: Europe Bio Insecticides Market Revenue Share (%), by Consumption Analysis 2025 & 2033
- Figure 30: Europe Bio Insecticides Market Revenue (million), by Import Market Analysis (Value & Volume) 2025 & 2033
- Figure 31: Europe Bio Insecticides Market Revenue Share (%), by Import Market Analysis (Value & Volume) 2025 & 2033
- Figure 32: Europe Bio Insecticides Market Revenue (million), by Export Market Analysis (Value & Volume) 2025 & 2033
- Figure 33: Europe Bio Insecticides Market Revenue Share (%), by Export Market Analysis (Value & Volume) 2025 & 2033
- Figure 34: Europe Bio Insecticides Market Revenue (million), by Price Trend Analysis 2025 & 2033
- Figure 35: Europe Bio Insecticides Market Revenue Share (%), by Price Trend Analysis 2025 & 2033
- Figure 36: Europe Bio Insecticides Market Revenue (million), by Country 2025 & 2033
- Figure 37: Europe Bio Insecticides Market Revenue Share (%), by Country 2025 & 2033
- Figure 38: Middle East & Africa Bio Insecticides Market Revenue (million), by Production Analysis 2025 & 2033
- Figure 39: Middle East & Africa Bio Insecticides Market Revenue Share (%), by Production Analysis 2025 & 2033
- Figure 40: Middle East & Africa Bio Insecticides Market Revenue (million), by Consumption Analysis 2025 & 2033
- Figure 41: Middle East & Africa Bio Insecticides Market Revenue Share (%), by Consumption Analysis 2025 & 2033
- Figure 42: Middle East & Africa Bio Insecticides Market Revenue (million), by Import Market Analysis (Value & Volume) 2025 & 2033
- Figure 43: Middle East & Africa Bio Insecticides Market Revenue Share (%), by Import Market Analysis (Value & Volume) 2025 & 2033
- Figure 44: Middle East & Africa Bio Insecticides Market Revenue (million), by Export Market Analysis (Value & Volume) 2025 & 2033
- Figure 45: Middle East & Africa Bio Insecticides Market Revenue Share (%), by Export Market Analysis (Value & Volume) 2025 & 2033
- Figure 46: Middle East & Africa Bio Insecticides Market Revenue (million), by Price Trend Analysis 2025 & 2033
- Figure 47: Middle East & Africa Bio Insecticides Market Revenue Share (%), by Price Trend Analysis 2025 & 2033
- Figure 48: Middle East & Africa Bio Insecticides Market Revenue (million), by Country 2025 & 2033
- Figure 49: Middle East & Africa Bio Insecticides Market Revenue Share (%), by Country 2025 & 2033
- Figure 50: Asia Pacific Bio Insecticides Market Revenue (million), by Production Analysis 2025 & 2033
- Figure 51: Asia Pacific Bio Insecticides Market Revenue Share (%), by Production Analysis 2025 & 2033
- Figure 52: Asia Pacific Bio Insecticides Market Revenue (million), by Consumption Analysis 2025 & 2033
- Figure 53: Asia Pacific Bio Insecticides Market Revenue Share (%), by Consumption Analysis 2025 & 2033
- Figure 54: Asia Pacific Bio Insecticides Market Revenue (million), by Import Market Analysis (Value & Volume) 2025 & 2033
- Figure 55: Asia Pacific Bio Insecticides Market Revenue Share (%), by Import Market Analysis (Value & Volume) 2025 & 2033
- Figure 56: Asia Pacific Bio Insecticides Market Revenue (million), by Export Market Analysis (Value & Volume) 2025 & 2033
- Figure 57: Asia Pacific Bio Insecticides Market Revenue Share (%), by Export Market Analysis (Value & Volume) 2025 & 2033
- Figure 58: Asia Pacific Bio Insecticides Market Revenue (million), by Price Trend Analysis 2025 & 2033
- Figure 59: Asia Pacific Bio Insecticides Market Revenue Share (%), by Price Trend Analysis 2025 & 2033
- Figure 60: Asia Pacific Bio Insecticides Market Revenue (million), by Country 2025 & 2033
- Figure 61: Asia Pacific Bio Insecticides Market Revenue Share (%), by Country 2025 & 2033
List of Tables
- Table 1: Global Bio Insecticides Market Revenue million Forecast, by Production Analysis 2020 & 2033
- Table 2: Global Bio Insecticides Market Revenue million Forecast, by Consumption Analysis 2020 & 2033
- Table 3: Global Bio Insecticides Market Revenue million Forecast, by Import Market Analysis (Value & Volume) 2020 & 2033
- Table 4: Global Bio Insecticides Market Revenue million Forecast, by Export Market Analysis (Value & Volume) 2020 & 2033
- Table 5: Global Bio Insecticides Market Revenue million Forecast, by Price Trend Analysis 2020 & 2033
- Table 6: Global Bio Insecticides Market Revenue million Forecast, by Region 2020 & 2033
- Table 7: Global Bio Insecticides Market Revenue million Forecast, by Production Analysis 2020 & 2033
- Table 8: Global Bio Insecticides Market Revenue million Forecast, by Consumption Analysis 2020 & 2033
- Table 9: Global Bio Insecticides Market Revenue million Forecast, by Import Market Analysis (Value & Volume) 2020 & 2033
- Table 10: Global Bio Insecticides Market Revenue million Forecast, by Export Market Analysis (Value & Volume) 2020 & 2033
- Table 11: Global Bio Insecticides Market Revenue million Forecast, by Price Trend Analysis 2020 & 2033
- Table 12: Global Bio Insecticides Market Revenue million Forecast, by Country 2020 & 2033
- Table 13: United States Bio Insecticides Market Revenue (million) Forecast, by Application 2020 & 2033
- Table 14: Canada Bio Insecticides Market Revenue (million) Forecast, by Application 2020 & 2033
- Table 15: Mexico Bio Insecticides Market Revenue (million) Forecast, by Application 2020 & 2033
- Table 16: Global Bio Insecticides Market Revenue million Forecast, by Production Analysis 2020 & 2033
- Table 17: Global Bio Insecticides Market Revenue million Forecast, by Consumption Analysis 2020 & 2033
- Table 18: Global Bio Insecticides Market Revenue million Forecast, by Import Market Analysis (Value & Volume) 2020 & 2033
- Table 19: Global Bio Insecticides Market Revenue million Forecast, by Export Market Analysis (Value & Volume) 2020 & 2033
- Table 20: Global Bio Insecticides Market Revenue million Forecast, by Price Trend Analysis 2020 & 2033
- Table 21: Global Bio Insecticides Market Revenue million Forecast, by Country 2020 & 2033
- Table 22: Brazil Bio Insecticides Market Revenue (million) Forecast, by Application 2020 & 2033
- Table 23: Argentina Bio Insecticides Market Revenue (million) Forecast, by Application 2020 & 2033
- Table 24: Rest of South America Bio Insecticides Market Revenue (million) Forecast, by Application 2020 & 2033
- Table 25: Global Bio Insecticides Market Revenue million Forecast, by Production Analysis 2020 & 2033
- Table 26: Global Bio Insecticides Market Revenue million Forecast, by Consumption Analysis 2020 & 2033
- Table 27: Global Bio Insecticides Market Revenue million Forecast, by Import Market Analysis (Value & Volume) 2020 & 2033
- Table 28: Global Bio Insecticides Market Revenue million Forecast, by Export Market Analysis (Value & Volume) 2020 & 2033
- Table 29: Global Bio Insecticides Market Revenue million Forecast, by Price Trend Analysis 2020 & 2033
- Table 30: Global Bio Insecticides Market Revenue million Forecast, by Country 2020 & 2033
- Table 31: United Kingdom Bio Insecticides Market Revenue (million) Forecast, by Application 2020 & 2033
- Table 32: Germany Bio Insecticides Market Revenue (million) Forecast, by Application 2020 & 2033
- Table 33: France Bio Insecticides Market Revenue (million) Forecast, by Application 2020 & 2033
- Table 34: Italy Bio Insecticides Market Revenue (million) Forecast, by Application 2020 & 2033
- Table 35: Spain Bio Insecticides Market Revenue (million) Forecast, by Application 2020 & 2033
- Table 36: Russia Bio Insecticides Market Revenue (million) Forecast, by Application 2020 & 2033
- Table 37: Benelux Bio Insecticides Market Revenue (million) Forecast, by Application 2020 & 2033
- Table 38: Nordics Bio Insecticides Market Revenue (million) Forecast, by Application 2020 & 2033
- Table 39: Rest of Europe Bio Insecticides Market Revenue (million) Forecast, by Application 2020 & 2033
- Table 40: Global Bio Insecticides Market Revenue million Forecast, by Production Analysis 2020 & 2033
- Table 41: Global Bio Insecticides Market Revenue million Forecast, by Consumption Analysis 2020 & 2033
- Table 42: Global Bio Insecticides Market Revenue million Forecast, by Import Market Analysis (Value & Volume) 2020 & 2033
- Table 43: Global Bio Insecticides Market Revenue million Forecast, by Export Market Analysis (Value & Volume) 2020 & 2033
- Table 44: Global Bio Insecticides Market Revenue million Forecast, by Price Trend Analysis 2020 & 2033
- Table 45: Global Bio Insecticides Market Revenue million Forecast, by Country 2020 & 2033
- Table 46: Turkey Bio Insecticides Market Revenue (million) Forecast, by Application 2020 & 2033
- Table 47: Israel Bio Insecticides Market Revenue (million) Forecast, by Application 2020 & 2033
- Table 48: GCC Bio Insecticides Market Revenue (million) Forecast, by Application 2020 & 2033
- Table 49: North Africa Bio Insecticides Market Revenue (million) Forecast, by Application 2020 & 2033
- Table 50: South Africa Bio Insecticides Market Revenue (million) Forecast, by Application 2020 & 2033
- Table 51: Rest of Middle East & Africa Bio Insecticides Market Revenue (million) Forecast, by Application 2020 & 2033
- Table 52: Global Bio Insecticides Market Revenue million Forecast, by Production Analysis 2020 & 2033
- Table 53: Global Bio Insecticides Market Revenue million Forecast, by Consumption Analysis 2020 & 2033
- Table 54: Global Bio Insecticides Market Revenue million Forecast, by Import Market Analysis (Value & Volume) 2020 & 2033
- Table 55: Global Bio Insecticides Market Revenue million Forecast, by Export Market Analysis (Value & Volume) 2020 & 2033
- Table 56: Global Bio Insecticides Market Revenue million Forecast, by Price Trend Analysis 2020 & 2033
- Table 57: Global Bio Insecticides Market Revenue million Forecast, by Country 2020 & 2033
- Table 58: China Bio Insecticides Market Revenue (million) Forecast, by Application 2020 & 2033
- Table 59: India Bio Insecticides Market Revenue (million) Forecast, by Application 2020 & 2033
- Table 60: Japan Bio Insecticides Market Revenue (million) Forecast, by Application 2020 & 2033
- Table 61: South Korea Bio Insecticides Market Revenue (million) Forecast, by Application 2020 & 2033
- Table 62: ASEAN Bio Insecticides Market Revenue (million) Forecast, by Application 2020 & 2033
- Table 63: Oceania Bio Insecticides Market Revenue (million) Forecast, by Application 2020 & 2033
- Table 64: Rest of Asia Pacific Bio Insecticides Market Revenue (million) Forecast, by Application 2020 & 2033
Frequently Asked Questions
1. What is the projected Compound Annual Growth Rate (CAGR) of the Bio Insecticides Market?
The projected CAGR is approximately 12.2%.
2. Which companies are prominent players in the Bio Insecticides Market?
Key companies in the market include Marrone Bio innovations, Bayer Cropscience AG, Certis LLC, Bioworks Inc, Valent Biosciences Corporation*List Not Exhaustive, Isagro Spa, Corteva Agriscience, Novozymes AS, Koppert Biological Systems, BASF SE.
3. What are the main segments of the Bio Insecticides Market?
The market segments include Production Analysis, Consumption Analysis, Import Market Analysis (Value & Volume), Export Market Analysis (Value & Volume), Price Trend Analysis.
4. Can you provide details about the market size?
The market size is estimated to be USD 5007.6 million as of 2022.
5. What are some drivers contributing to market growth?
Demand For Landscaping Maintenance; Adoption of Green Spaces and Green Roofs.
6. What are the notable trends driving market growth?
Fruits and Vegetables Occupy the Largest Share By Application.
7. Are there any restraints impacting market growth?
Shortage of Labor In Landscaping; High Maintenance Cost of Lawn Mowers.
8. Can you provide examples of recent developments in the market?
N/A
9. What pricing options are available for accessing the report?
Pricing options include single-user, multi-user, and enterprise licenses priced at USD 4750, USD 5250, and USD 8750 respectively.
10. Is the market size provided in terms of value or volume?
The market size is provided in terms of value, measured in million.
11. Are there any specific market keywords associated with the report?
Yes, the market keyword associated with the report is "Bio Insecticides Market," which aids in identifying and referencing the specific market segment covered.
12. How do I determine which pricing option suits my needs best?
The pricing options vary based on user requirements and access needs. Individual users may opt for single-user licenses, while businesses requiring broader access may choose multi-user or enterprise licenses for cost-effective access to the report.
13. Are there any additional resources or data provided in the Bio Insecticides Market report?
While the report offers comprehensive insights, it's advisable to review the specific contents or supplementary materials provided to ascertain if additional resources or data are available.
14. How can I stay updated on further developments or reports in the Bio Insecticides Market?
To stay informed about further developments, trends, and reports in the Bio Insecticides Market, consider subscribing to industry newsletters, following relevant companies and organizations, or regularly checking reputable industry news sources and publications.
Methodology
Step 1 - Identification of Relevant Samples Size from Population Database


Step 2 - Approaches for Defining Global Market Size (Value, Volume* & Price*)

Note*: In applicable scenarios
Step 3 - Data Sources
Primary Research
- Web Analytics
- Survey Reports
- Research Institute
- Latest Research Reports
- Opinion Leaders
Secondary Research
- Annual Reports
- White Paper
- Latest Press Release
- Industry Association
- Paid Database
- Investor Presentations

Step 4 - Data Triangulation
Involves using different sources of information in order to increase the validity of a study
These sources are likely to be stakeholders in a program - participants, other researchers, program staff, other community members, and so on.
Then we put all data in single framework & apply various statistical tools to find out the dynamic on the market.
During the analysis stage, feedback from the stakeholder groups would be compared to determine areas of agreement as well as areas of divergence