

Key Insights
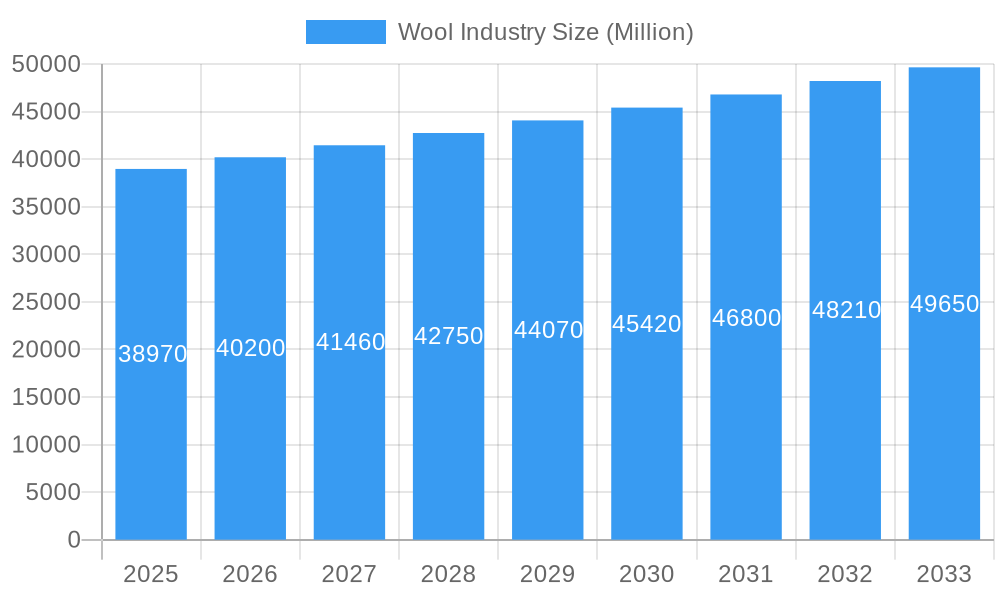
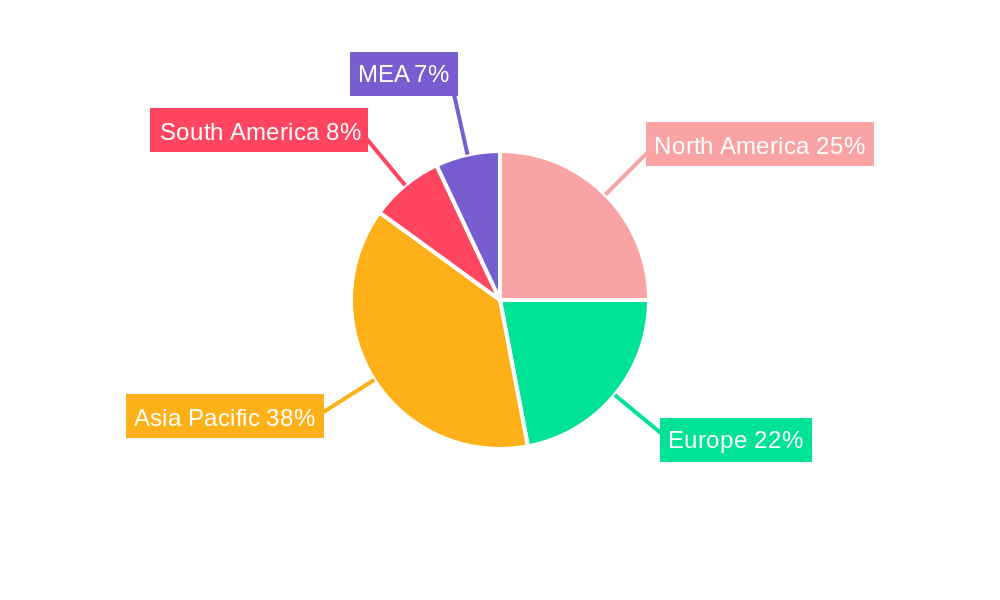
The global wool industry, currently valued at $38.97 billion in 2025, is projected to experience steady growth, exhibiting a Compound Annual Growth Rate (CAGR) of 3.20% from 2025 to 2033. This growth is fueled by several key drivers. Increasing consumer demand for sustainable and natural fibers is a significant factor, with wool's inherent properties like breathability, warmth, and moisture-wicking making it appealing to environmentally conscious consumers. The rise of fast fashion's negative environmental impact is pushing many brands to seek more eco-friendly alternatives, thereby boosting wool's market share. Furthermore, advancements in wool processing technologies are leading to the development of innovative wool products with enhanced performance characteristics, expanding the industry's application across diverse sectors such as apparel, home furnishings, and even industrial applications. Growth is particularly strong in the knitwear yarn and woven fabrics segments, driven by trends in sustainable fashion and the demand for high-quality textiles. However, the industry faces challenges, including fluctuating wool prices influenced by factors like sheep production and global economic conditions. Competition from synthetic fibers and the high cost of wool production also pose restraints. Nevertheless, strategic initiatives by organizations like The Woolmark Company and Australian Wool Innovation in promoting wool's unique qualities and expanding its market reach are expected to mitigate these challenges and contribute to sustained growth throughout the forecast period. Regional analysis reveals strong performance in North America and Europe, with Asia-Pacific also showing significant growth potential driven by expanding middle classes and increasing consumer spending in key markets like China and India.
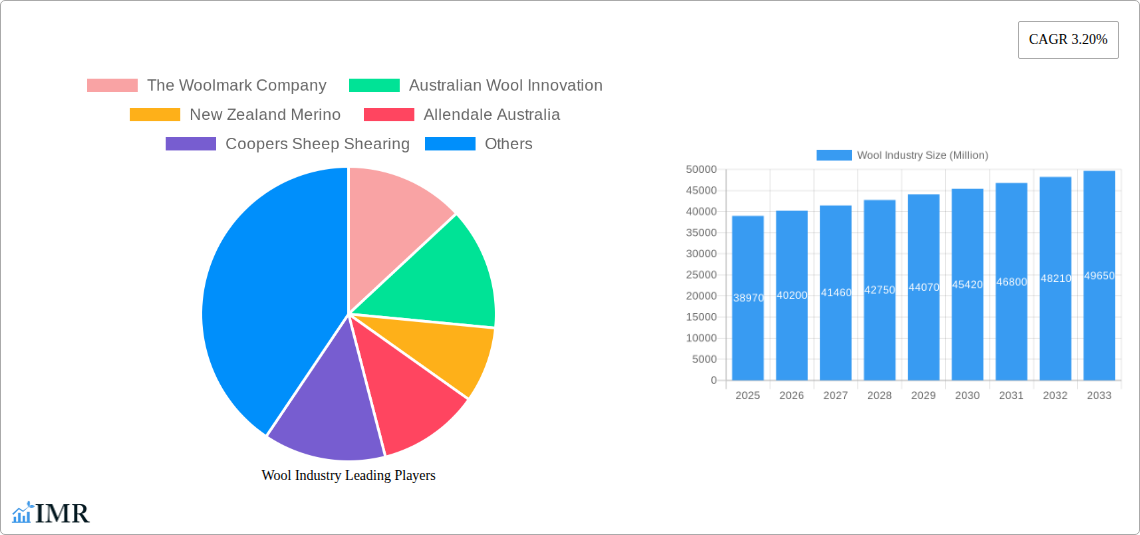
Wool Industry Market Size (In Billion)
The segmentation of the wool industry reveals considerable opportunities. The knitwear yarn segment benefits from the enduring popularity of knitted garments, while the woven fabrics segment sees increased demand for high-quality wool suits and outerwear. The end-use industry segmentation highlights the diversity of wool applications, encompassing not only the textile and apparel sector but also the growing home furnishings market (rugs, blankets) and niche industrial applications (felt, insulation). Major players in the wool industry, such as The Woolmark Company, Australian Wool Innovation, and New Zealand Merino, play a crucial role in driving innovation, promoting sustainable practices, and shaping the future of the market. Their efforts in brand building, research & development, and supply chain management are key factors influencing the industry's overall trajectory. The geographic diversity of the market, spanning across North America, Europe, Asia-Pacific, South America, and the Middle East & Africa, presents both opportunities and challenges related to regional regulations, consumer preferences, and economic conditions. The forecast period of 2025-2033 promises sustained growth for the wool industry, contingent upon ongoing innovation, sustainable practices, and effective market penetration strategies.
Wool Industry Company Market Share
Wool Industry Market Report: 2019-2033
This comprehensive report provides an in-depth analysis of the global wool industry, encompassing market dynamics, growth trends, regional performance, and key players. The study period spans 2019-2033, with 2025 serving as the base and estimated year. The report leverages extensive data and expert analysis to provide valuable insights for industry professionals, investors, and stakeholders. This report covers the parent market of Textile Fibers and the child market of Wool Fibers.
Keywords: Wool Industry, Wool Market, Knitwear Yarn, Woven Fabrics, Textile and Apparel, Home Furnishings, Industrial Wool, Woolmark Company, Australian Wool Innovation, New Zealand Merino, Allendale Australia, Coopers Sheep Shearing, Market Size, Market Share, CAGR, Growth Trends, Market Analysis, Industry Report, Market Forecast.
Wool Industry Market Dynamics & Structure
The global wool industry is characterized by moderate concentration, with a few dominant players alongside numerous smaller producers. Technological innovation, particularly in fiber processing and fabric development, is a key driver, but faces barriers including high initial investment costs and the need for specialized expertise. Regulatory frameworks concerning animal welfare and sustainable practices significantly impact market operations. Competitive substitutes like synthetic fibers pose a constant challenge. End-user demographics, including shifts in fashion trends and consumer preferences for sustainable products, influence demand. The historical period (2019-2024) witnessed a moderate level of M&A activity, with approximately xx deals valued at xx million USD. The forecast period (2025-2033) anticipates a similar level of consolidation.
- Market Concentration: Moderately concentrated, with top 5 players holding approximately xx% market share in 2025.
- Technological Innovation: Focus on sustainable processing, improved fiber properties, and innovative fabric designs.
- Regulatory Landscape: Stringent regulations concerning animal welfare and environmental impact.
- Competitive Substitutes: Synthetic fibers (polyester, acrylic) pose a significant threat.
- End-User Demographics: Growing demand from millennials and Gen Z for sustainable and ethically sourced products.
- M&A Activity: Approximately xx M&A deals in the historical period (2019-2024), with xx million USD in total value.
Wool Industry Growth Trends & Insights
The global wool market experienced a CAGR of xx% during the historical period (2019-2024), reaching a market size of xx million units in 2024. This growth is attributed to factors such as increasing consumer awareness of wool's natural properties (moisture-wicking, breathability, temperature regulation), rising demand for sustainable and ethically produced textiles, and technological advancements in fiber processing that enhance performance. However, the market faces challenges from competitive substitutes and fluctuating raw material prices. The forecast period (2025-2033) projects a CAGR of xx%, reaching a market size of xx million units by 2033. This growth will be driven by increased adoption of innovative wool products across various end-use industries, along with a growing preference for natural fibers among consumers. Market penetration in key segments, such as high-performance sportswear, is expected to increase significantly.
Dominant Regions, Countries, or Segments in Wool Industry
Australia and New Zealand remain dominant regions, accounting for xx% of global wool production in 2025. Their dominance stems from favorable climatic conditions, established infrastructure, and robust industry support systems. Within product types, knitwear yarn demonstrates the highest growth potential, driven by its use in high-value fashion and apparel. The textile and apparel end-use industry continues to be the largest consumer of wool, though the home furnishings segment shows promising growth due to the increasing demand for sustainable and luxurious interiors.
- Key Drivers for Australia/New Zealand: Favorable climate, established infrastructure, government support for the wool industry.
- Knitwear Yarn Growth Drivers: High demand in fashion and apparel sectors; increasing use of innovative technologies.
- Textile & Apparel Market Dominance: Traditional strength; focus on sustainable and high-performance products.
- Home Furnishings Growth Potential: Rising demand for luxurious and eco-friendly interior design.
Wool Industry Product Landscape
Wool product innovation focuses on enhancing performance characteristics through advanced treatments and blends. This includes developing fabrics with improved water resistance, wrinkle resistance, and stain resistance. High-performance wool blends with synthetic fibers are gaining traction in sportswear and outdoor apparel. These advancements cater to the growing demand for functional and stylish wool products. Unique selling propositions hinge on wool's inherent natural properties, along with the sustainable and ethical sourcing aspects becoming increasingly important to consumers. Technological advancements include the use of nanotechnology to improve fiber properties and digital printing for customized designs.
Key Drivers, Barriers & Challenges in Wool Industry
Key Drivers:
- Growing demand for sustainable and natural fibers.
- Increasing awareness of wool's unique properties.
- Technological advancements improving wool performance.
- Investments in innovative wool products.
Challenges and Restraints:
- Competition from synthetic fibers with lower costs.
- Fluctuations in raw material prices (wool fleece).
- Supply chain disruptions affecting wool production.
- Regulatory changes and environmental concerns.
Emerging Opportunities in Wool Industry
- Expansion into niche markets (e.g., technical textiles, medical applications).
- Development of innovative wool-based composites.
- Increased utilization of recycled wool.
- Growing focus on traceability and transparency in the supply chain.
- Targeting the eco-conscious consumer segment.
Growth Accelerators in the Wool Industry
Long-term growth will be driven by strategic partnerships between wool producers and textile manufacturers, focusing on innovation and sustainability. Technological advancements in processing and finishing will enhance wool's performance characteristics. Expanding into new applications in technical textiles and medical sectors will broaden market reach. Government initiatives promoting sustainable practices and wool production will further stimulate growth.
Key Players Shaping the Wool Industry Market
- The Woolmark Company
- Australian Wool Innovation
- New Zealand Merino
- Allendale Australia
- Coopers Sheep Shearing
Notable Milestones in Wool Industry Sector
- 2020: Launch of a new sustainable wool processing technology by The Woolmark Company.
- 2022: Australian Wool Innovation initiates a major marketing campaign focusing on the sustainability of wool.
- 2023: New Zealand Merino partners with a major sportswear brand to launch a high-performance wool apparel line.
In-Depth Wool Industry Market Outlook
The wool industry presents significant opportunities for growth in the coming years. Continued innovation in product development, coupled with a growing consumer preference for sustainable materials, will drive market expansion. Strategic partnerships and investments in advanced technologies will be crucial for capitalizing on future market potential. The focus on transparency, traceability, and sustainability will be critical for maintaining consumer confidence and driving market growth. The long-term outlook is positive, projecting sustained growth and increased market value.
Wool Industry Segmentation
- 1. Production Analysis
- 2. Consumption Analysis
- 3. Import Market Analysis (Value & Volume)
- 4. Export Market Analysis (Value & Volume)
- 5. Price Trend Analysis
Wool Industry Segmentation By Geography
-
1. North America
- 1.1. United States
- 1.2. Mexico
-
2. Europe
- 2.1. Germany
- 2.2. Belgium
- 2.3. United Kingdom
- 2.4. Italy
- 2.5. Netherlands
- 2.6. Turkey
-
3. Asia Pacific
- 3.1. China
- 3.2. India
- 3.3. Japan
- 3.4. Australia
- 3.5. New Zealand
-
4. South America
- 4.1. Brazil
- 4.2. Argentina
-
5. Middle East and Africa
- 5.1. UAE
- 5.2. Saudi Arabia
- 5.3. Oman
- 5.4. Morocco
Wool Industry Regional Market Share
Geographic Coverage of Wool Industry
Wool Industry REPORT HIGHLIGHTS
| Aspects | Details |
|---|---|
| Study Period | 2020-2034 |
| Base Year | 2025 |
| Estimated Year | 2026 |
| Forecast Period | 2026-2034 |
| Historical Period | 2020-2025 |
| Growth Rate | CAGR of 3.20% from 2020-2034 |
| Segmentation |
|
Table of Contents
- 1. Introduction
- 1.1. Research Scope
- 1.2. Market Segmentation
- 1.3. Research Objective
- 1.4. Definitions and Assumptions
- 2. Executive Summary
- 2.1. Market Snapshot
- 3. Market Dynamics
- 3.1. Market Drivers
- 3.2. Market Restrains
- 3.3. Market Trends
- 3.4. Market Opportunities
- 4. Market Factor Analysis
- 4.1. Porters Five Forces
- 4.1.1. Bargaining Power of Suppliers
- 4.1.2. Bargaining Power of Buyers
- 4.1.3. Threat of New Entrants
- 4.1.4. Threat of Substitutes
- 4.1.5. Competitive Rivalry
- 4.2. PESTEL analysis
- 4.3. BCG Analysis
- 4.3.1. Stars (High Growth, High Market Share)
- 4.3.2. Cash Cows (Low Growth, High Market Share)
- 4.3.3. Question Mark (High Growth, Low Market Share)
- 4.3.4. Dogs (Low Growth, Low Market Share)
- 4.4. Ansoff Matrix Analysis
- 4.5. Supply Chain Analysis
- 4.6. Regulatory Landscape
- 4.7. Current Market Potential and Opportunity Assessment (TAM–SAM–SOM Framework)
- 4.8. IMR Analyst Note
- 4.1. Porters Five Forces
- 5. Market Analysis, Insights and Forecast 2021-2033
- 5.1. Market Analysis, Insights and Forecast - by Production Analysis
- 5.2. Market Analysis, Insights and Forecast - by Consumption Analysis
- 5.3. Market Analysis, Insights and Forecast - by Import Market Analysis (Value & Volume)
- 5.4. Market Analysis, Insights and Forecast - by Export Market Analysis (Value & Volume)
- 5.5. Market Analysis, Insights and Forecast - by Price Trend Analysis
- 5.6. Market Analysis, Insights and Forecast - by Region
- 5.6.1. North America
- 5.6.2. Europe
- 5.6.3. Asia Pacific
- 5.6.4. South America
- 5.6.5. Middle East and Africa
- 6. Global Wool Industry Analysis, Insights and Forecast, 2021-2033
- 6.1. Market Analysis, Insights and Forecast - by Production Analysis
- 6.2. Market Analysis, Insights and Forecast - by Consumption Analysis
- 6.3. Market Analysis, Insights and Forecast - by Import Market Analysis (Value & Volume)
- 6.4. Market Analysis, Insights and Forecast - by Export Market Analysis (Value & Volume)
- 6.5. Market Analysis, Insights and Forecast - by Price Trend Analysis
- 7. North America Wool Industry Analysis, Insights and Forecast, 2020-2032
- 7.1. Market Analysis, Insights and Forecast - by Production Analysis
- 7.2. Market Analysis, Insights and Forecast - by Consumption Analysis
- 7.3. Market Analysis, Insights and Forecast - by Import Market Analysis (Value & Volume)
- 7.4. Market Analysis, Insights and Forecast - by Export Market Analysis (Value & Volume)
- 7.5. Market Analysis, Insights and Forecast - by Price Trend Analysis
- 8. Europe Wool Industry Analysis, Insights and Forecast, 2020-2032
- 8.1. Market Analysis, Insights and Forecast - by Production Analysis
- 8.2. Market Analysis, Insights and Forecast - by Consumption Analysis
- 8.3. Market Analysis, Insights and Forecast - by Import Market Analysis (Value & Volume)
- 8.4. Market Analysis, Insights and Forecast - by Export Market Analysis (Value & Volume)
- 8.5. Market Analysis, Insights and Forecast - by Price Trend Analysis
- 9. Asia Pacific Wool Industry Analysis, Insights and Forecast, 2020-2032
- 9.1. Market Analysis, Insights and Forecast - by Production Analysis
- 9.2. Market Analysis, Insights and Forecast - by Consumption Analysis
- 9.3. Market Analysis, Insights and Forecast - by Import Market Analysis (Value & Volume)
- 9.4. Market Analysis, Insights and Forecast - by Export Market Analysis (Value & Volume)
- 9.5. Market Analysis, Insights and Forecast - by Price Trend Analysis
- 10. South America Wool Industry Analysis, Insights and Forecast, 2020-2032
- 10.1. Market Analysis, Insights and Forecast - by Production Analysis
- 10.2. Market Analysis, Insights and Forecast - by Consumption Analysis
- 10.3. Market Analysis, Insights and Forecast - by Import Market Analysis (Value & Volume)
- 10.4. Market Analysis, Insights and Forecast - by Export Market Analysis (Value & Volume)
- 10.5. Market Analysis, Insights and Forecast - by Price Trend Analysis
- 11. Middle East and Africa Wool Industry Analysis, Insights and Forecast, 2020-2032
- 11.1. Market Analysis, Insights and Forecast - by Production Analysis
- 11.2. Market Analysis, Insights and Forecast - by Consumption Analysis
- 11.3. Market Analysis, Insights and Forecast - by Import Market Analysis (Value & Volume)
- 11.4. Market Analysis, Insights and Forecast - by Export Market Analysis (Value & Volume)
- 11.5. Market Analysis, Insights and Forecast - by Price Trend Analysis
- 12. Competitive Analysis
- 12.1. Company Profiles
- 12.1.1 The Woolmark Company
- 12.1.1.1. Company Overview
- 12.1.1.2. Products
- 12.1.1.3. Company Financials
- 12.1.1.4. SWOT Analysis
- 12.1.2 Australian Wool Innovation
- 12.1.2.1. Company Overview
- 12.1.2.2. Products
- 12.1.2.3. Company Financials
- 12.1.2.4. SWOT Analysis
- 12.1.3 New Zealand Merino
- 12.1.3.1. Company Overview
- 12.1.3.2. Products
- 12.1.3.3. Company Financials
- 12.1.3.4. SWOT Analysis
- 12.1.4 Allendale Australia
- 12.1.4.1. Company Overview
- 12.1.4.2. Products
- 12.1.4.3. Company Financials
- 12.1.4.4. SWOT Analysis
- 12.1.5 Coopers Sheep Shearing
- 12.1.5.1. Company Overview
- 12.1.5.2. Products
- 12.1.5.3. Company Financials
- 12.1.5.4. SWOT Analysis
- 12.1.1 The Woolmark Company
- 12.2. Market Entropy
- 12.2.1 Company's Key Areas Served
- 12.2.2 Recent Developments
- 12.3. Company Market Share Analysis 2025
- 12.3.1 Top 5 Companies Market Share Analysis
- 12.3.2 Top 3 Companies Market Share Analysis
- 12.4. List of Potential Customers
- 13. Research Methodology
List of Figures
- Figure 1: Global Wool Industry Revenue Breakdown (Million, %) by Region 2025 & 2033
- Figure 2: North America Wool Industry Revenue (Million), by Production Analysis 2025 & 2033
- Figure 3: North America Wool Industry Revenue Share (%), by Production Analysis 2025 & 2033
- Figure 4: North America Wool Industry Revenue (Million), by Consumption Analysis 2025 & 2033
- Figure 5: North America Wool Industry Revenue Share (%), by Consumption Analysis 2025 & 2033
- Figure 6: North America Wool Industry Revenue (Million), by Import Market Analysis (Value & Volume) 2025 & 2033
- Figure 7: North America Wool Industry Revenue Share (%), by Import Market Analysis (Value & Volume) 2025 & 2033
- Figure 8: North America Wool Industry Revenue (Million), by Export Market Analysis (Value & Volume) 2025 & 2033
- Figure 9: North America Wool Industry Revenue Share (%), by Export Market Analysis (Value & Volume) 2025 & 2033
- Figure 10: North America Wool Industry Revenue (Million), by Price Trend Analysis 2025 & 2033
- Figure 11: North America Wool Industry Revenue Share (%), by Price Trend Analysis 2025 & 2033
- Figure 12: North America Wool Industry Revenue (Million), by Country 2025 & 2033
- Figure 13: North America Wool Industry Revenue Share (%), by Country 2025 & 2033
- Figure 14: Europe Wool Industry Revenue (Million), by Production Analysis 2025 & 2033
- Figure 15: Europe Wool Industry Revenue Share (%), by Production Analysis 2025 & 2033
- Figure 16: Europe Wool Industry Revenue (Million), by Consumption Analysis 2025 & 2033
- Figure 17: Europe Wool Industry Revenue Share (%), by Consumption Analysis 2025 & 2033
- Figure 18: Europe Wool Industry Revenue (Million), by Import Market Analysis (Value & Volume) 2025 & 2033
- Figure 19: Europe Wool Industry Revenue Share (%), by Import Market Analysis (Value & Volume) 2025 & 2033
- Figure 20: Europe Wool Industry Revenue (Million), by Export Market Analysis (Value & Volume) 2025 & 2033
- Figure 21: Europe Wool Industry Revenue Share (%), by Export Market Analysis (Value & Volume) 2025 & 2033
- Figure 22: Europe Wool Industry Revenue (Million), by Price Trend Analysis 2025 & 2033
- Figure 23: Europe Wool Industry Revenue Share (%), by Price Trend Analysis 2025 & 2033
- Figure 24: Europe Wool Industry Revenue (Million), by Country 2025 & 2033
- Figure 25: Europe Wool Industry Revenue Share (%), by Country 2025 & 2033
- Figure 26: Asia Pacific Wool Industry Revenue (Million), by Production Analysis 2025 & 2033
- Figure 27: Asia Pacific Wool Industry Revenue Share (%), by Production Analysis 2025 & 2033
- Figure 28: Asia Pacific Wool Industry Revenue (Million), by Consumption Analysis 2025 & 2033
- Figure 29: Asia Pacific Wool Industry Revenue Share (%), by Consumption Analysis 2025 & 2033
- Figure 30: Asia Pacific Wool Industry Revenue (Million), by Import Market Analysis (Value & Volume) 2025 & 2033
- Figure 31: Asia Pacific Wool Industry Revenue Share (%), by Import Market Analysis (Value & Volume) 2025 & 2033
- Figure 32: Asia Pacific Wool Industry Revenue (Million), by Export Market Analysis (Value & Volume) 2025 & 2033
- Figure 33: Asia Pacific Wool Industry Revenue Share (%), by Export Market Analysis (Value & Volume) 2025 & 2033
- Figure 34: Asia Pacific Wool Industry Revenue (Million), by Price Trend Analysis 2025 & 2033
- Figure 35: Asia Pacific Wool Industry Revenue Share (%), by Price Trend Analysis 2025 & 2033
- Figure 36: Asia Pacific Wool Industry Revenue (Million), by Country 2025 & 2033
- Figure 37: Asia Pacific Wool Industry Revenue Share (%), by Country 2025 & 2033
- Figure 38: South America Wool Industry Revenue (Million), by Production Analysis 2025 & 2033
- Figure 39: South America Wool Industry Revenue Share (%), by Production Analysis 2025 & 2033
- Figure 40: South America Wool Industry Revenue (Million), by Consumption Analysis 2025 & 2033
- Figure 41: South America Wool Industry Revenue Share (%), by Consumption Analysis 2025 & 2033
- Figure 42: South America Wool Industry Revenue (Million), by Import Market Analysis (Value & Volume) 2025 & 2033
- Figure 43: South America Wool Industry Revenue Share (%), by Import Market Analysis (Value & Volume) 2025 & 2033
- Figure 44: South America Wool Industry Revenue (Million), by Export Market Analysis (Value & Volume) 2025 & 2033
- Figure 45: South America Wool Industry Revenue Share (%), by Export Market Analysis (Value & Volume) 2025 & 2033
- Figure 46: South America Wool Industry Revenue (Million), by Price Trend Analysis 2025 & 2033
- Figure 47: South America Wool Industry Revenue Share (%), by Price Trend Analysis 2025 & 2033
- Figure 48: South America Wool Industry Revenue (Million), by Country 2025 & 2033
- Figure 49: South America Wool Industry Revenue Share (%), by Country 2025 & 2033
- Figure 50: Middle East and Africa Wool Industry Revenue (Million), by Production Analysis 2025 & 2033
- Figure 51: Middle East and Africa Wool Industry Revenue Share (%), by Production Analysis 2025 & 2033
- Figure 52: Middle East and Africa Wool Industry Revenue (Million), by Consumption Analysis 2025 & 2033
- Figure 53: Middle East and Africa Wool Industry Revenue Share (%), by Consumption Analysis 2025 & 2033
- Figure 54: Middle East and Africa Wool Industry Revenue (Million), by Import Market Analysis (Value & Volume) 2025 & 2033
- Figure 55: Middle East and Africa Wool Industry Revenue Share (%), by Import Market Analysis (Value & Volume) 2025 & 2033
- Figure 56: Middle East and Africa Wool Industry Revenue (Million), by Export Market Analysis (Value & Volume) 2025 & 2033
- Figure 57: Middle East and Africa Wool Industry Revenue Share (%), by Export Market Analysis (Value & Volume) 2025 & 2033
- Figure 58: Middle East and Africa Wool Industry Revenue (Million), by Price Trend Analysis 2025 & 2033
- Figure 59: Middle East and Africa Wool Industry Revenue Share (%), by Price Trend Analysis 2025 & 2033
- Figure 60: Middle East and Africa Wool Industry Revenue (Million), by Country 2025 & 2033
- Figure 61: Middle East and Africa Wool Industry Revenue Share (%), by Country 2025 & 2033
List of Tables
- Table 1: Global Wool Industry Revenue Million Forecast, by Production Analysis 2020 & 2033
- Table 2: Global Wool Industry Revenue Million Forecast, by Consumption Analysis 2020 & 2033
- Table 3: Global Wool Industry Revenue Million Forecast, by Import Market Analysis (Value & Volume) 2020 & 2033
- Table 4: Global Wool Industry Revenue Million Forecast, by Export Market Analysis (Value & Volume) 2020 & 2033
- Table 5: Global Wool Industry Revenue Million Forecast, by Price Trend Analysis 2020 & 2033
- Table 6: Global Wool Industry Revenue Million Forecast, by Region 2020 & 2033
- Table 7: Global Wool Industry Revenue Million Forecast, by Production Analysis 2020 & 2033
- Table 8: Global Wool Industry Revenue Million Forecast, by Consumption Analysis 2020 & 2033
- Table 9: Global Wool Industry Revenue Million Forecast, by Import Market Analysis (Value & Volume) 2020 & 2033
- Table 10: Global Wool Industry Revenue Million Forecast, by Export Market Analysis (Value & Volume) 2020 & 2033
- Table 11: Global Wool Industry Revenue Million Forecast, by Price Trend Analysis 2020 & 2033
- Table 12: Global Wool Industry Revenue Million Forecast, by Country 2020 & 2033
- Table 13: United States Wool Industry Revenue (Million) Forecast, by Application 2020 & 2033
- Table 14: Mexico Wool Industry Revenue (Million) Forecast, by Application 2020 & 2033
- Table 15: Global Wool Industry Revenue Million Forecast, by Production Analysis 2020 & 2033
- Table 16: Global Wool Industry Revenue Million Forecast, by Consumption Analysis 2020 & 2033
- Table 17: Global Wool Industry Revenue Million Forecast, by Import Market Analysis (Value & Volume) 2020 & 2033
- Table 18: Global Wool Industry Revenue Million Forecast, by Export Market Analysis (Value & Volume) 2020 & 2033
- Table 19: Global Wool Industry Revenue Million Forecast, by Price Trend Analysis 2020 & 2033
- Table 20: Global Wool Industry Revenue Million Forecast, by Country 2020 & 2033
- Table 21: Germany Wool Industry Revenue (Million) Forecast, by Application 2020 & 2033
- Table 22: Belgium Wool Industry Revenue (Million) Forecast, by Application 2020 & 2033
- Table 23: United Kingdom Wool Industry Revenue (Million) Forecast, by Application 2020 & 2033
- Table 24: Italy Wool Industry Revenue (Million) Forecast, by Application 2020 & 2033
- Table 25: Netherlands Wool Industry Revenue (Million) Forecast, by Application 2020 & 2033
- Table 26: Turkey Wool Industry Revenue (Million) Forecast, by Application 2020 & 2033
- Table 27: Global Wool Industry Revenue Million Forecast, by Production Analysis 2020 & 2033
- Table 28: Global Wool Industry Revenue Million Forecast, by Consumption Analysis 2020 & 2033
- Table 29: Global Wool Industry Revenue Million Forecast, by Import Market Analysis (Value & Volume) 2020 & 2033
- Table 30: Global Wool Industry Revenue Million Forecast, by Export Market Analysis (Value & Volume) 2020 & 2033
- Table 31: Global Wool Industry Revenue Million Forecast, by Price Trend Analysis 2020 & 2033
- Table 32: Global Wool Industry Revenue Million Forecast, by Country 2020 & 2033
- Table 33: China Wool Industry Revenue (Million) Forecast, by Application 2020 & 2033
- Table 34: India Wool Industry Revenue (Million) Forecast, by Application 2020 & 2033
- Table 35: Japan Wool Industry Revenue (Million) Forecast, by Application 2020 & 2033
- Table 36: Australia Wool Industry Revenue (Million) Forecast, by Application 2020 & 2033
- Table 37: New Zealand Wool Industry Revenue (Million) Forecast, by Application 2020 & 2033
- Table 38: Global Wool Industry Revenue Million Forecast, by Production Analysis 2020 & 2033
- Table 39: Global Wool Industry Revenue Million Forecast, by Consumption Analysis 2020 & 2033
- Table 40: Global Wool Industry Revenue Million Forecast, by Import Market Analysis (Value & Volume) 2020 & 2033
- Table 41: Global Wool Industry Revenue Million Forecast, by Export Market Analysis (Value & Volume) 2020 & 2033
- Table 42: Global Wool Industry Revenue Million Forecast, by Price Trend Analysis 2020 & 2033
- Table 43: Global Wool Industry Revenue Million Forecast, by Country 2020 & 2033
- Table 44: Brazil Wool Industry Revenue (Million) Forecast, by Application 2020 & 2033
- Table 45: Argentina Wool Industry Revenue (Million) Forecast, by Application 2020 & 2033
- Table 46: Global Wool Industry Revenue Million Forecast, by Production Analysis 2020 & 2033
- Table 47: Global Wool Industry Revenue Million Forecast, by Consumption Analysis 2020 & 2033
- Table 48: Global Wool Industry Revenue Million Forecast, by Import Market Analysis (Value & Volume) 2020 & 2033
- Table 49: Global Wool Industry Revenue Million Forecast, by Export Market Analysis (Value & Volume) 2020 & 2033
- Table 50: Global Wool Industry Revenue Million Forecast, by Price Trend Analysis 2020 & 2033
- Table 51: Global Wool Industry Revenue Million Forecast, by Country 2020 & 2033
- Table 52: UAE Wool Industry Revenue (Million) Forecast, by Application 2020 & 2033
- Table 53: Saudi Arabia Wool Industry Revenue (Million) Forecast, by Application 2020 & 2033
- Table 54: Oman Wool Industry Revenue (Million) Forecast, by Application 2020 & 2033
- Table 55: Morocco Wool Industry Revenue (Million) Forecast, by Application 2020 & 2033
Frequently Asked Questions
1. What is the projected Compound Annual Growth Rate (CAGR) of the Wool Industry?
The projected CAGR is approximately 3.20%.
2. Which companies are prominent players in the Wool Industry?
Key companies in the market include The Woolmark Company , Australian Wool Innovation , New Zealand Merino , Allendale Australia , Coopers Sheep Shearing.
3. What are the main segments of the Wool Industry?
The market segments include Production Analysis, Consumption Analysis, Import Market Analysis (Value & Volume), Export Market Analysis (Value & Volume), Price Trend Analysis.
4. Can you provide details about the market size?
The market size is estimated to be USD 38.97 Million as of 2022.
5. What are some drivers contributing to market growth?
; Awareness About Health Benefits Associated With Pecan Consumption; Wide Application of Pecan.
6. What are the notable trends driving market growth?
Institutional Initiatives Ensuring the Quality is Driving the Production.
7. Are there any restraints impacting market growth?
; Volatility in the Prices; Adverse Weather Conditions Affecting Yield.
8. Can you provide examples of recent developments in the market?
N/A
9. What pricing options are available for accessing the report?
Pricing options include single-user, multi-user, and enterprise licenses priced at USD 4750, USD 5250, and USD 8750 respectively.
10. Is the market size provided in terms of value or volume?
The market size is provided in terms of value, measured in Million.
11. Are there any specific market keywords associated with the report?
Yes, the market keyword associated with the report is "Wool Industry," which aids in identifying and referencing the specific market segment covered.
12. How do I determine which pricing option suits my needs best?
The pricing options vary based on user requirements and access needs. Individual users may opt for single-user licenses, while businesses requiring broader access may choose multi-user or enterprise licenses for cost-effective access to the report.
13. Are there any additional resources or data provided in the Wool Industry report?
While the report offers comprehensive insights, it's advisable to review the specific contents or supplementary materials provided to ascertain if additional resources or data are available.
14. How can I stay updated on further developments or reports in the Wool Industry?
To stay informed about further developments, trends, and reports in the Wool Industry, consider subscribing to industry newsletters, following relevant companies and organizations, or regularly checking reputable industry news sources and publications.
Methodology
Step 1 - Identification of Relevant Samples Size from Population Database


Step 2 - Approaches for Defining Global Market Size (Value, Volume* & Price*)

Note*: In applicable scenarios
Step 3 - Data Sources
Primary Research
- Web Analytics
- Survey Reports
- Research Institute
- Latest Research Reports
- Opinion Leaders
Secondary Research
- Annual Reports
- White Paper
- Latest Press Release
- Industry Association
- Paid Database
- Investor Presentations

Step 4 - Data Triangulation
Involves using different sources of information in order to increase the validity of a study
These sources are likely to be stakeholders in a program - participants, other researchers, program staff, other community members, and so on.
Then we put all data in single framework & apply various statistical tools to find out the dynamic on the market.
During the analysis stage, feedback from the stakeholder groups would be compared to determine areas of agreement as well as areas of divergence