

Key Insights
The North American crop protection chemicals market, encompassing fungicides, herbicides, and insecticides, is a vital agricultural sector projected to grow steadily. Driven by increasing pest and disease pressures and escalating global food demand, the market benefits from advancements in targeted and sustainable solutions. This dynamic market is segmented by application, crop type, and chemical category. Key industry leaders are actively shaping market trends through innovation.
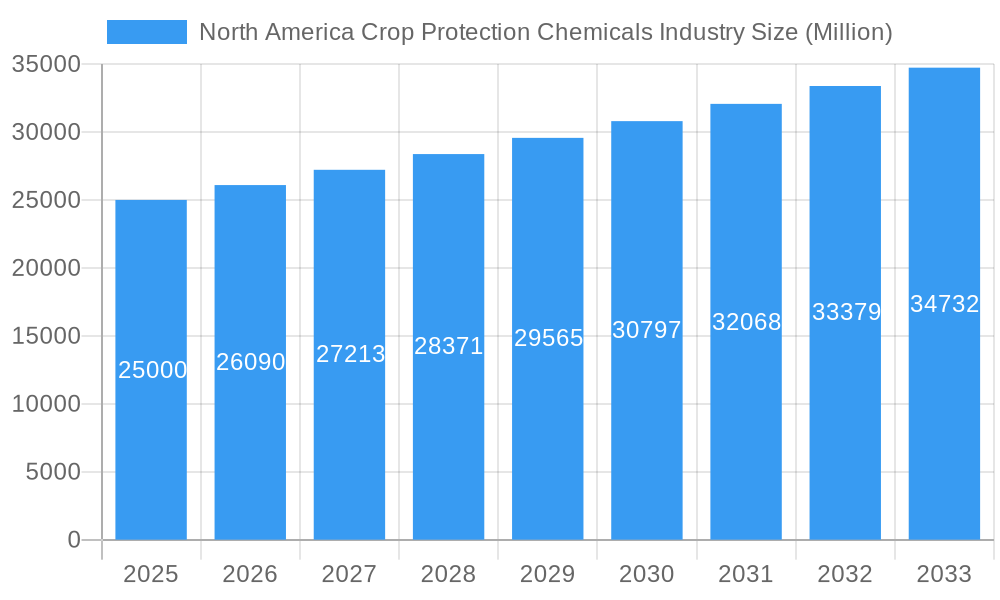
North America Crop Protection Chemicals Industry Market Size (In Billion)
Challenges include environmental concerns driving regulatory changes and a shift towards biopesticides and integrated pest management (IPM) strategies. Fluctuations in raw material prices and economic conditions also present potential restraints. Despite these factors, the market's outlook remains positive, supported by ongoing agricultural expansion and dedicated research into safer, more effective crop protection technologies.
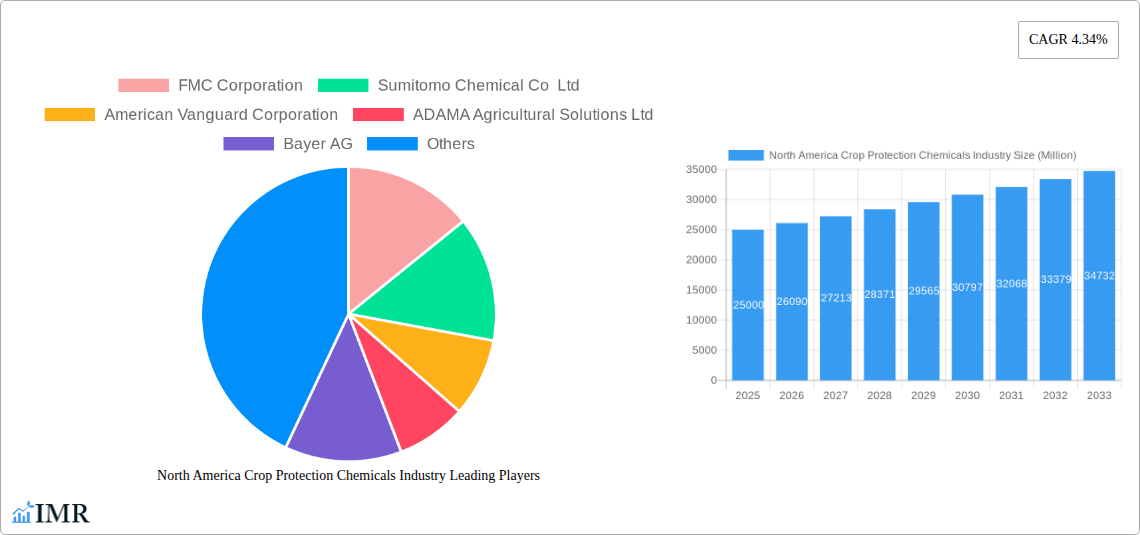
North America Crop Protection Chemicals Industry Company Market Share
North America Crop Protection Chemicals Market Analysis: Forecast 2024-2033
This detailed report offers comprehensive analysis of the North American crop protection chemicals market from 2024 to 2033. It provides critical insights into market dynamics, growth drivers, key segments, and competitive landscapes, enabling stakeholders to strategize effectively within this evolving industry. The market is analyzed by function (fungicides, herbicides, insecticides), application method (chemigation, foliar, seed treatment), crop category (grains, fruits, vegetables), and geographic region (United States, Canada, Mexico). The market size was valued at 76.18 billion in the base year of 2024, with a projected CAGR of 4.6%.
North America Crop Protection Chemicals Industry Market Dynamics & Structure
The North American crop protection chemicals market is characterized by a moderately consolidated structure, with key players like Bayer AG, Syngenta Group, and Corteva Agriscience holding significant market shares. Technological innovation, driven by the need for more effective and sustainable solutions, is a major driver. Stringent regulatory frameworks, including those governing pesticide registration and usage, significantly influence market dynamics. The industry faces competition from bio-pesticides and other sustainable alternatives, while mergers and acquisitions (M&A) activity continues to reshape the competitive landscape. The historical period (2019-2024) witnessed xx M&A deals, with an average deal value of xx Million.
- Market Concentration: High, with top 5 players holding approximately xx% market share in 2025.
- Technological Innovation: Focus on targeted delivery systems, biopesticides, and AI-driven solutions.
- Regulatory Landscape: Stringent EPA regulations in the US and similar agencies in Canada and Mexico impact product approvals and usage.
- Competitive Substitutes: Increasing adoption of biopesticides and integrated pest management (IPM) strategies.
- End-User Demographics: Large-scale commercial farms represent a significant portion of the market, alongside smaller-scale operations and turf & ornamental businesses.
- M&A Trends: Consolidation continues, with larger players acquiring smaller companies to expand their product portfolios and market reach.
North America Crop Protection Chemicals Industry Growth Trends & Insights
The North American crop protection chemicals market experienced significant growth during the historical period (2019-2024), driven by factors such as increasing crop production, growing demand for higher crop yields, and the prevalence of various pests and diseases. The market is projected to grow at a Compound Annual Growth Rate (CAGR) of xx% from 2025 to 2033, reaching a value of xx Million by 2033. This growth is fueled by several factors, including the increasing adoption of advanced technologies like precision agriculture and the development of novel crop protection solutions to combat resistant pests. Consumer demand for safe and sustainable food production also plays a crucial role. Market penetration of new technologies is increasing at a rate of xx% annually, with significant uptake in advanced application methods.
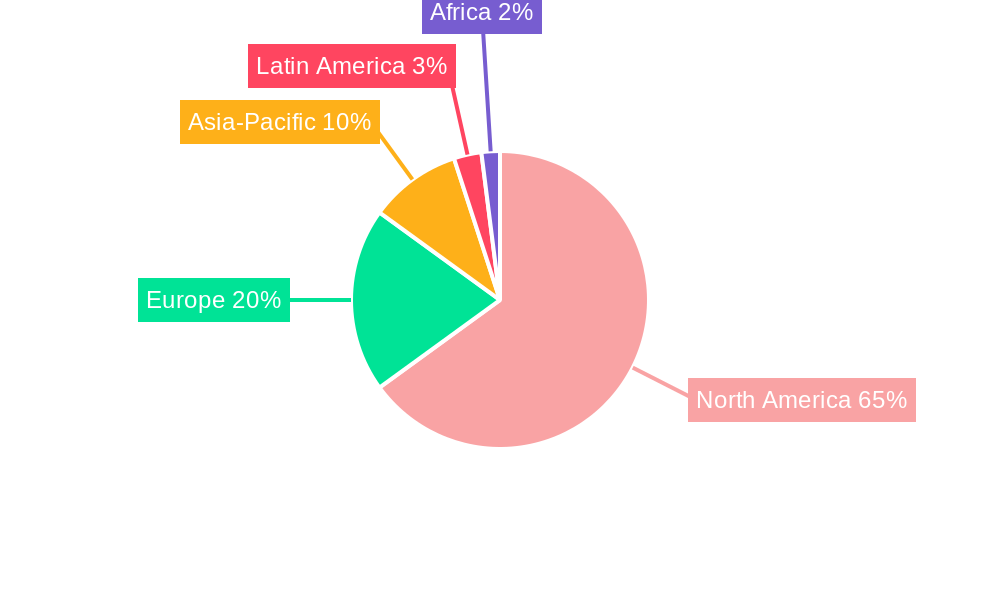
Dominant Regions, Countries, or Segments in North America Crop Protection Chemicals Industry
The United States dominates the North American crop protection chemicals market, accounting for approximately xx% of the total market value in 2025, driven by its large agricultural sector and high adoption of advanced farming techniques. Within the segments, herbicides constitute the largest share, followed by insecticides and fungicides. The foliar application mode holds a dominant position due to its widespread use across various crops. Grains & Cereals and Commercial Crops are the largest crop types consuming these chemicals.
- Key Drivers (US): Extensive arable land, high crop yields, government support for agricultural innovation.
- Key Drivers (Canada): Growing focus on sustainable agricultural practices, increasing demand for high-quality crops.
- Key Drivers (Mexico): Rising agricultural production, expanding commercial farming operations.
- Dominant Segments: Herbicides (xx Million), Foliar Application (xx Million), Grains & Cereals (xx Million), United States (xx Million).
North America Crop Protection Chemicals Industry Product Landscape
The crop protection chemical market showcases a wide array of products, from traditional chemical pesticides to advanced biopesticides and integrated pest management (IPM) solutions. Recent innovations focus on enhancing efficacy, minimizing environmental impact, and improving targeted delivery mechanisms for greater precision and reduced chemical usage. Key selling propositions include improved crop yields, enhanced pest control, and reduced environmental footprint, along with ease of application. Technological advancements such as nanotechnology and AI are transforming the industry by improving efficacy and targeting pest management.
Key Drivers, Barriers & Challenges in North America Crop Protection Chemicals Industry
Key Drivers: Rising food demand, increasing pest and disease pressure, technological advancements in crop protection, government support for agricultural research and development.
Challenges: Stringent regulatory hurdles for new product approvals (resulting in xx Million in delayed product launches annually), increasing public concern over pesticide use, supply chain disruptions impacting raw material availability and pricing ( leading to a xx% increase in costs in 2024), intense competition among established players and emerging biopesticide companies.
Emerging Opportunities in North America Crop Protection Chemicals Industry
Significant opportunities exist in the development and adoption of biopesticides, targeted pest control solutions using AI and precision agriculture technologies, and sustainable agricultural practices. Untapped markets include organic farming and niche crops, while evolving consumer preferences for sustainable food systems drive demand for eco-friendly crop protection solutions.
Growth Accelerators in the North America Crop Protection Chemicals Industry
Technological breakthroughs in formulation and delivery systems, strategic partnerships between chemical companies and agricultural technology firms, and expansion into new markets such as organic farming are key growth accelerators. Government initiatives promoting sustainable agriculture further contribute to market expansion.
Key Players Shaping the North America Crop Protection Chemicals Market
Notable Milestones in North America Crop Protection Chemicals Industry Sector
- July 2023: ADAMA introduced new products, Davai A Plus and Clearfield Broad-Spectrum Herbicide Solutions, expanding its offerings for imidazolinone-tolerant legumes.
- April 2023: Nufarm launched Tourney EZ, a new liquid fungicide for turf and ornamental crops, strengthening its position in this segment.
- March 2023: AMVAC launched new herbicides (Impact Core and Sinate) to combat herbicide-resistant weeds in maize.
In-Depth North America Crop Protection Chemicals Industry Market Outlook
The North American crop protection chemicals market is poised for continued growth, driven by technological innovations, increased demand for food, and the evolving needs of sustainable agriculture. Strategic partnerships, market expansion into high-growth segments, and the development of environmentally friendly solutions will be crucial for future success. The market's long-term potential is significant, presenting numerous opportunities for both established players and new entrants.
North America Crop Protection Chemicals Industry Segmentation
-
1. Function
- 1.1. Fungicide
- 1.2. Herbicide
- 1.3. Insecticide
- 1.4. Molluscicide
- 1.5. Nematicide
-
2. Application Mode
- 2.1. Chemigation
- 2.2. Foliar
- 2.3. Fumigation
- 2.4. Seed Treatment
- 2.5. Soil Treatment
-
3. Crop Type
- 3.1. Commercial Crops
- 3.2. Fruits & Vegetables
- 3.3. Grains & Cereals
- 3.4. Pulses & Oilseeds
- 3.5. Turf & Ornamental
-
4. Function
- 4.1. Fungicide
- 4.2. Herbicide
- 4.3. Insecticide
- 4.4. Molluscicide
- 4.5. Nematicide
-
5. Application Mode
- 5.1. Chemigation
- 5.2. Foliar
- 5.3. Fumigation
- 5.4. Seed Treatment
- 5.5. Soil Treatment
-
6. Crop Type
- 6.1. Commercial Crops
- 6.2. Fruits & Vegetables
- 6.3. Grains & Cereals
- 6.4. Pulses & Oilseeds
- 6.5. Turf & Ornamental
North America Crop Protection Chemicals Industry Segmentation By Geography
-
1. North America
- 1.1. United States
- 1.2. Canada
- 1.3. Mexico
North America Crop Protection Chemicals Industry Regional Market Share
Geographic Coverage of North America Crop Protection Chemicals Industry
North America Crop Protection Chemicals Industry REPORT HIGHLIGHTS
| Aspects | Details |
|---|---|
| Study Period | 2020-2034 |
| Base Year | 2025 |
| Estimated Year | 2026 |
| Forecast Period | 2026-2034 |
| Historical Period | 2020-2025 |
| Growth Rate | CAGR of 4.6% from 2020-2034 |
| Segmentation |
|
Table of Contents
- 1. Introduction
- 1.1. Research Scope
- 1.2. Market Segmentation
- 1.3. Research Objective
- 1.4. Definitions and Assumptions
- 2. Executive Summary
- 2.1. Market Snapshot
- 3. Market Dynamics
- 3.1. Market Drivers
- 3.2. Market Restrains
- 3.3. Market Trends
- 3.4. Market Opportunities
- 4. Market Factor Analysis
- 4.1. Porters Five Forces
- 4.1.1. Bargaining Power of Suppliers
- 4.1.2. Bargaining Power of Buyers
- 4.1.3. Threat of New Entrants
- 4.1.4. Threat of Substitutes
- 4.1.5. Competitive Rivalry
- 4.2. PESTEL analysis
- 4.3. BCG Analysis
- 4.3.1. Stars (High Growth, High Market Share)
- 4.3.2. Cash Cows (Low Growth, High Market Share)
- 4.3.3. Question Mark (High Growth, Low Market Share)
- 4.3.4. Dogs (Low Growth, Low Market Share)
- 4.4. Ansoff Matrix Analysis
- 4.5. Supply Chain Analysis
- 4.6. Regulatory Landscape
- 4.7. Current Market Potential and Opportunity Assessment (TAM–SAM–SOM Framework)
- 4.8. IMR Analyst Note
- 4.1. Porters Five Forces
- 5. Market Analysis, Insights and Forecast 2021-2033
- 5.1. Market Analysis, Insights and Forecast - by Function
- 5.1.1. Fungicide
- 5.1.2. Herbicide
- 5.1.3. Insecticide
- 5.1.4. Molluscicide
- 5.1.5. Nematicide
- 5.2. Market Analysis, Insights and Forecast - by Application Mode
- 5.2.1. Chemigation
- 5.2.2. Foliar
- 5.2.3. Fumigation
- 5.2.4. Seed Treatment
- 5.2.5. Soil Treatment
- 5.3. Market Analysis, Insights and Forecast - by Crop Type
- 5.3.1. Commercial Crops
- 5.3.2. Fruits & Vegetables
- 5.3.3. Grains & Cereals
- 5.3.4. Pulses & Oilseeds
- 5.3.5. Turf & Ornamental
- 5.4. Market Analysis, Insights and Forecast - by Function
- 5.4.1. Fungicide
- 5.4.2. Herbicide
- 5.4.3. Insecticide
- 5.4.4. Molluscicide
- 5.4.5. Nematicide
- 5.5. Market Analysis, Insights and Forecast - by Application Mode
- 5.5.1. Chemigation
- 5.5.2. Foliar
- 5.5.3. Fumigation
- 5.5.4. Seed Treatment
- 5.5.5. Soil Treatment
- 5.6. Market Analysis, Insights and Forecast - by Crop Type
- 5.6.1. Commercial Crops
- 5.6.2. Fruits & Vegetables
- 5.6.3. Grains & Cereals
- 5.6.4. Pulses & Oilseeds
- 5.6.5. Turf & Ornamental
- 5.7. Market Analysis, Insights and Forecast - by Region
- 5.7.1. North America
- 5.1. Market Analysis, Insights and Forecast - by Function
- 6. North America Crop Protection Chemicals Industry Analysis, Insights and Forecast, 2021-2033
- 6.1. Market Analysis, Insights and Forecast - by Function
- 6.1.1. Fungicide
- 6.1.2. Herbicide
- 6.1.3. Insecticide
- 6.1.4. Molluscicide
- 6.1.5. Nematicide
- 6.2. Market Analysis, Insights and Forecast - by Application Mode
- 6.2.1. Chemigation
- 6.2.2. Foliar
- 6.2.3. Fumigation
- 6.2.4. Seed Treatment
- 6.2.5. Soil Treatment
- 6.3. Market Analysis, Insights and Forecast - by Crop Type
- 6.3.1. Commercial Crops
- 6.3.2. Fruits & Vegetables
- 6.3.3. Grains & Cereals
- 6.3.4. Pulses & Oilseeds
- 6.3.5. Turf & Ornamental
- 6.4. Market Analysis, Insights and Forecast - by Function
- 6.4.1. Fungicide
- 6.4.2. Herbicide
- 6.4.3. Insecticide
- 6.4.4. Molluscicide
- 6.4.5. Nematicide
- 6.5. Market Analysis, Insights and Forecast - by Application Mode
- 6.5.1. Chemigation
- 6.5.2. Foliar
- 6.5.3. Fumigation
- 6.5.4. Seed Treatment
- 6.5.5. Soil Treatment
- 6.6. Market Analysis, Insights and Forecast - by Crop Type
- 6.6.1. Commercial Crops
- 6.6.2. Fruits & Vegetables
- 6.6.3. Grains & Cereals
- 6.6.4. Pulses & Oilseeds
- 6.6.5. Turf & Ornamental
- 6.1. Market Analysis, Insights and Forecast - by Function
- 7. Competitive Analysis
- 7.1. Company Profiles
- 7.1.1 FMC Corporation
- 7.1.1.1. Company Overview
- 7.1.1.2. Products
- 7.1.1.3. Company Financials
- 7.1.1.4. SWOT Analysis
- 7.1.2 Sumitomo Chemical Co Ltd
- 7.1.2.1. Company Overview
- 7.1.2.2. Products
- 7.1.2.3. Company Financials
- 7.1.2.4. SWOT Analysis
- 7.1.3 American Vanguard Corporation
- 7.1.3.1. Company Overview
- 7.1.3.2. Products
- 7.1.3.3. Company Financials
- 7.1.3.4. SWOT Analysis
- 7.1.4 ADAMA Agricultural Solutions Ltd
- 7.1.4.1. Company Overview
- 7.1.4.2. Products
- 7.1.4.3. Company Financials
- 7.1.4.4. SWOT Analysis
- 7.1.5 Bayer AG
- 7.1.5.1. Company Overview
- 7.1.5.2. Products
- 7.1.5.3. Company Financials
- 7.1.5.4. SWOT Analysis
- 7.1.6 UPL Limite
- 7.1.6.1. Company Overview
- 7.1.6.2. Products
- 7.1.6.3. Company Financials
- 7.1.6.4. SWOT Analysis
- 7.1.7 Syngenta Group
- 7.1.7.1. Company Overview
- 7.1.7.2. Products
- 7.1.7.3. Company Financials
- 7.1.7.4. SWOT Analysis
- 7.1.8 Corteva Agriscience
- 7.1.8.1. Company Overview
- 7.1.8.2. Products
- 7.1.8.3. Company Financials
- 7.1.8.4. SWOT Analysis
- 7.1.9 Nufarm Ltd
- 7.1.9.1. Company Overview
- 7.1.9.2. Products
- 7.1.9.3. Company Financials
- 7.1.9.4. SWOT Analysis
- 7.1.10 BASF SE
- 7.1.10.1. Company Overview
- 7.1.10.2. Products
- 7.1.10.3. Company Financials
- 7.1.10.4. SWOT Analysis
- 7.1.1 FMC Corporation
- 7.2. Market Entropy
- 7.2.1 Company's Key Areas Served
- 7.2.2 Recent Developments
- 7.3. Company Market Share Analysis 2025
- 7.3.1 Top 5 Companies Market Share Analysis
- 7.3.2 Top 3 Companies Market Share Analysis
- 7.4. List of Potential Customers
- 8. Research Methodology
List of Figures
- Figure 1: North America Crop Protection Chemicals Industry Revenue Breakdown (billion, %) by Product 2025 & 2033
- Figure 2: North America Crop Protection Chemicals Industry Share (%) by Company 2025
List of Tables
- Table 1: North America Crop Protection Chemicals Industry Revenue billion Forecast, by Function 2020 & 2033
- Table 2: North America Crop Protection Chemicals Industry Volume Kiloton Forecast, by Function 2020 & 2033
- Table 3: North America Crop Protection Chemicals Industry Revenue billion Forecast, by Application Mode 2020 & 2033
- Table 4: North America Crop Protection Chemicals Industry Volume Kiloton Forecast, by Application Mode 2020 & 2033
- Table 5: North America Crop Protection Chemicals Industry Revenue billion Forecast, by Crop Type 2020 & 2033
- Table 6: North America Crop Protection Chemicals Industry Volume Kiloton Forecast, by Crop Type 2020 & 2033
- Table 7: North America Crop Protection Chemicals Industry Revenue billion Forecast, by Function 2020 & 2033
- Table 8: North America Crop Protection Chemicals Industry Volume Kiloton Forecast, by Function 2020 & 2033
- Table 9: North America Crop Protection Chemicals Industry Revenue billion Forecast, by Application Mode 2020 & 2033
- Table 10: North America Crop Protection Chemicals Industry Volume Kiloton Forecast, by Application Mode 2020 & 2033
- Table 11: North America Crop Protection Chemicals Industry Revenue billion Forecast, by Crop Type 2020 & 2033
- Table 12: North America Crop Protection Chemicals Industry Volume Kiloton Forecast, by Crop Type 2020 & 2033
- Table 13: North America Crop Protection Chemicals Industry Revenue billion Forecast, by Region 2020 & 2033
- Table 14: North America Crop Protection Chemicals Industry Volume Kiloton Forecast, by Region 2020 & 2033
- Table 15: North America Crop Protection Chemicals Industry Revenue billion Forecast, by Function 2020 & 2033
- Table 16: North America Crop Protection Chemicals Industry Volume Kiloton Forecast, by Function 2020 & 2033
- Table 17: North America Crop Protection Chemicals Industry Revenue billion Forecast, by Application Mode 2020 & 2033
- Table 18: North America Crop Protection Chemicals Industry Volume Kiloton Forecast, by Application Mode 2020 & 2033
- Table 19: North America Crop Protection Chemicals Industry Revenue billion Forecast, by Crop Type 2020 & 2033
- Table 20: North America Crop Protection Chemicals Industry Volume Kiloton Forecast, by Crop Type 2020 & 2033
- Table 21: North America Crop Protection Chemicals Industry Revenue billion Forecast, by Function 2020 & 2033
- Table 22: North America Crop Protection Chemicals Industry Volume Kiloton Forecast, by Function 2020 & 2033
- Table 23: North America Crop Protection Chemicals Industry Revenue billion Forecast, by Application Mode 2020 & 2033
- Table 24: North America Crop Protection Chemicals Industry Volume Kiloton Forecast, by Application Mode 2020 & 2033
- Table 25: North America Crop Protection Chemicals Industry Revenue billion Forecast, by Crop Type 2020 & 2033
- Table 26: North America Crop Protection Chemicals Industry Volume Kiloton Forecast, by Crop Type 2020 & 2033
- Table 27: North America Crop Protection Chemicals Industry Revenue billion Forecast, by Country 2020 & 2033
- Table 28: North America Crop Protection Chemicals Industry Volume Kiloton Forecast, by Country 2020 & 2033
- Table 29: United States North America Crop Protection Chemicals Industry Revenue (billion) Forecast, by Application 2020 & 2033
- Table 30: United States North America Crop Protection Chemicals Industry Volume (Kiloton) Forecast, by Application 2020 & 2033
- Table 31: Canada North America Crop Protection Chemicals Industry Revenue (billion) Forecast, by Application 2020 & 2033
- Table 32: Canada North America Crop Protection Chemicals Industry Volume (Kiloton) Forecast, by Application 2020 & 2033
- Table 33: Mexico North America Crop Protection Chemicals Industry Revenue (billion) Forecast, by Application 2020 & 2033
- Table 34: Mexico North America Crop Protection Chemicals Industry Volume (Kiloton) Forecast, by Application 2020 & 2033
Frequently Asked Questions
1. What is the projected Compound Annual Growth Rate (CAGR) of the North America Crop Protection Chemicals Industry?
The projected CAGR is approximately 4.6%.
2. Which companies are prominent players in the North America Crop Protection Chemicals Industry?
Key companies in the market include FMC Corporation, Sumitomo Chemical Co Ltd, American Vanguard Corporation, ADAMA Agricultural Solutions Ltd, Bayer AG, UPL Limite, Syngenta Group, Corteva Agriscience, Nufarm Ltd, BASF SE.
3. What are the main segments of the North America Crop Protection Chemicals Industry?
The market segments include Function, Application Mode, Crop Type, Function, Application Mode, Crop Type.
4. Can you provide details about the market size?
The market size is estimated to be USD 76.18 billion as of 2022.
5. What are some drivers contributing to market growth?
Seed Treatment As A Solution To Enhance Yield; Growing Awareness For Seed Treatment Among The Farmers; Rising Trend Of Organic Farming.
6. What are the notable trends driving market growth?
The United States dominated the market due to the increased demand to protect crops from pests and diseases.
7. Are there any restraints impacting market growth?
Limitations Across Farm-Level Seed Treatment; Rising Environmental Concerns.
8. Can you provide examples of recent developments in the market?
July 2023: ADAMA introduced new products, Davai A Plus and Clearfield Broad-Spectrum Herbicide Solutions, for imidazolinone-tolerant legumes like lentils, peas, and soybeans.April 2023: Nufarm launched a new liquid formulation fungicide, Tourney EZ, exclusively for turf and ornamental crops based on customer demand, which further strengthens the company's role in turf and ornamental crop protection.March 2023: AMVAC launched a portfolio of herbicides, including Impact Core and Sinate, to combat weed resistance in maize.
9. What pricing options are available for accessing the report?
Pricing options include single-user, multi-user, and enterprise licenses priced at USD 3800, USD 4500, and USD 5800 respectively.
10. Is the market size provided in terms of value or volume?
The market size is provided in terms of value, measured in billion and volume, measured in Kiloton.
11. Are there any specific market keywords associated with the report?
Yes, the market keyword associated with the report is "North America Crop Protection Chemicals Industry," which aids in identifying and referencing the specific market segment covered.
12. How do I determine which pricing option suits my needs best?
The pricing options vary based on user requirements and access needs. Individual users may opt for single-user licenses, while businesses requiring broader access may choose multi-user or enterprise licenses for cost-effective access to the report.
13. Are there any additional resources or data provided in the North America Crop Protection Chemicals Industry report?
While the report offers comprehensive insights, it's advisable to review the specific contents or supplementary materials provided to ascertain if additional resources or data are available.
14. How can I stay updated on further developments or reports in the North America Crop Protection Chemicals Industry?
To stay informed about further developments, trends, and reports in the North America Crop Protection Chemicals Industry, consider subscribing to industry newsletters, following relevant companies and organizations, or regularly checking reputable industry news sources and publications.
Methodology
Step 1 - Identification of Relevant Samples Size from Population Database


Step 2 - Approaches for Defining Global Market Size (Value, Volume* & Price*)

Note*: In applicable scenarios
Step 3 - Data Sources
Primary Research
- Web Analytics
- Survey Reports
- Research Institute
- Latest Research Reports
- Opinion Leaders
Secondary Research
- Annual Reports
- White Paper
- Latest Press Release
- Industry Association
- Paid Database
- Investor Presentations

Step 4 - Data Triangulation
Involves using different sources of information in order to increase the validity of a study
These sources are likely to be stakeholders in a program - participants, other researchers, program staff, other community members, and so on.
Then we put all data in single framework & apply various statistical tools to find out the dynamic on the market.
During the analysis stage, feedback from the stakeholder groups would be compared to determine areas of agreement as well as areas of divergence