

Key Insights
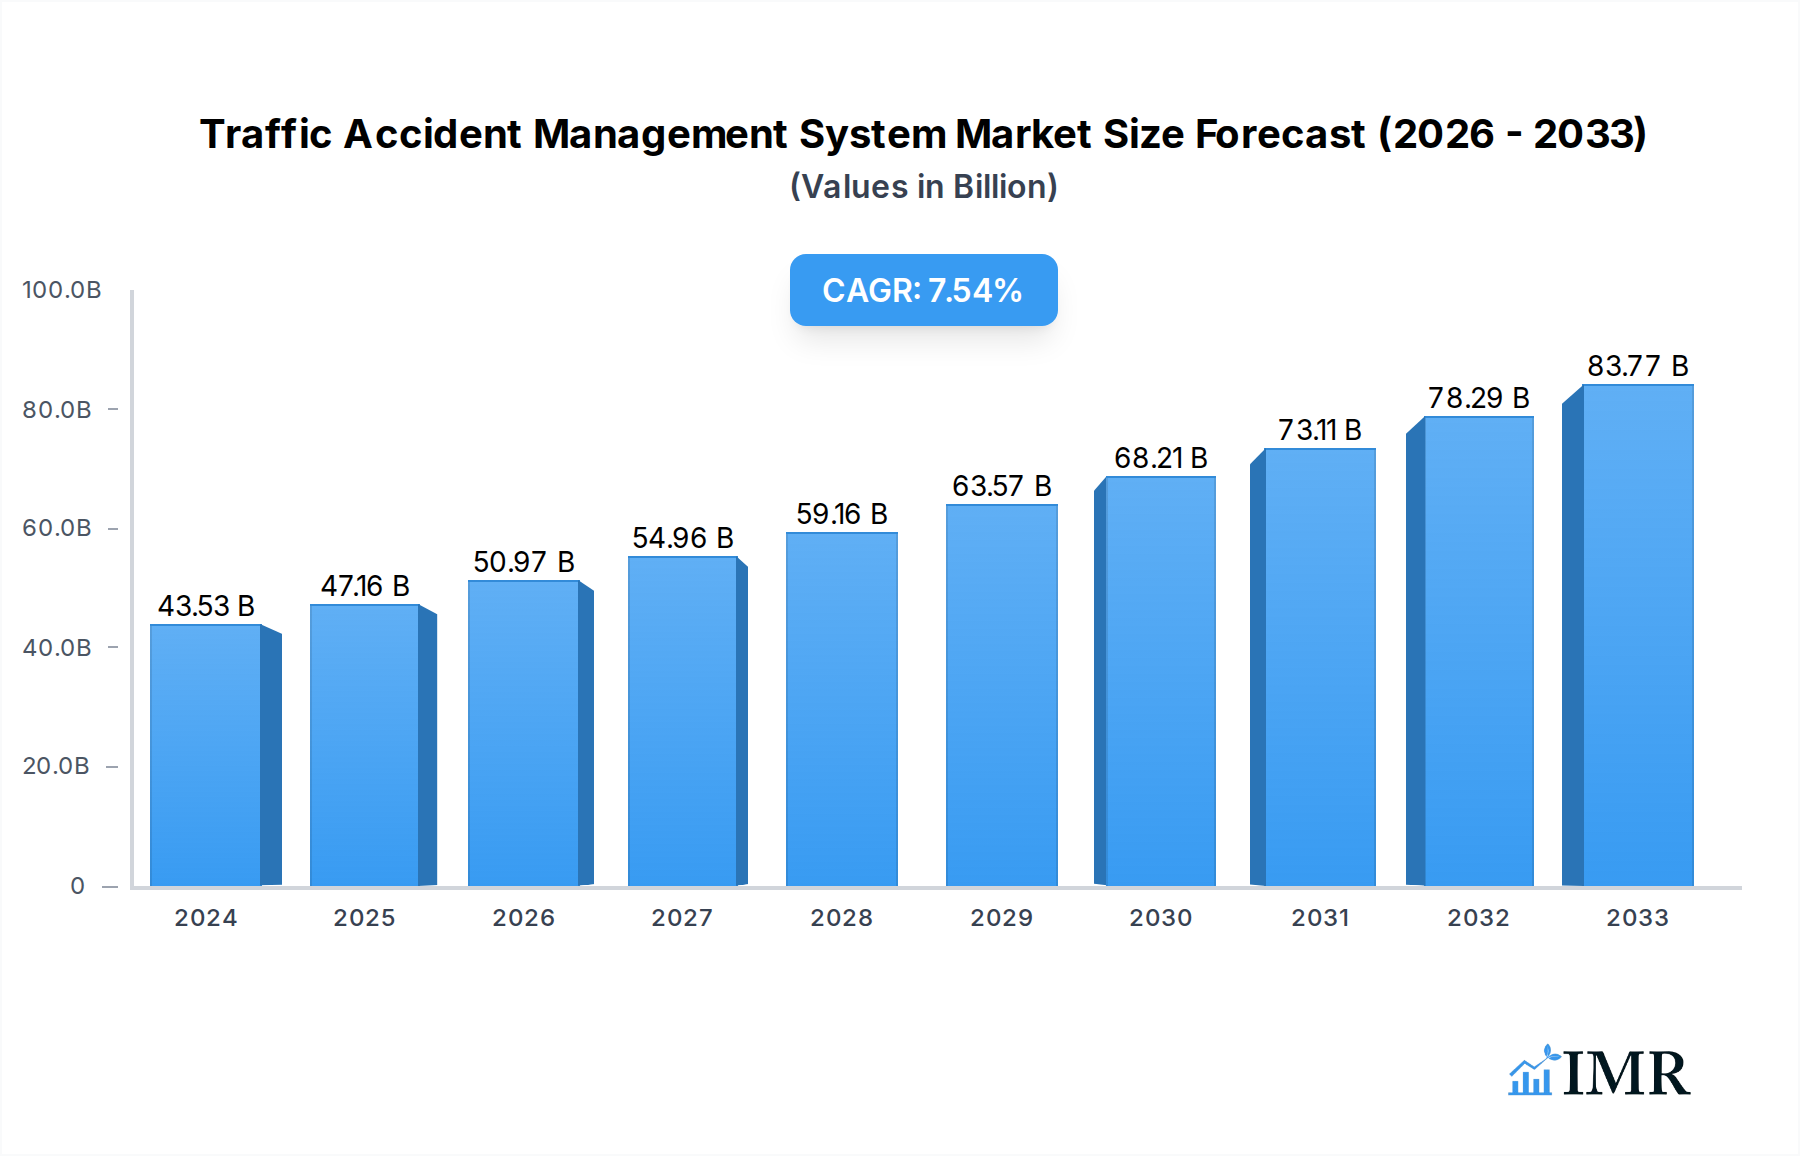
The global Traffic Accident Management System market is experiencing robust growth, projected to reach USD 43.53 billion in 2024, with an impressive Compound Annual Growth Rate (CAGR) of 11.7% between 2025 and 2033. This expansion is fueled by increasing urbanization, a surge in vehicle ownership, and a growing imperative for enhanced road safety and efficient traffic flow. Governments worldwide are prioritizing intelligent transportation systems (ITS) to mitigate the socio-economic impact of traffic accidents, including fatalities, injuries, and economic losses. The demand for advanced technologies such as real-time incident detection, automated alerts, traffic rerouting, and post-accident analysis is on the rise. Furthermore, the integration of AI and IoT in traffic management solutions is a significant trend, enabling predictive capabilities and proactive intervention strategies, thereby further bolstering market expansion.

Traffic Accident Management System Market Size (In Billion)
The market is segmented into applications encompassing Municipal, State, and Federal levels, reflecting the layered governance structures involved in traffic management. By type, the market is divided into Software and Services, with software solutions forming the backbone of data analysis and system integration, while services are crucial for implementation, maintenance, and ongoing support. Key drivers include the increasing frequency of road accidents, stringent government regulations for road safety, and the continuous innovation in connected vehicle technology and smart city infrastructure. Restraints, such as high initial investment costs for system deployment and data privacy concerns, are being addressed through advancements in cloud-based solutions and robust cybersecurity measures. Major players are actively investing in research and development to offer comprehensive and integrated traffic accident management solutions.
Traffic Accident Management System Company Market Share
Traffic Accident Management System Market Dynamics & Structure
The global Traffic Accident Management System market is characterized by a moderately concentrated landscape, with leading players investing heavily in research and development to drive technological innovation. Key drivers include the increasing adoption of smart city initiatives, AI-powered analytics, and IoT integration for real-time traffic monitoring and incident response. Regulatory frameworks, particularly those focused on road safety enhancement and traffic flow optimization, are crucial in shaping market adoption. Competitive product substitutes, such as traditional manual reporting methods and less integrated traffic management solutions, are gradually being overshadowed by the comprehensive capabilities of advanced TAMS. End-user demographics span municipal, state, and federal government agencies, with increasing demand from private entities managing large transportation networks. Mergers and acquisitions (M&A) activity is moderate, driven by the pursuit of market consolidation and the acquisition of innovative technologies.
- Market Concentration: Moderately concentrated, with significant market share held by a few key players.
- Technological Innovation Drivers: AI, IoT, real-time data analytics, predictive modeling for accident prevention.
- Regulatory Frameworks: Focus on road safety standards, data privacy, and interoperability of traffic management systems.
- Competitive Product Substitutes: Traditional manual reporting, basic surveillance systems, disconnected traffic signal controllers.
- End-User Demographics: Government agencies (municipal, state, federal), transportation authorities, large private fleet operators.
- M&A Trends: Strategic acquisitions to expand product portfolios and gain market share.
Traffic Accident Management System Growth Trends & Insights
The Traffic Accident Management System market is poised for substantial growth, projected to reach a valuation of $19.5 billion by 2025, with an impressive Compound Annual Growth Rate (CAGR) of 12.8% during the forecast period of 2025-2033. This robust expansion is underpinned by a confluence of factors, including escalating urbanization, the burgeoning demand for enhanced road safety, and the pervasive integration of advanced technologies into transportation infrastructure. The adoption of TAMS is accelerating across municipal, state, and federal levels, driven by a pressing need to mitigate the economic and human costs associated with traffic accidents. Software solutions are emerging as the dominant segment, reflecting a shift towards intelligent, data-driven approaches to traffic management. The services segment, encompassing system integration, maintenance, and consulting, is also experiencing significant growth, as organizations seek expert support in deploying and optimizing complex TAMS.
Technological disruptions are playing a pivotal role in shaping market dynamics. The proliferation of connected vehicles, the deployment of advanced sensors and cameras, and the widespread adoption of AI and machine learning algorithms are enabling real-time accident detection, prediction, and more efficient response mechanisms. These advancements are not only improving emergency response times but also contributing to proactive accident prevention strategies. Consumer behavior is also evolving, with a growing expectation for safer and more seamless travel experiences. This translates into increased pressure on government agencies and transportation authorities to invest in sophisticated TAMS that can deliver on these expectations. The market penetration of TAMS is steadily increasing, particularly in developed economies, as the tangible benefits of reduced accident rates, minimized traffic congestion, and improved emergency service efficiency become increasingly evident.
The parent market, encompassing the broader intelligent transportation systems (ITS) market, is valued at an estimated $150 billion in 2025, providing a fertile ground for the growth of specialized segments like TAMS. Within this parent market, the child market of traffic management solutions is projected to reach $55 billion by 2025, further highlighting the significant potential for TAMS to capture a substantial share. The increasing focus on data analytics and the implementation of predictive maintenance for traffic infrastructure also contribute to the upward trajectory of the TAMS market. Government initiatives aimed at modernizing transportation networks and enhancing public safety are expected to be key growth accelerators.
Dominant Regions, Countries, or Segments in Traffic Accident Management System
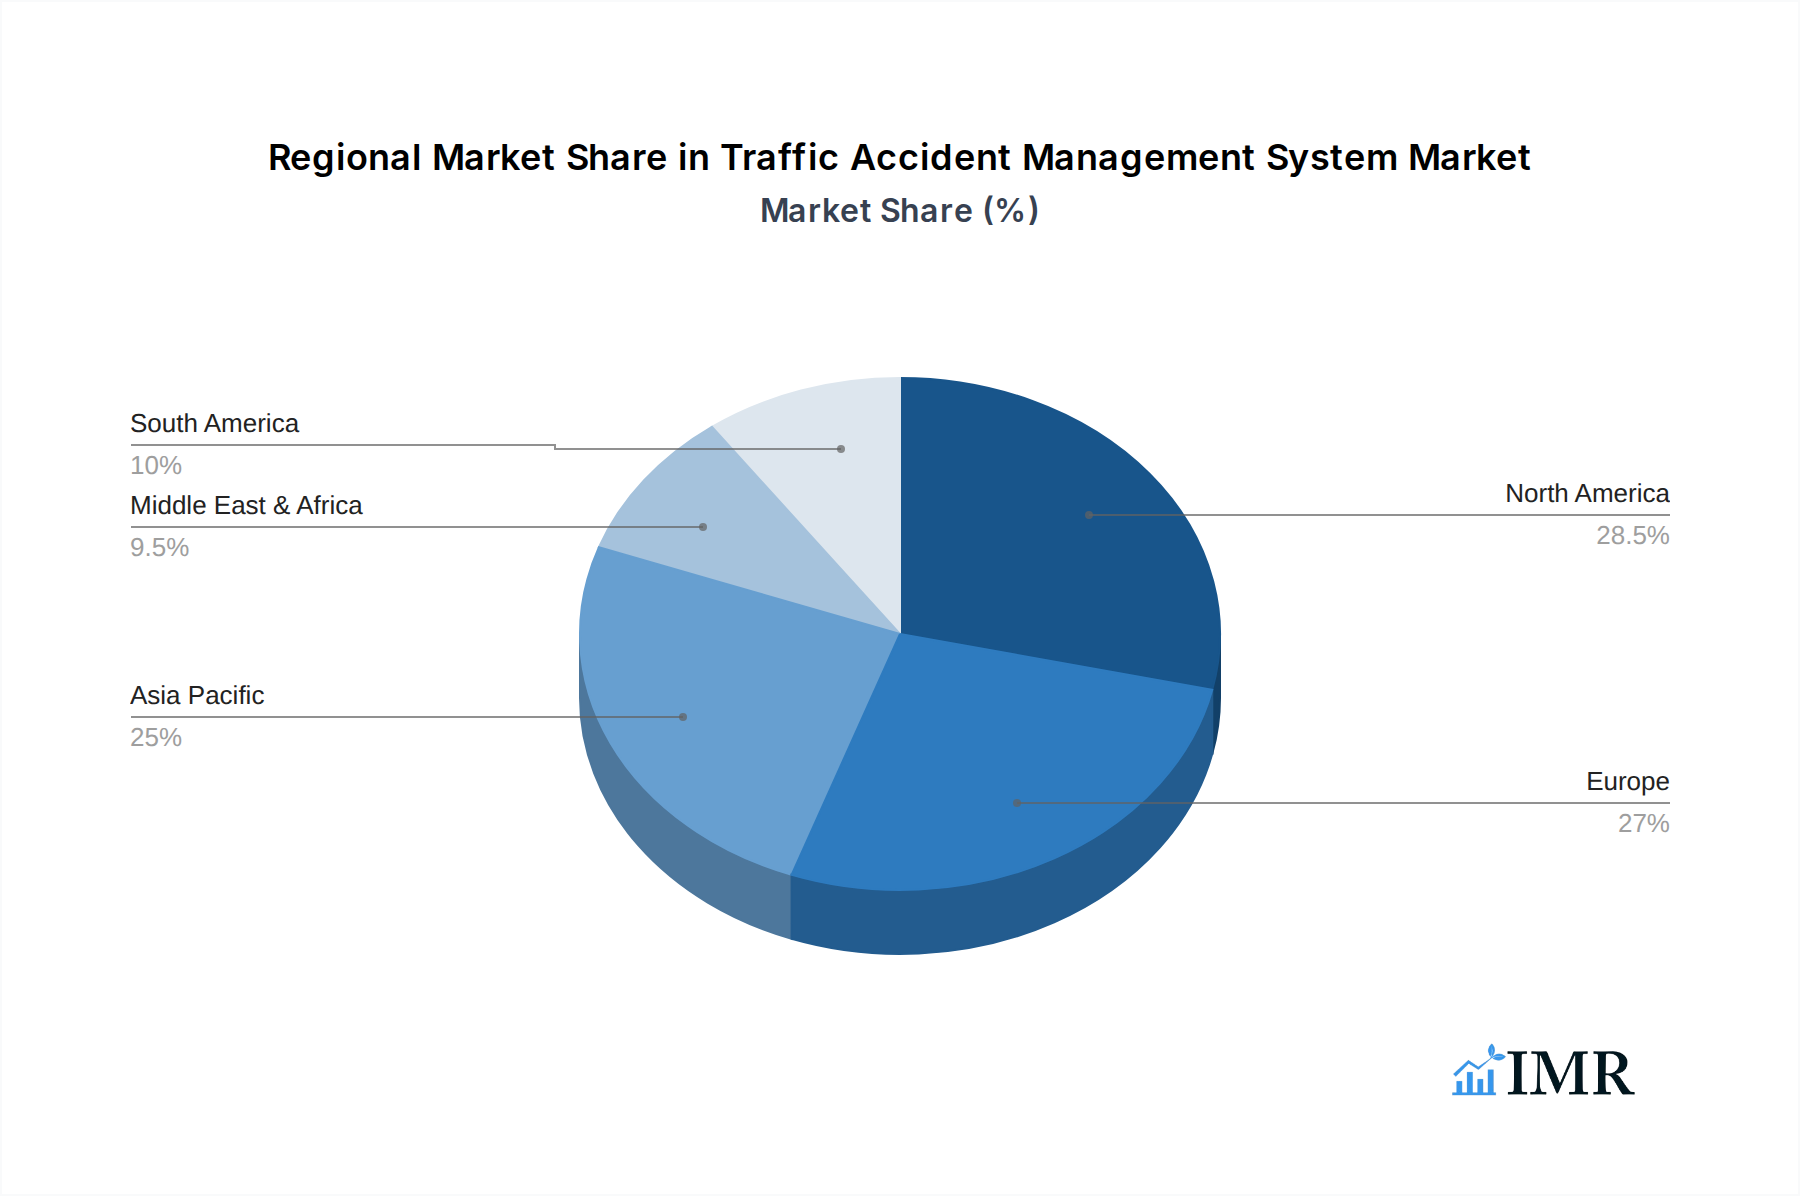
The North American region is projected to dominate the global Traffic Accident Management System market, driven by significant investments in smart city infrastructure, advanced traffic management technologies, and stringent road safety regulations. The United States, in particular, is a frontrunner, with federal, state, and municipal governments actively deploying TAMS solutions to enhance road safety and optimize traffic flow across its vast transportation network. The Federal application segment holds a commanding position due to large-scale national initiatives focused on highway safety and emergency response coordination.
Key Drivers of Dominance in North America:
- Government Funding and Initiatives: Substantial federal grants and state-level programs dedicated to traffic safety and intelligent transportation systems.
- Technological Adoption: High uptake of AI, IoT, and cloud-based solutions for real-time data analysis and incident management.
- Infrastructure Development: Continuous upgrades to existing road networks and the development of new smart infrastructure.
- Regulatory Environment: Robust enforcement of traffic safety laws and mandates for advanced traffic management technologies.
- Market Share: North America is expected to capture approximately 35% of the global TAMS market by 2025, with the US accounting for a significant portion of this share.
Within the Types segment, Software is emerging as the most dominant category, projected to account for over 55% of the market share in 2025. This is attributed to the increasing sophistication of TAMS platforms, which offer advanced analytics, predictive capabilities, and seamless integration with various data sources. Municipal applications within the Application segment are also witnessing rapid growth, as cities worldwide prioritize improving urban mobility and reducing traffic-related fatalities and injuries. The growing adoption of connected vehicle technologies and the need for efficient management of urban traffic congestion are further fueling this trend.
- Dominant Region: North America, led by the United States.
- Dominant Application Segment: Federal, followed by State and Municipal.
- Dominant Type Segment: Software, followed by Services.
- Growth Potential: High growth anticipated in emerging economies in Asia Pacific and Europe, driven by increasing urbanization and infrastructure development.
- Market Share in 2025 (Estimated): North America (~$6.8 billion), Europe (~$5.0 billion), Asia Pacific (~$4.5 billion), Rest of World (~$3.2 billion).
Traffic Accident Management System Product Landscape
The Traffic Accident Management System product landscape is characterized by innovative solutions designed to enhance real-time incident detection, response, and management. Key products include AI-powered video analytics for automated accident detection, integrated communication platforms for seamless emergency service coordination, and advanced data management systems for post-accident analysis and prevention. These systems leverage technologies like IoT sensors, GPS tracking, and sophisticated algorithms to provide comprehensive situational awareness. Unique selling propositions often revolve around rapid deployment, scalability, and interoperability with existing traffic control infrastructure. Technological advancements are focused on predictive analytics to anticipate accident hotspots and proactive interventions.
Key Drivers, Barriers & Challenges in Traffic Accident Management System
Key Drivers:
- Increasing Road Safety Concerns: Growing awareness and demand for solutions to reduce traffic fatalities and injuries.
- Smart City Initiatives: Government push for integrated urban management systems, including advanced traffic control.
- Technological Advancements: Evolution of AI, IoT, and big data analytics enabling more sophisticated TAMS.
- Economic Benefits: Reduction in accident-related costs, including healthcare, property damage, and lost productivity.
- Policy and Regulatory Support: Government mandates and funding for traffic safety and management technologies.
Key Barriers & Challenges:
- High Implementation Costs: Significant upfront investment required for hardware, software, and infrastructure integration.
- Data Privacy and Security Concerns: Protecting sensitive traffic and personal data from cyber threats.
- Interoperability Issues: Integrating diverse systems from various vendors and legacy infrastructure.
- Lack of Skilled Workforce: Shortage of trained professionals to deploy, operate, and maintain complex TAMS.
- Regulatory Hurdles and Standardization: Evolving regulations and the need for industry-wide standards.
- Supply Chain Disruptions: Potential impact on the availability of critical hardware components.
- Competitive Pressures: Intense competition among vendors, leading to price sensitivity.
- Resistance to Change: Inertia in adopting new technologies within established public sector frameworks.
Emerging Opportunities in Traffic Accident Management System
Emerging opportunities lie in the integration of autonomous vehicle data with TAMS for enhanced safety protocols and in the development of predictive AI models for proactive accident mitigation. Untapped markets in developing regions with rapidly expanding transportation networks present significant growth potential. Innovative applications include the use of drones for accident scene assessment and the deployment of connected infrastructure that communicates directly with vehicles. Evolving consumer preferences for safer and more efficient travel are driving demand for personalized safety features and real-time hazard alerts, creating avenues for new product development and service offerings. The expansion of V2X (Vehicle-to-Everything) communication will be a critical enabler for next-generation TAMS.
Growth Accelerators in the Traffic Accident Management System Industry
Growth accelerators in the Traffic Accident Management System industry are primarily driven by continuous technological breakthroughs, particularly in the realm of Artificial Intelligence and the Internet of Things. The increasing prevalence of smart city investments globally acts as a significant catalyst, with governments prioritizing integrated traffic management solutions. Strategic partnerships between technology providers, infrastructure companies, and government agencies are fostering innovation and accelerating market penetration. Furthermore, the growing emphasis on data-driven decision-making in transportation planning is encouraging the adoption of sophisticated TAMS that can provide actionable insights. Expansion into emerging markets with significant infrastructure development needs also represents a key growth avenue.
Key Players Shaping the Traffic Accident Management System Market
- Kyosan Electric Manufacturing Co,Ltd.
- Advantech Co.,Ltd.
- Siemens
- Cubic Corporation
- KapschTrafficCom AG
- Q-Free ASA
- TransCore
- SNC-Lavalin Group
- Flir Systems Inc
- Cisco Systems Inc
- Jenoptik Ag
- EFKON Ag
- SavariInc
- Swarco Ag
- Atkins Group
Notable Milestones in Traffic Accident Management System Sector
- 2019: Launch of AI-powered video analytics for real-time accident detection by leading technology firms.
- 2020: Increased government funding for smart traffic management systems in response to rising urban congestion and safety concerns.
- 2021: Major advancements in V2X communication technology paving the way for enhanced vehicle-to-infrastructure safety.
- 2022: Several key mergers and acquisitions in the ITS sector, consolidating market players and fostering technological integration.
- 2023: Rollout of advanced predictive analytics models for accident forecasting in pilot smart city projects.
- 2024: Enhanced focus on cybersecurity measures for traffic management systems due to growing data sensitivity.
In-Depth Traffic Accident Management System Market Outlook
The future outlook for the Traffic Accident Management System market is exceptionally promising, fueled by ongoing technological innovation and a persistent global drive towards safer, more efficient transportation networks. Growth accelerators such as the maturation of AI and IoT technologies, coupled with substantial government investments in smart city infrastructure, will continue to propel market expansion. Strategic partnerships and market expansion into developing economies are poised to unlock new revenue streams. The increasing demand for data-driven insights and predictive capabilities in transportation management will further solidify the market's trajectory, positioning TAMS as an indispensable component of modern urban and rural mobility. The market is expected to witness continued innovation in areas like autonomous vehicle integration and enhanced cybersecurity measures, ensuring its relevance and growth for the foreseeable future.
Traffic Accident Management System Segmentation
-
1. Application
- 1.1. Municipal
- 1.2. State
- 1.3. Federal
-
2. Types
- 2.1. Software
- 2.2. Services
Traffic Accident Management System Segmentation By Geography
-
1. North America
- 1.1. United States
- 1.2. Canada
- 1.3. Mexico
-
2. South America
- 2.1. Brazil
- 2.2. Argentina
- 2.3. Rest of South America
-
3. Europe
- 3.1. United Kingdom
- 3.2. Germany
- 3.3. France
- 3.4. Italy
- 3.5. Spain
- 3.6. Russia
- 3.7. Benelux
- 3.8. Nordics
- 3.9. Rest of Europe
-
4. Middle East & Africa
- 4.1. Turkey
- 4.2. Israel
- 4.3. GCC
- 4.4. North Africa
- 4.5. South Africa
- 4.6. Rest of Middle East & Africa
-
5. Asia Pacific
- 5.1. China
- 5.2. India
- 5.3. Japan
- 5.4. South Korea
- 5.5. ASEAN
- 5.6. Oceania
- 5.7. Rest of Asia Pacific
Traffic Accident Management System Regional Market Share
Geographic Coverage of Traffic Accident Management System
Traffic Accident Management System REPORT HIGHLIGHTS
| Aspects | Details |
|---|---|
| Study Period | 2020-2034 |
| Base Year | 2025 |
| Estimated Year | 2026 |
| Forecast Period | 2026-2034 |
| Historical Period | 2020-2025 |
| Growth Rate | CAGR of 11.7% from 2020-2034 |
| Segmentation |
|
Table of Contents
- 1. Introduction
- 1.1. Research Scope
- 1.2. Market Segmentation
- 1.3. Research Methodology
- 1.4. Definitions and Assumptions
- 2. Executive Summary
- 2.1. Introduction
- 3. Market Dynamics
- 3.1. Introduction
- 3.2. Market Drivers
- 3.3. Market Restrains
- 3.4. Market Trends
- 4. Market Factor Analysis
- 4.1. Porters Five Forces
- 4.2. Supply/Value Chain
- 4.3. PESTEL analysis
- 4.4. Market Entropy
- 4.5. Patent/Trademark Analysis
- 5. Global Traffic Accident Management System Analysis, Insights and Forecast, 2020-2032
- 5.1. Market Analysis, Insights and Forecast - by Application
- 5.1.1. Municipal
- 5.1.2. State
- 5.1.3. Federal
- 5.2. Market Analysis, Insights and Forecast - by Types
- 5.2.1. Software
- 5.2.2. Services
- 5.3. Market Analysis, Insights and Forecast - by Region
- 5.3.1. North America
- 5.3.2. South America
- 5.3.3. Europe
- 5.3.4. Middle East & Africa
- 5.3.5. Asia Pacific
- 5.1. Market Analysis, Insights and Forecast - by Application
- 6. North America Traffic Accident Management System Analysis, Insights and Forecast, 2020-2032
- 6.1. Market Analysis, Insights and Forecast - by Application
- 6.1.1. Municipal
- 6.1.2. State
- 6.1.3. Federal
- 6.2. Market Analysis, Insights and Forecast - by Types
- 6.2.1. Software
- 6.2.2. Services
- 6.1. Market Analysis, Insights and Forecast - by Application
- 7. South America Traffic Accident Management System Analysis, Insights and Forecast, 2020-2032
- 7.1. Market Analysis, Insights and Forecast - by Application
- 7.1.1. Municipal
- 7.1.2. State
- 7.1.3. Federal
- 7.2. Market Analysis, Insights and Forecast - by Types
- 7.2.1. Software
- 7.2.2. Services
- 7.1. Market Analysis, Insights and Forecast - by Application
- 8. Europe Traffic Accident Management System Analysis, Insights and Forecast, 2020-2032
- 8.1. Market Analysis, Insights and Forecast - by Application
- 8.1.1. Municipal
- 8.1.2. State
- 8.1.3. Federal
- 8.2. Market Analysis, Insights and Forecast - by Types
- 8.2.1. Software
- 8.2.2. Services
- 8.1. Market Analysis, Insights and Forecast - by Application
- 9. Middle East & Africa Traffic Accident Management System Analysis, Insights and Forecast, 2020-2032
- 9.1. Market Analysis, Insights and Forecast - by Application
- 9.1.1. Municipal
- 9.1.2. State
- 9.1.3. Federal
- 9.2. Market Analysis, Insights and Forecast - by Types
- 9.2.1. Software
- 9.2.2. Services
- 9.1. Market Analysis, Insights and Forecast - by Application
- 10. Asia Pacific Traffic Accident Management System Analysis, Insights and Forecast, 2020-2032
- 10.1. Market Analysis, Insights and Forecast - by Application
- 10.1.1. Municipal
- 10.1.2. State
- 10.1.3. Federal
- 10.2. Market Analysis, Insights and Forecast - by Types
- 10.2.1. Software
- 10.2.2. Services
- 10.1. Market Analysis, Insights and Forecast - by Application
- 11. Competitive Analysis
- 11.1. Global Market Share Analysis 2025
- 11.2. Company Profiles
- 11.2.1 Kyosan Electric Manufacturing Co
- 11.2.1.1. Overview
- 11.2.1.2. Products
- 11.2.1.3. SWOT Analysis
- 11.2.1.4. Recent Developments
- 11.2.1.5. Financials (Based on Availability)
- 11.2.2 Ltd.
- 11.2.2.1. Overview
- 11.2.2.2. Products
- 11.2.2.3. SWOT Analysis
- 11.2.2.4. Recent Developments
- 11.2.2.5. Financials (Based on Availability)
- 11.2.3 Advantech Co.
- 11.2.3.1. Overview
- 11.2.3.2. Products
- 11.2.3.3. SWOT Analysis
- 11.2.3.4. Recent Developments
- 11.2.3.5. Financials (Based on Availability)
- 11.2.4 Ltd.
- 11.2.4.1. Overview
- 11.2.4.2. Products
- 11.2.4.3. SWOT Analysis
- 11.2.4.4. Recent Developments
- 11.2.4.5. Financials (Based on Availability)
- 11.2.5 Siemens
- 11.2.5.1. Overview
- 11.2.5.2. Products
- 11.2.5.3. SWOT Analysis
- 11.2.5.4. Recent Developments
- 11.2.5.5. Financials (Based on Availability)
- 11.2.6 Cubic Corporation
- 11.2.6.1. Overview
- 11.2.6.2. Products
- 11.2.6.3. SWOT Analysis
- 11.2.6.4. Recent Developments
- 11.2.6.5. Financials (Based on Availability)
- 11.2.7 KapschTrafficCom AG
- 11.2.7.1. Overview
- 11.2.7.2. Products
- 11.2.7.3. SWOT Analysis
- 11.2.7.4. Recent Developments
- 11.2.7.5. Financials (Based on Availability)
- 11.2.8 Q-Free ASA
- 11.2.8.1. Overview
- 11.2.8.2. Products
- 11.2.8.3. SWOT Analysis
- 11.2.8.4. Recent Developments
- 11.2.8.5. Financials (Based on Availability)
- 11.2.9 TransCore
- 11.2.9.1. Overview
- 11.2.9.2. Products
- 11.2.9.3. SWOT Analysis
- 11.2.9.4. Recent Developments
- 11.2.9.5. Financials (Based on Availability)
- 11.2.10 SNC-Lavalin Group
- 11.2.10.1. Overview
- 11.2.10.2. Products
- 11.2.10.3. SWOT Analysis
- 11.2.10.4. Recent Developments
- 11.2.10.5. Financials (Based on Availability)
- 11.2.11 Flir Systems Inc
- 11.2.11.1. Overview
- 11.2.11.2. Products
- 11.2.11.3. SWOT Analysis
- 11.2.11.4. Recent Developments
- 11.2.11.5. Financials (Based on Availability)
- 11.2.12 Cisco Systems Inc
- 11.2.12.1. Overview
- 11.2.12.2. Products
- 11.2.12.3. SWOT Analysis
- 11.2.12.4. Recent Developments
- 11.2.12.5. Financials (Based on Availability)
- 11.2.13 Jenoptik Ag
- 11.2.13.1. Overview
- 11.2.13.2. Products
- 11.2.13.3. SWOT Analysis
- 11.2.13.4. Recent Developments
- 11.2.13.5. Financials (Based on Availability)
- 11.2.14 EFKON Ag
- 11.2.14.1. Overview
- 11.2.14.2. Products
- 11.2.14.3. SWOT Analysis
- 11.2.14.4. Recent Developments
- 11.2.14.5. Financials (Based on Availability)
- 11.2.15 SavariInc
- 11.2.15.1. Overview
- 11.2.15.2. Products
- 11.2.15.3. SWOT Analysis
- 11.2.15.4. Recent Developments
- 11.2.15.5. Financials (Based on Availability)
- 11.2.16 Swarco Ag
- 11.2.16.1. Overview
- 11.2.16.2. Products
- 11.2.16.3. SWOT Analysis
- 11.2.16.4. Recent Developments
- 11.2.16.5. Financials (Based on Availability)
- 11.2.17 Atkins Group
- 11.2.17.1. Overview
- 11.2.17.2. Products
- 11.2.17.3. SWOT Analysis
- 11.2.17.4. Recent Developments
- 11.2.17.5. Financials (Based on Availability)
- 11.2.1 Kyosan Electric Manufacturing Co
List of Figures
- Figure 1: Global Traffic Accident Management System Revenue Breakdown (undefined, %) by Region 2025 & 2033
- Figure 2: North America Traffic Accident Management System Revenue (undefined), by Application 2025 & 2033
- Figure 3: North America Traffic Accident Management System Revenue Share (%), by Application 2025 & 2033
- Figure 4: North America Traffic Accident Management System Revenue (undefined), by Types 2025 & 2033
- Figure 5: North America Traffic Accident Management System Revenue Share (%), by Types 2025 & 2033
- Figure 6: North America Traffic Accident Management System Revenue (undefined), by Country 2025 & 2033
- Figure 7: North America Traffic Accident Management System Revenue Share (%), by Country 2025 & 2033
- Figure 8: South America Traffic Accident Management System Revenue (undefined), by Application 2025 & 2033
- Figure 9: South America Traffic Accident Management System Revenue Share (%), by Application 2025 & 2033
- Figure 10: South America Traffic Accident Management System Revenue (undefined), by Types 2025 & 2033
- Figure 11: South America Traffic Accident Management System Revenue Share (%), by Types 2025 & 2033
- Figure 12: South America Traffic Accident Management System Revenue (undefined), by Country 2025 & 2033
- Figure 13: South America Traffic Accident Management System Revenue Share (%), by Country 2025 & 2033
- Figure 14: Europe Traffic Accident Management System Revenue (undefined), by Application 2025 & 2033
- Figure 15: Europe Traffic Accident Management System Revenue Share (%), by Application 2025 & 2033
- Figure 16: Europe Traffic Accident Management System Revenue (undefined), by Types 2025 & 2033
- Figure 17: Europe Traffic Accident Management System Revenue Share (%), by Types 2025 & 2033
- Figure 18: Europe Traffic Accident Management System Revenue (undefined), by Country 2025 & 2033
- Figure 19: Europe Traffic Accident Management System Revenue Share (%), by Country 2025 & 2033
- Figure 20: Middle East & Africa Traffic Accident Management System Revenue (undefined), by Application 2025 & 2033
- Figure 21: Middle East & Africa Traffic Accident Management System Revenue Share (%), by Application 2025 & 2033
- Figure 22: Middle East & Africa Traffic Accident Management System Revenue (undefined), by Types 2025 & 2033
- Figure 23: Middle East & Africa Traffic Accident Management System Revenue Share (%), by Types 2025 & 2033
- Figure 24: Middle East & Africa Traffic Accident Management System Revenue (undefined), by Country 2025 & 2033
- Figure 25: Middle East & Africa Traffic Accident Management System Revenue Share (%), by Country 2025 & 2033
- Figure 26: Asia Pacific Traffic Accident Management System Revenue (undefined), by Application 2025 & 2033
- Figure 27: Asia Pacific Traffic Accident Management System Revenue Share (%), by Application 2025 & 2033
- Figure 28: Asia Pacific Traffic Accident Management System Revenue (undefined), by Types 2025 & 2033
- Figure 29: Asia Pacific Traffic Accident Management System Revenue Share (%), by Types 2025 & 2033
- Figure 30: Asia Pacific Traffic Accident Management System Revenue (undefined), by Country 2025 & 2033
- Figure 31: Asia Pacific Traffic Accident Management System Revenue Share (%), by Country 2025 & 2033
List of Tables
- Table 1: Global Traffic Accident Management System Revenue undefined Forecast, by Application 2020 & 2033
- Table 2: Global Traffic Accident Management System Revenue undefined Forecast, by Types 2020 & 2033
- Table 3: Global Traffic Accident Management System Revenue undefined Forecast, by Region 2020 & 2033
- Table 4: Global Traffic Accident Management System Revenue undefined Forecast, by Application 2020 & 2033
- Table 5: Global Traffic Accident Management System Revenue undefined Forecast, by Types 2020 & 2033
- Table 6: Global Traffic Accident Management System Revenue undefined Forecast, by Country 2020 & 2033
- Table 7: United States Traffic Accident Management System Revenue (undefined) Forecast, by Application 2020 & 2033
- Table 8: Canada Traffic Accident Management System Revenue (undefined) Forecast, by Application 2020 & 2033
- Table 9: Mexico Traffic Accident Management System Revenue (undefined) Forecast, by Application 2020 & 2033
- Table 10: Global Traffic Accident Management System Revenue undefined Forecast, by Application 2020 & 2033
- Table 11: Global Traffic Accident Management System Revenue undefined Forecast, by Types 2020 & 2033
- Table 12: Global Traffic Accident Management System Revenue undefined Forecast, by Country 2020 & 2033
- Table 13: Brazil Traffic Accident Management System Revenue (undefined) Forecast, by Application 2020 & 2033
- Table 14: Argentina Traffic Accident Management System Revenue (undefined) Forecast, by Application 2020 & 2033
- Table 15: Rest of South America Traffic Accident Management System Revenue (undefined) Forecast, by Application 2020 & 2033
- Table 16: Global Traffic Accident Management System Revenue undefined Forecast, by Application 2020 & 2033
- Table 17: Global Traffic Accident Management System Revenue undefined Forecast, by Types 2020 & 2033
- Table 18: Global Traffic Accident Management System Revenue undefined Forecast, by Country 2020 & 2033
- Table 19: United Kingdom Traffic Accident Management System Revenue (undefined) Forecast, by Application 2020 & 2033
- Table 20: Germany Traffic Accident Management System Revenue (undefined) Forecast, by Application 2020 & 2033
- Table 21: France Traffic Accident Management System Revenue (undefined) Forecast, by Application 2020 & 2033
- Table 22: Italy Traffic Accident Management System Revenue (undefined) Forecast, by Application 2020 & 2033
- Table 23: Spain Traffic Accident Management System Revenue (undefined) Forecast, by Application 2020 & 2033
- Table 24: Russia Traffic Accident Management System Revenue (undefined) Forecast, by Application 2020 & 2033
- Table 25: Benelux Traffic Accident Management System Revenue (undefined) Forecast, by Application 2020 & 2033
- Table 26: Nordics Traffic Accident Management System Revenue (undefined) Forecast, by Application 2020 & 2033
- Table 27: Rest of Europe Traffic Accident Management System Revenue (undefined) Forecast, by Application 2020 & 2033
- Table 28: Global Traffic Accident Management System Revenue undefined Forecast, by Application 2020 & 2033
- Table 29: Global Traffic Accident Management System Revenue undefined Forecast, by Types 2020 & 2033
- Table 30: Global Traffic Accident Management System Revenue undefined Forecast, by Country 2020 & 2033
- Table 31: Turkey Traffic Accident Management System Revenue (undefined) Forecast, by Application 2020 & 2033
- Table 32: Israel Traffic Accident Management System Revenue (undefined) Forecast, by Application 2020 & 2033
- Table 33: GCC Traffic Accident Management System Revenue (undefined) Forecast, by Application 2020 & 2033
- Table 34: North Africa Traffic Accident Management System Revenue (undefined) Forecast, by Application 2020 & 2033
- Table 35: South Africa Traffic Accident Management System Revenue (undefined) Forecast, by Application 2020 & 2033
- Table 36: Rest of Middle East & Africa Traffic Accident Management System Revenue (undefined) Forecast, by Application 2020 & 2033
- Table 37: Global Traffic Accident Management System Revenue undefined Forecast, by Application 2020 & 2033
- Table 38: Global Traffic Accident Management System Revenue undefined Forecast, by Types 2020 & 2033
- Table 39: Global Traffic Accident Management System Revenue undefined Forecast, by Country 2020 & 2033
- Table 40: China Traffic Accident Management System Revenue (undefined) Forecast, by Application 2020 & 2033
- Table 41: India Traffic Accident Management System Revenue (undefined) Forecast, by Application 2020 & 2033
- Table 42: Japan Traffic Accident Management System Revenue (undefined) Forecast, by Application 2020 & 2033
- Table 43: South Korea Traffic Accident Management System Revenue (undefined) Forecast, by Application 2020 & 2033
- Table 44: ASEAN Traffic Accident Management System Revenue (undefined) Forecast, by Application 2020 & 2033
- Table 45: Oceania Traffic Accident Management System Revenue (undefined) Forecast, by Application 2020 & 2033
- Table 46: Rest of Asia Pacific Traffic Accident Management System Revenue (undefined) Forecast, by Application 2020 & 2033
Frequently Asked Questions
1. What is the projected Compound Annual Growth Rate (CAGR) of the Traffic Accident Management System?
The projected CAGR is approximately 11.7%.
2. Which companies are prominent players in the Traffic Accident Management System?
Key companies in the market include Kyosan Electric Manufacturing Co, Ltd., Advantech Co., Ltd., Siemens, Cubic Corporation, KapschTrafficCom AG, Q-Free ASA, TransCore, SNC-Lavalin Group, Flir Systems Inc, Cisco Systems Inc, Jenoptik Ag, EFKON Ag, SavariInc, Swarco Ag, Atkins Group.
3. What are the main segments of the Traffic Accident Management System?
The market segments include Application, Types.
4. Can you provide details about the market size?
The market size is estimated to be USD XXX N/A as of 2022.
5. What are some drivers contributing to market growth?
N/A
6. What are the notable trends driving market growth?
N/A
7. Are there any restraints impacting market growth?
N/A
8. Can you provide examples of recent developments in the market?
N/A
9. What pricing options are available for accessing the report?
Pricing options include single-user, multi-user, and enterprise licenses priced at USD 4900.00, USD 7350.00, and USD 9800.00 respectively.
10. Is the market size provided in terms of value or volume?
The market size is provided in terms of value, measured in N/A.
11. Are there any specific market keywords associated with the report?
Yes, the market keyword associated with the report is "Traffic Accident Management System," which aids in identifying and referencing the specific market segment covered.
12. How do I determine which pricing option suits my needs best?
The pricing options vary based on user requirements and access needs. Individual users may opt for single-user licenses, while businesses requiring broader access may choose multi-user or enterprise licenses for cost-effective access to the report.
13. Are there any additional resources or data provided in the Traffic Accident Management System report?
While the report offers comprehensive insights, it's advisable to review the specific contents or supplementary materials provided to ascertain if additional resources or data are available.
14. How can I stay updated on further developments or reports in the Traffic Accident Management System?
To stay informed about further developments, trends, and reports in the Traffic Accident Management System, consider subscribing to industry newsletters, following relevant companies and organizations, or regularly checking reputable industry news sources and publications.
Methodology
Step 1 - Identification of Relevant Samples Size from Population Database


Step 2 - Approaches for Defining Global Market Size (Value, Volume* & Price*)

Note*: In applicable scenarios
Step 3 - Data Sources
Primary Research
- Web Analytics
- Survey Reports
- Research Institute
- Latest Research Reports
- Opinion Leaders
Secondary Research
- Annual Reports
- White Paper
- Latest Press Release
- Industry Association
- Paid Database
- Investor Presentations

Step 4 - Data Triangulation
Involves using different sources of information in order to increase the validity of a study
These sources are likely to be stakeholders in a program - participants, other researchers, program staff, other community members, and so on.
Then we put all data in single framework & apply various statistical tools to find out the dynamic on the market.
During the analysis stage, feedback from the stakeholder groups would be compared to determine areas of agreement as well as areas of divergence