

Key Insights
The United States insurance brokerage market, valued at $67.89 billion in 2025, is projected to experience steady growth, driven by several key factors. The increasing complexity of insurance products and the rising demand for specialized risk management solutions are fueling the need for professional brokerage services. Furthermore, the expanding adoption of technology, particularly in areas like Insurtech and digital platforms, is streamlining operations and enhancing client experiences, thereby boosting market expansion. Consolidation within the industry, through mergers and acquisitions, is another significant driver, leading to larger, more diversified brokerage firms capable of offering a wider range of services and improved economies of scale. While regulatory changes and economic fluctuations pose potential restraints, the overall market outlook remains positive, supported by consistent demand from both individual and corporate clients.
The market segmentation reveals a robust presence across both insurance types (Life Insurance and Property & Casualty Insurance) and brokerage types (Retail and Wholesale Brokerage). Life insurance brokerage continues to be a substantial segment, driven by the growing awareness of long-term financial security needs. Simultaneously, the Property & Casualty insurance segment is experiencing growth fueled by increasing property values and concerns surrounding natural disasters and liability risks. Retail brokerages cater to individual clients, while wholesale brokerages serve larger commercial clients, demonstrating the diverse nature of the US insurance brokerage landscape. Major players like USI Insurance Services, Willis Towers Watson, Brown & Brown, and Aon PLC are actively shaping the market's trajectory through strategic initiatives, technological advancements, and acquisitions. The forecast period of 2025-2033 anticipates continued expansion, with a projected CAGR of 3.96%, indicating a strong and sustained growth trajectory for the US insurance brokerage market.
United States Insurance Brokerage Market: A Comprehensive Market Report (2019-2033)
This comprehensive report provides an in-depth analysis of the United States insurance brokerage market, encompassing its current state, growth trajectory, and future potential. The report covers the period from 2019 to 2033, with a focus on the base year 2025 and a forecast period spanning 2025-2033. It segments the market by insurance type (Life Insurance, Property & Casualty Insurance) and brokerage type (Retail Brokerage, Wholesale Brokerage), providing granular insights into market dynamics and key players. This detailed analysis is invaluable for investors, industry professionals, and strategic decision-makers seeking a thorough understanding of this dynamic market.

United States Insurance Brokerage Market Dynamics & Structure
The US insurance brokerage market is characterized by a moderately concentrated structure, with a few large players holding significant market share. However, a considerable number of smaller, regional brokers also contribute significantly. The market is driven by technological advancements, particularly in areas like data analytics and Insurtech solutions, which are transforming the way insurance is distributed and managed. Regulatory changes, both at the federal and state levels, play a crucial role in shaping market practices and opportunities. The presence of competitive substitute products, such as direct-to-consumer insurance platforms, poses a challenge to traditional brokerage models. End-user demographics are shifting, with increasing demand for specialized insurance products tailored to specific needs, driving market segmentation. Furthermore, mergers and acquisitions (M&A) activity remains prevalent, particularly among larger players seeking to expand their market presence and service offerings. The total M&A deal volume between 2019 and 2024 was estimated at xx Million, with an average deal size of xx Million.
- Market Concentration: Moderately concentrated, with top 5 players holding approximately xx% market share in 2024.
- Technological Innovation: Strong driver, particularly in data analytics and Insurtech. Barriers include high initial investment costs and integration challenges.
- Regulatory Framework: Complex and varied across states, influencing operational costs and market access.
- Competitive Substitutes: Growth of direct-to-consumer platforms poses a competitive threat.
- End-User Demographics: Shifting demographics drive demand for specialized insurance products.
- M&A Trends: High activity among larger players seeking expansion and diversification.
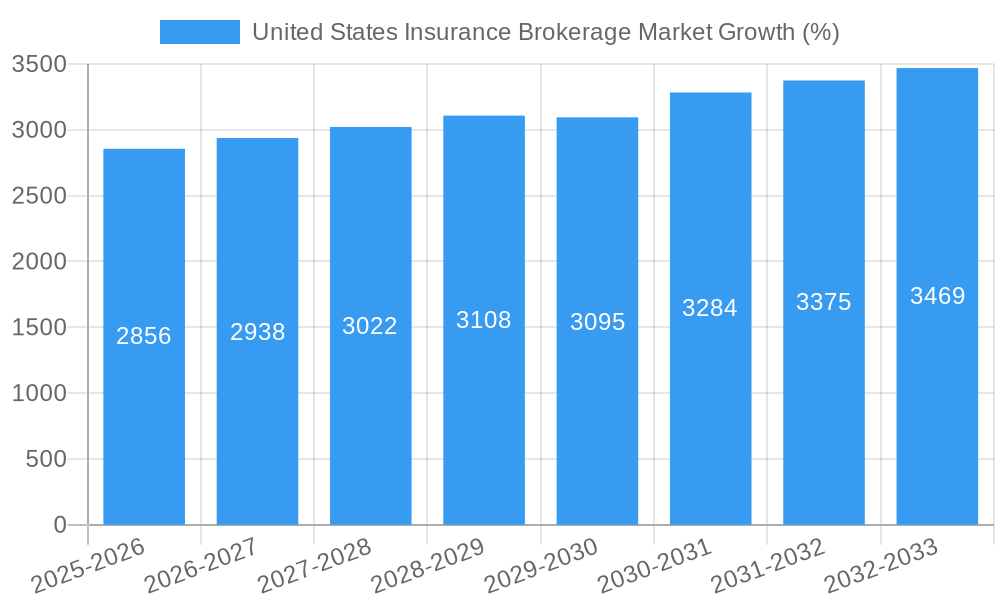
United States Insurance Brokerage Market Growth Trends & Insights
The US insurance brokerage market experienced steady growth during the historical period (2019-2024). Driven by factors such as increased insurance penetration, economic growth, and the adoption of advanced technologies, the market size expanded from xx Million in 2019 to an estimated xx Million in 2024, exhibiting a Compound Annual Growth Rate (CAGR) of xx%. This growth trajectory is expected to continue throughout the forecast period (2025-2033), with a projected CAGR of xx%, reaching xx Million by 2033. Market penetration is currently at approximately xx%, with significant potential for further expansion, particularly in underserved segments. Technological disruptions, such as the rise of Insurtech companies and the increasing use of artificial intelligence (AI) and machine learning (ML) in insurance, are significantly impacting industry practices and consumer behavior. Consumers are increasingly demanding greater transparency, personalized solutions, and convenient online platforms for purchasing and managing their insurance policies. These changes necessitate brokers to adapt and incorporate technological innovations into their operations to remain competitive.
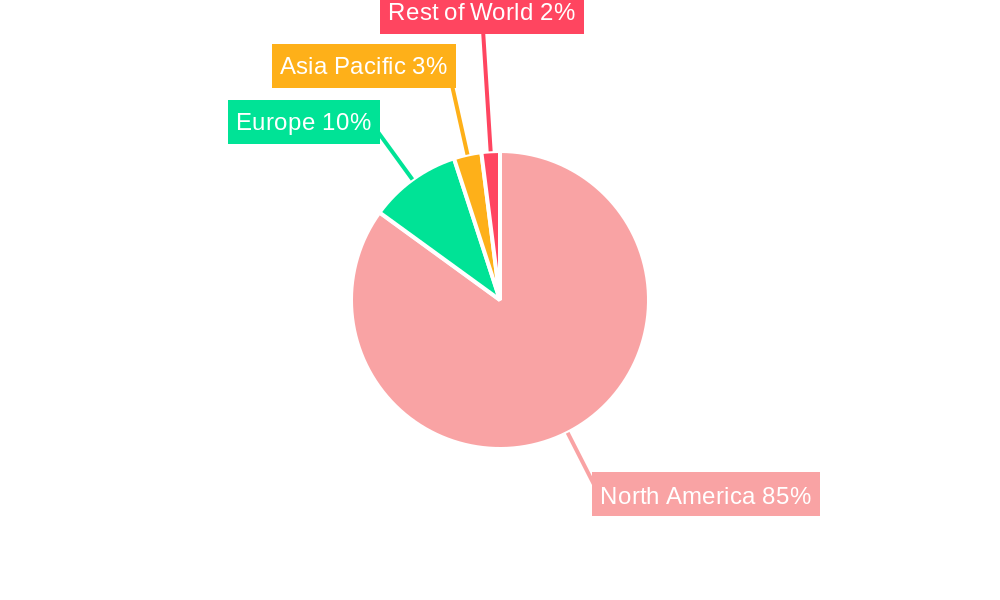
Dominant Regions, Countries, or Segments in United States Insurance Brokerage Market
The Property & Casualty Insurance segment dominates the US insurance brokerage market, accounting for approximately xx% of the total market value in 2024, primarily due to high demand across various sectors, including commercial and residential properties. The Retail Brokerage channel is also the leading channel, holding about xx% of market share. This is influenced by the wide presence of brick-and-mortar insurance agencies and the preference of many customers for personal interaction. California, New York, and Texas are among the leading states, owing to their large populations and robust economies.
- Key Drivers (Property & Casualty): High demand across various sectors, rising construction activity, and increased awareness of risk management.
- Key Drivers (Retail Brokerage): Preference for personal interaction, established distribution networks, and customer trust.
- Dominance Factors: Market size, economic growth, insurance penetration rates, and regulatory environment.
- Growth Potential: Significant potential in niche segments and underserved areas.
United States Insurance Brokerage Market Product Landscape
The US insurance brokerage market offers a diverse range of products and services tailored to specific client needs. Product innovation focuses on providing comprehensive risk management solutions, leveraging data analytics to provide tailored pricing and risk assessment, and integrating technology to streamline policy management and claims processing. Key performance indicators include customer satisfaction scores, policy retention rates, and the efficiency of operational processes. Innovative offerings include bundled insurance packages, specialized industry solutions, and digital platforms for online policy management. Unique selling propositions emphasize personalized service, expert advice, and access to a wide network of insurers.
Key Drivers, Barriers & Challenges in United States Insurance Brokerage Market
Key Drivers:
- Technological advancements such as AI and data analytics are enhancing efficiency and improving customer service.
- Increasing demand for specialized insurance products across various sectors.
- Economic growth and rising disposable incomes drive insurance penetration.
Key Challenges:
- Intense competition from established players and emerging Insurtech companies.
- Regulatory changes and compliance requirements impacting operational costs.
- Supply chain disruptions potentially impacting access to insurance products.
Emerging Opportunities in United States Insurance Brokerage Market
- Expanding into underserved markets (e.g., small businesses, rural communities).
- Leveraging Insurtech solutions to improve operational efficiency and customer experience.
- Developing personalized insurance solutions using data analytics and AI.
Growth Accelerators in the United States Insurance Brokerage Market Industry
Technological innovations, strategic partnerships, and market expansion strategies are key catalysts for long-term growth. The adoption of cloud computing, AI-powered risk assessment tools, and blockchain technology for secure data management are all accelerating the transformation of the industry. Strategic collaborations between insurance brokers and Insurtech firms are fostering innovation and expanding service offerings. Furthermore, geographical expansion into new markets and the development of specialized insurance products for emerging industries are creating significant growth opportunities.
Key Players Shaping the United States Insurance Brokerage Market Market
- USI Ins
- Willis Towers Watson Plc
- Brown & Brown Inc
- NFP Corp
- Amphenol Corporation
- Aon Plc
- Ameritrust Group Inc
- Arthur J Gallagher & Co
- Hub International Ltd
- Marsh & Mclennan Companies Inc
Notable Milestones in United States Insurance Brokerage Market Sector
- June 2023: Marsh McLennan Agency acquired SOLV Risk Solutions, LLC, expanding its presence in the Texas market.
- March 2022: Aon Plc acquired the actuarial software platform Tyche, enhancing its technological capabilities.
In-Depth United States Insurance Brokerage Market Market Outlook
The US insurance brokerage market is poised for continued growth, driven by technological advancements, evolving consumer preferences, and increasing demand for specialized insurance solutions. Strategic partnerships, market expansion initiatives, and the adoption of innovative technologies will be crucial for success in this dynamic market. The market's future potential is significant, with opportunities for both established players and emerging Insurtech firms to capture market share and drive innovation.
United States Insurance Brokerage Market Segmentation
-
1. Insurance Type
- 1.1. Life Insurance
- 1.2. Property & Casualty Insurance
-
2. Brokerage Type
- 2.1. Retail Brokerage
- 2.2. Wholesale Brokerage
United States Insurance Brokerage Market Segmentation By Geography
- 1. United States
United States Insurance Brokerage Market REPORT HIGHLIGHTS
| Aspects | Details |
|---|---|
| Study Period | 2019-2033 |
| Base Year | 2024 |
| Estimated Year | 2025 |
| Forecast Period | 2025-2033 |
| Historical Period | 2019-2024 |
| Growth Rate | CAGR of 3.96% from 2019-2033 |
| Segmentation |
|
Table of Contents
- 1. Introduction
- 1.1. Research Scope
- 1.2. Market Segmentation
- 1.3. Research Methodology
- 1.4. Definitions and Assumptions
- 2. Executive Summary
- 2.1. Introduction
- 3. Market Dynamics
- 3.1. Introduction
- 3.2. Market Drivers
- 3.2.1. Increasing Demand for Life Insurance is Driving the Market; Increasing Digital Adoption in the Insurance Industry is Driving the Market
- 3.3. Market Restrains
- 3.3.1. Increasing Cost Acts as a Restraint to the Market
- 3.4. Market Trends
- 3.4.1. Increasing Merger & Acquisition Deals in Insurance Brokerage Market
- 4. Market Factor Analysis
- 4.1. Porters Five Forces
- 4.2. Supply/Value Chain
- 4.3. PESTEL analysis
- 4.4. Market Entropy
- 4.5. Patent/Trademark Analysis
- 5. United States Insurance Brokerage Market Analysis, Insights and Forecast, 2019-2031
- 5.1. Market Analysis, Insights and Forecast - by Insurance Type
- 5.1.1. Life Insurance
- 5.1.2. Property & Casualty Insurance
- 5.2. Market Analysis, Insights and Forecast - by Brokerage Type
- 5.2.1. Retail Brokerage
- 5.2.2. Wholesale Brokerage
- 5.3. Market Analysis, Insights and Forecast - by Region
- 5.3.1. United States
- 5.1. Market Analysis, Insights and Forecast - by Insurance Type
- 6. Competitive Analysis
- 6.1. Market Share Analysis 2024
- 6.2. Company Profiles
- 6.2.1 USI Ins
- 6.2.1.1. Overview
- 6.2.1.2. Products
- 6.2.1.3. SWOT Analysis
- 6.2.1.4. Recent Developments
- 6.2.1.5. Financials (Based on Availability)
- 6.2.2 Willis Tower Watson Plc
- 6.2.2.1. Overview
- 6.2.2.2. Products
- 6.2.2.3. SWOT Analysis
- 6.2.2.4. Recent Developments
- 6.2.2.5. Financials (Based on Availability)
- 6.2.3 Brown & Brown Inc
- 6.2.3.1. Overview
- 6.2.3.2. Products
- 6.2.3.3. SWOT Analysis
- 6.2.3.4. Recent Developments
- 6.2.3.5. Financials (Based on Availability)
- 6.2.4 NFP Corp
- 6.2.4.1. Overview
- 6.2.4.2. Products
- 6.2.4.3. SWOT Analysis
- 6.2.4.4. Recent Developments
- 6.2.4.5. Financials (Based on Availability)
- 6.2.5 Amphenol Corporation
- 6.2.5.1. Overview
- 6.2.5.2. Products
- 6.2.5.3. SWOT Analysis
- 6.2.5.4. Recent Developments
- 6.2.5.5. Financials (Based on Availability)
- 6.2.6 Aon Plc
- 6.2.6.1. Overview
- 6.2.6.2. Products
- 6.2.6.3. SWOT Analysis
- 6.2.6.4. Recent Developments
- 6.2.6.5. Financials (Based on Availability)
- 6.2.7 Ameritrust Group Inc
- 6.2.7.1. Overview
- 6.2.7.2. Products
- 6.2.7.3. SWOT Analysis
- 6.2.7.4. Recent Developments
- 6.2.7.5. Financials (Based on Availability)
- 6.2.8 Arthur J Gallagher & Co
- 6.2.8.1. Overview
- 6.2.8.2. Products
- 6.2.8.3. SWOT Analysis
- 6.2.8.4. Recent Developments
- 6.2.8.5. Financials (Based on Availability)
- 6.2.9 Hub International Ltd
- 6.2.9.1. Overview
- 6.2.9.2. Products
- 6.2.9.3. SWOT Analysis
- 6.2.9.4. Recent Developments
- 6.2.9.5. Financials (Based on Availability)
- 6.2.10 Marsh & Mclennan Companies Inc
- 6.2.10.1. Overview
- 6.2.10.2. Products
- 6.2.10.3. SWOT Analysis
- 6.2.10.4. Recent Developments
- 6.2.10.5. Financials (Based on Availability)
- 6.2.1 USI Ins
List of Figures
- Figure 1: United States Insurance Brokerage Market Revenue Breakdown (Million, %) by Product 2024 & 2032
- Figure 2: United States Insurance Brokerage Market Share (%) by Company 2024
List of Tables
- Table 1: United States Insurance Brokerage Market Revenue Million Forecast, by Region 2019 & 2032
- Table 2: United States Insurance Brokerage Market Revenue Million Forecast, by Insurance Type 2019 & 2032
- Table 3: United States Insurance Brokerage Market Revenue Million Forecast, by Brokerage Type 2019 & 2032
- Table 4: United States Insurance Brokerage Market Revenue Million Forecast, by Region 2019 & 2032
- Table 5: United States Insurance Brokerage Market Revenue Million Forecast, by Country 2019 & 2032
- Table 6: United States Insurance Brokerage Market Revenue Million Forecast, by Insurance Type 2019 & 2032
- Table 7: United States Insurance Brokerage Market Revenue Million Forecast, by Brokerage Type 2019 & 2032
- Table 8: United States Insurance Brokerage Market Revenue Million Forecast, by Country 2019 & 2032
Frequently Asked Questions
1. What is the projected Compound Annual Growth Rate (CAGR) of the United States Insurance Brokerage Market?
The projected CAGR is approximately 3.96%.
2. Which companies are prominent players in the United States Insurance Brokerage Market?
Key companies in the market include USI Ins, Willis Tower Watson Plc, Brown & Brown Inc, NFP Corp, Amphenol Corporation, Aon Plc, Ameritrust Group Inc, Arthur J Gallagher & Co, Hub International Ltd, Marsh & Mclennan Companies Inc.
3. What are the main segments of the United States Insurance Brokerage Market?
The market segments include Insurance Type, Brokerage Type.
4. Can you provide details about the market size?
The market size is estimated to be USD 67.89 Million as of 2022.
5. What are some drivers contributing to market growth?
Increasing Demand for Life Insurance is Driving the Market; Increasing Digital Adoption in the Insurance Industry is Driving the Market.
6. What are the notable trends driving market growth?
Increasing Merger & Acquisition Deals in Insurance Brokerage Market.
7. Are there any restraints impacting market growth?
Increasing Cost Acts as a Restraint to the Market.
8. Can you provide examples of recent developments in the market?
June 2023: Marsh McLennan Agency, a subsidiary of Marsh, announced the acquisition of SOLV Risk Solutions, LLC, a leading independent agency based in Austin, Texas.
9. What pricing options are available for accessing the report?
Pricing options include single-user, multi-user, and enterprise licenses priced at USD 3800, USD 4500, and USD 5800 respectively.
10. Is the market size provided in terms of value or volume?
The market size is provided in terms of value, measured in Million.
11. Are there any specific market keywords associated with the report?
Yes, the market keyword associated with the report is "United States Insurance Brokerage Market," which aids in identifying and referencing the specific market segment covered.
12. How do I determine which pricing option suits my needs best?
The pricing options vary based on user requirements and access needs. Individual users may opt for single-user licenses, while businesses requiring broader access may choose multi-user or enterprise licenses for cost-effective access to the report.
13. Are there any additional resources or data provided in the United States Insurance Brokerage Market report?
While the report offers comprehensive insights, it's advisable to review the specific contents or supplementary materials provided to ascertain if additional resources or data are available.
14. How can I stay updated on further developments or reports in the United States Insurance Brokerage Market?
To stay informed about further developments, trends, and reports in the United States Insurance Brokerage Market, consider subscribing to industry newsletters, following relevant companies and organizations, or regularly checking reputable industry news sources and publications.
Methodology
Step 1 - Identification of Relevant Samples Size from Population Database


Step 2 - Approaches for Defining Global Market Size (Value, Volume* & Price*)

Note*: In applicable scenarios
Step 3 - Data Sources
Primary Research
- Web Analytics
- Survey Reports
- Research Institute
- Latest Research Reports
- Opinion Leaders
Secondary Research
- Annual Reports
- White Paper
- Latest Press Release
- Industry Association
- Paid Database
- Investor Presentations

Step 4 - Data Triangulation
Involves using different sources of information in order to increase the validity of a study
These sources are likely to be stakeholders in a program - participants, other researchers, program staff, other community members, and so on.
Then we put all data in single framework & apply various statistical tools to find out the dynamic on the market.
During the analysis stage, feedback from the stakeholder groups would be compared to determine areas of agreement as well as areas of divergence
