

Key Insights
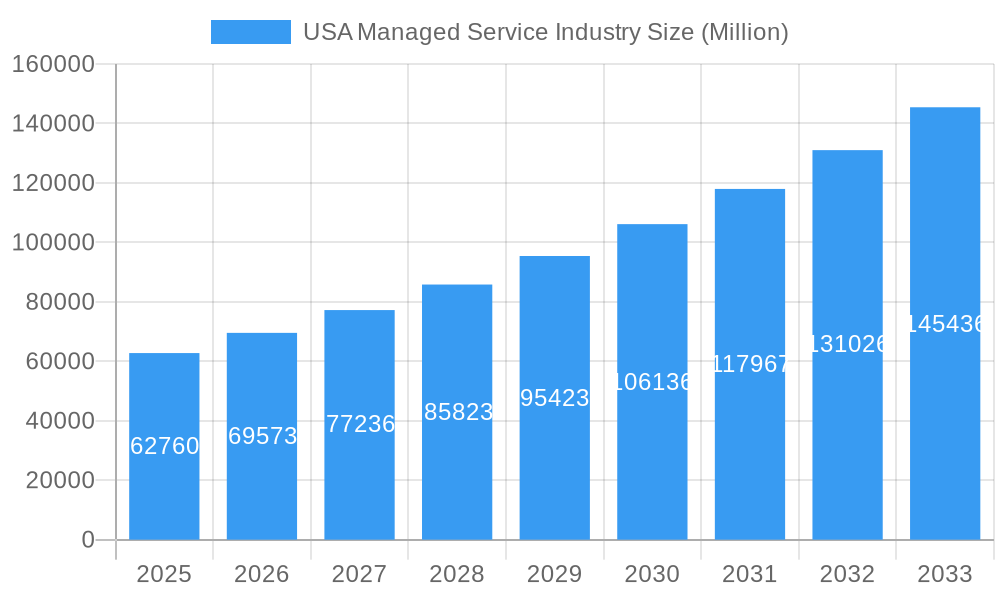
The US managed services market, valued at $62.76 billion in 2025, is experiencing robust growth, projected to maintain a Compound Annual Growth Rate (CAGR) of 10.82% from 2025 to 2033. This expansion is driven by several key factors. The increasing adoption of cloud computing necessitates robust managed services for security, infrastructure, and application management. Businesses, particularly large enterprises and those in sectors like BFSI (Banking, Financial Services, and Insurance), IT and Telecom, and Healthcare, are outsourcing IT operations to focus on core competencies and reduce operational costs. The rising complexity of IT infrastructure and the growing need for cybersecurity solutions further fuel market growth. Furthermore, the shift towards digital transformation initiatives and the adoption of advanced technologies like AI and IoT are creating new opportunities for managed service providers (MSPs). While the on-premise segment still holds a significant market share, the cloud-based segment is experiencing exponential growth, driven by scalability, cost-effectiveness, and accessibility advantages.
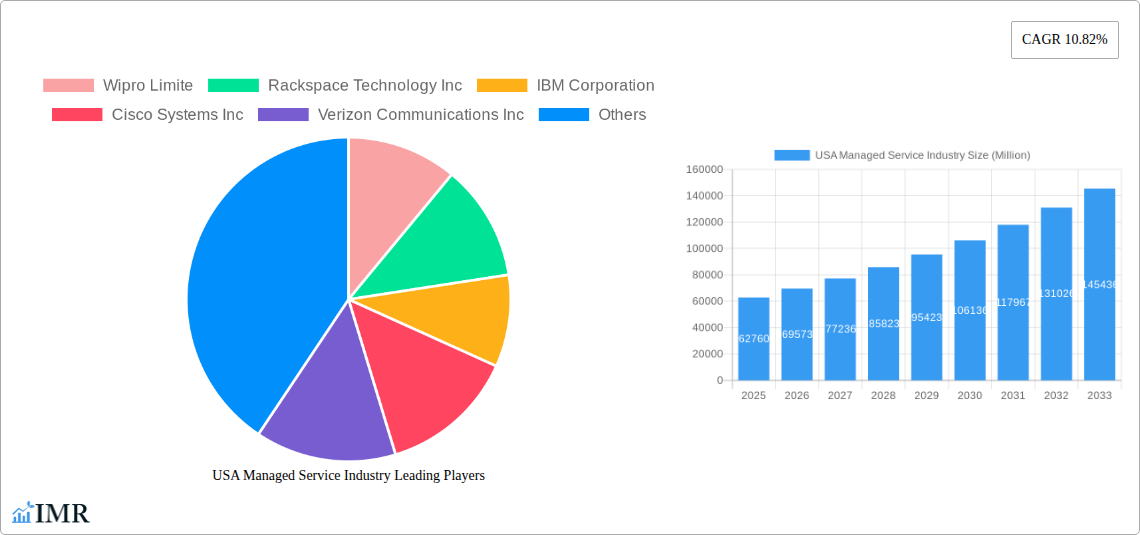
USA Managed Service Industry Market Size (In Billion)
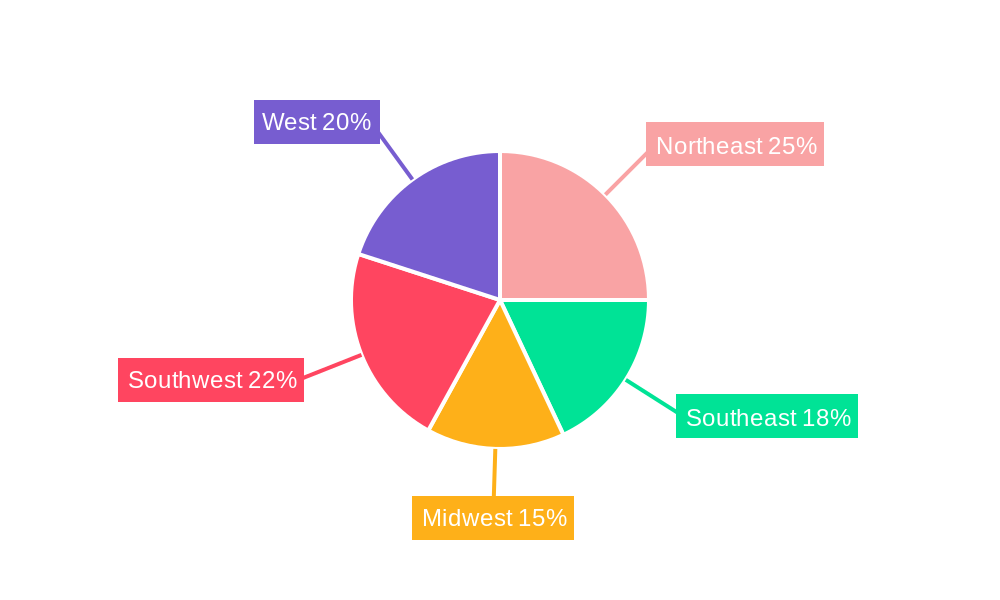
Regional variations within the US market are evident, with regions like the Northeast and West Coast showing higher adoption rates due to a greater concentration of large enterprises and technology hubs. However, growth is expected across all regions as businesses of all sizes recognize the benefits of managed services. Competitive pressures among established players like Wipro, Rackspace, IBM, Cisco, and emerging MSPs are driving innovation and fostering price competitiveness, benefiting end-users. Despite these positive trends, potential restraints include concerns about vendor lock-in, data security breaches, and the need for robust service level agreements (SLAs) to ensure service quality and reliability. Future growth will depend on the continued development of innovative managed services offerings tailored to evolving business needs and technological advancements.
USA Managed Service Industry Company Market Share
USA Managed Service Industry Market Report: 2019-2033
This comprehensive report provides a detailed analysis of the USA Managed Service Industry, encompassing market dynamics, growth trends, competitive landscape, and future outlook. The study period covers 2019-2033, with a base year of 2025 and a forecast period of 2025-2033. This report is essential for industry professionals, investors, and strategic decision-makers seeking a deep understanding of this rapidly evolving market.
USA Managed Service Industry Market Dynamics & Structure
The USA Managed Service market, valued at $xx million in 2024, is characterized by high competition and ongoing technological innovation. Market concentration is moderate, with several large players holding significant market share, while numerous smaller companies cater to niche segments. Regulatory frameworks, such as data privacy regulations (e.g., CCPA, HIPAA), significantly influence service offerings and security protocols. Cloud computing's rise presents both opportunities and challenges, acting as a competitive substitute for on-premise solutions while driving innovation in managed cloud services.
- Market Concentration: Moderate, with the top 5 players holding approximately 40% market share in 2024.
- Technological Innovation Drivers: Cloud computing, AI, automation, and cybersecurity advancements.
- Regulatory Frameworks: CCPA, HIPAA, and other data privacy laws impacting service delivery.
- Competitive Product Substitutes: In-house IT teams, open-source solutions.
- End-User Demographics: A mix of large enterprises and SMEs across diverse verticals.
- M&A Trends: A moderate number of M&A deals annually (xx deals in 2024), driven by expansion into new segments and technologies.
USA Managed Service Industry Growth Trends & Insights
The USA Managed Service market exhibits robust growth, driven by the increasing adoption of cloud computing, the growing need for enhanced cybersecurity, and the expanding digital transformation initiatives across various sectors. The market is expected to witness a CAGR of xx% during the forecast period (2025-2033), reaching $xx million by 2033. This growth is fueled by a rising preference for outsourcing IT operations to reduce costs and improve efficiency, alongside increasing demand for specialized managed services like managed security and managed cloud. The shift from on-premise to cloud-based solutions further accelerates this trend. Market penetration for cloud-based managed services is estimated at xx% in 2024 and projected to reach xx% by 2033. Technological disruptions, like the proliferation of IoT devices, demand for AI-driven security solutions, and the shift towards edge computing, are reshaping the industry's landscape, leading to further growth opportunities. Consumer behavior is shifting towards service-based models that prioritize flexibility, scalability, and reduced capital expenditure.
Dominant Regions, Countries, or Segments in USA Managed Service Industry
The leading segment within the USA Managed Services market is the Cloud deployment model, followed by Managed Security services. Geographically, the market is strongest in the Northeast and West Coast regions, driven by high tech industry concentration and large enterprise presence. Among end-user verticals, BFSI and IT and Telecom dominate, due to their critical reliance on robust and secure IT infrastructure.
- Key Drivers: Strong IT spending in key regions, increasing adoption of cloud solutions, heightened security concerns, and government initiatives.
- Large Enterprises: Driving growth due to higher spending capacity and complex IT needs.
- Cloud Deployment: Fastest-growing segment due to scalability, cost-effectiveness, and flexibility.
- Managed Security: High growth potential due to the increasing threat landscape.
- BFSI and IT & Telecom Verticals: Largest end-user segments due to high IT dependency.
USA Managed Service Industry Product Landscape
The USA Managed Service industry offers a wide array of products, ranging from basic infrastructure management to highly specialized services like AI-powered security and cloud-native application management. Key product innovations include AI-driven automation, enhanced security features, and integrated platforms that streamline service delivery. Products are differentiated by their unique selling propositions, such as service level agreements (SLAs), comprehensive monitoring capabilities, and proactive support offerings. Technological advancements are driving the development of more sophisticated and efficient solutions, further enhancing the value proposition for end-users.
Key Drivers, Barriers & Challenges in USA Managed Service Industry
Key Drivers: Increased digital transformation, growing reliance on cloud technologies, and heightened security concerns are major drivers. Government initiatives promoting digital infrastructure also play a role.
Key Challenges: Intense competition, security breaches, and the need for continuous skills development pose significant challenges. Supply chain disruptions and rising cybersecurity threats also impact the market. The estimated impact of these challenges on market growth in 2024 was a reduction of xx%.
Emerging Opportunities in USA Managed Service Industry
Emerging trends such as the adoption of edge computing, the growth of IoT, and the increasing demand for AI-driven solutions present significant opportunities. Untapped markets include smaller enterprises and specific industry verticals, offering potential for expansion and growth. Innovative applications of managed services in areas like healthcare and smart cities create substantial market potential.
Growth Accelerators in the USA Managed Service Industry Industry
Strategic partnerships, technological breakthroughs, and market expansion into new sectors (e.g., IoT and edge computing) are driving long-term growth. The development of innovative solutions that address evolving cybersecurity threats and enhance operational efficiency is paramount. Investments in R&D are fueling the creation of advanced managed services.
Key Players Shaping the USA Managed Service Industry Market
Notable Milestones in USA Managed Service Industry Sector
- October 2023: Rackspace Technology introduced Rackspace Managed Cloud (RMC), expanding its managed cloud offerings.
- August 2023: Verizon Business partnered with HCLTech for Managed Network Services (MNS), strengthening its enterprise networking capabilities.
In-Depth USA Managed Service Industry Market Outlook
The USA Managed Service market is poised for sustained growth driven by ongoing digital transformation and the increasing adoption of cloud-based solutions. Strategic partnerships, technological innovations, and expansion into emerging sectors will further accelerate this growth. The market presents significant opportunities for companies that can offer advanced, secure, and cost-effective managed services.
USA Managed Service Industry Segmentation
-
1. Deployment
- 1.1. On-premise
- 1.2. Cloud
-
2. Type
- 2.1. Managed Data Center
- 2.2. Managed Security
- 2.3. Managed Communications
- 2.4. Managed Network
- 2.5. Managed Infrastructure
- 2.6. Managed Mobility
-
3. Enterprise Size
- 3.1. Small and Medium Enterprises
- 3.2. Large Enterprises
-
4. End-user Vertical
- 4.1. BFSI
- 4.2. IT and Telecom
- 4.3. Healthcare
- 4.4. Entertainment and Media
- 4.5. Retail
- 4.6. Manufacturing
- 4.7. Government
- 4.8. Other End-user Verticals
USA Managed Service Industry Segmentation By Geography
-
1. North America
- 1.1. United States
- 1.2. Canada
- 1.3. Mexico
-
2. South America
- 2.1. Brazil
- 2.2. Argentina
- 2.3. Rest of South America
-
3. Europe
- 3.1. United Kingdom
- 3.2. Germany
- 3.3. France
- 3.4. Italy
- 3.5. Spain
- 3.6. Russia
- 3.7. Benelux
- 3.8. Nordics
- 3.9. Rest of Europe
-
4. Middle East & Africa
- 4.1. Turkey
- 4.2. Israel
- 4.3. GCC
- 4.4. North Africa
- 4.5. South Africa
- 4.6. Rest of Middle East & Africa
-
5. Asia Pacific
- 5.1. China
- 5.2. India
- 5.3. Japan
- 5.4. South Korea
- 5.5. ASEAN
- 5.6. Oceania
- 5.7. Rest of Asia Pacific
USA Managed Service Industry Regional Market Share
Geographic Coverage of USA Managed Service Industry
USA Managed Service Industry REPORT HIGHLIGHTS
| Aspects | Details |
|---|---|
| Study Period | 2020-2034 |
| Base Year | 2025 |
| Estimated Year | 2026 |
| Forecast Period | 2026-2034 |
| Historical Period | 2020-2025 |
| Growth Rate | CAGR of 10.82% from 2020-2034 |
| Segmentation |
|
Table of Contents
- 1. Introduction
- 1.1. Research Scope
- 1.2. Market Segmentation
- 1.3. Research Methodology
- 1.4. Definitions and Assumptions
- 2. Executive Summary
- 2.1. Introduction
- 3. Market Dynamics
- 3.1. Introduction
- 3.2. Market Drivers
- 3.2.1. Increasing Shift to Hybrid IT; Improved Cost and Operational Efficiency
- 3.3. Market Restrains
- 3.3.1 High Risk of Radiation Since it uses Gamma Rays
- 3.3.2 X-Rays; High Deployment Costs
- 3.4. Market Trends
- 3.4.1. Cloud to Witness Significant Growth
- 4. Market Factor Analysis
- 4.1. Porters Five Forces
- 4.2. Supply/Value Chain
- 4.3. PESTEL analysis
- 4.4. Market Entropy
- 4.5. Patent/Trademark Analysis
- 5. Global USA Managed Service Industry Analysis, Insights and Forecast, 2020-2032
- 5.1. Market Analysis, Insights and Forecast - by Deployment
- 5.1.1. On-premise
- 5.1.2. Cloud
- 5.2. Market Analysis, Insights and Forecast - by Type
- 5.2.1. Managed Data Center
- 5.2.2. Managed Security
- 5.2.3. Managed Communications
- 5.2.4. Managed Network
- 5.2.5. Managed Infrastructure
- 5.2.6. Managed Mobility
- 5.3. Market Analysis, Insights and Forecast - by Enterprise Size
- 5.3.1. Small and Medium Enterprises
- 5.3.2. Large Enterprises
- 5.4. Market Analysis, Insights and Forecast - by End-user Vertical
- 5.4.1. BFSI
- 5.4.2. IT and Telecom
- 5.4.3. Healthcare
- 5.4.4. Entertainment and Media
- 5.4.5. Retail
- 5.4.6. Manufacturing
- 5.4.7. Government
- 5.4.8. Other End-user Verticals
- 5.5. Market Analysis, Insights and Forecast - by Region
- 5.5.1. North America
- 5.5.2. South America
- 5.5.3. Europe
- 5.5.4. Middle East & Africa
- 5.5.5. Asia Pacific
- 5.1. Market Analysis, Insights and Forecast - by Deployment
- 6. North America USA Managed Service Industry Analysis, Insights and Forecast, 2020-2032
- 6.1. Market Analysis, Insights and Forecast - by Deployment
- 6.1.1. On-premise
- 6.1.2. Cloud
- 6.2. Market Analysis, Insights and Forecast - by Type
- 6.2.1. Managed Data Center
- 6.2.2. Managed Security
- 6.2.3. Managed Communications
- 6.2.4. Managed Network
- 6.2.5. Managed Infrastructure
- 6.2.6. Managed Mobility
- 6.3. Market Analysis, Insights and Forecast - by Enterprise Size
- 6.3.1. Small and Medium Enterprises
- 6.3.2. Large Enterprises
- 6.4. Market Analysis, Insights and Forecast - by End-user Vertical
- 6.4.1. BFSI
- 6.4.2. IT and Telecom
- 6.4.3. Healthcare
- 6.4.4. Entertainment and Media
- 6.4.5. Retail
- 6.4.6. Manufacturing
- 6.4.7. Government
- 6.4.8. Other End-user Verticals
- 6.1. Market Analysis, Insights and Forecast - by Deployment
- 7. South America USA Managed Service Industry Analysis, Insights and Forecast, 2020-2032
- 7.1. Market Analysis, Insights and Forecast - by Deployment
- 7.1.1. On-premise
- 7.1.2. Cloud
- 7.2. Market Analysis, Insights and Forecast - by Type
- 7.2.1. Managed Data Center
- 7.2.2. Managed Security
- 7.2.3. Managed Communications
- 7.2.4. Managed Network
- 7.2.5. Managed Infrastructure
- 7.2.6. Managed Mobility
- 7.3. Market Analysis, Insights and Forecast - by Enterprise Size
- 7.3.1. Small and Medium Enterprises
- 7.3.2. Large Enterprises
- 7.4. Market Analysis, Insights and Forecast - by End-user Vertical
- 7.4.1. BFSI
- 7.4.2. IT and Telecom
- 7.4.3. Healthcare
- 7.4.4. Entertainment and Media
- 7.4.5. Retail
- 7.4.6. Manufacturing
- 7.4.7. Government
- 7.4.8. Other End-user Verticals
- 7.1. Market Analysis, Insights and Forecast - by Deployment
- 8. Europe USA Managed Service Industry Analysis, Insights and Forecast, 2020-2032
- 8.1. Market Analysis, Insights and Forecast - by Deployment
- 8.1.1. On-premise
- 8.1.2. Cloud
- 8.2. Market Analysis, Insights and Forecast - by Type
- 8.2.1. Managed Data Center
- 8.2.2. Managed Security
- 8.2.3. Managed Communications
- 8.2.4. Managed Network
- 8.2.5. Managed Infrastructure
- 8.2.6. Managed Mobility
- 8.3. Market Analysis, Insights and Forecast - by Enterprise Size
- 8.3.1. Small and Medium Enterprises
- 8.3.2. Large Enterprises
- 8.4. Market Analysis, Insights and Forecast - by End-user Vertical
- 8.4.1. BFSI
- 8.4.2. IT and Telecom
- 8.4.3. Healthcare
- 8.4.4. Entertainment and Media
- 8.4.5. Retail
- 8.4.6. Manufacturing
- 8.4.7. Government
- 8.4.8. Other End-user Verticals
- 8.1. Market Analysis, Insights and Forecast - by Deployment
- 9. Middle East & Africa USA Managed Service Industry Analysis, Insights and Forecast, 2020-2032
- 9.1. Market Analysis, Insights and Forecast - by Deployment
- 9.1.1. On-premise
- 9.1.2. Cloud
- 9.2. Market Analysis, Insights and Forecast - by Type
- 9.2.1. Managed Data Center
- 9.2.2. Managed Security
- 9.2.3. Managed Communications
- 9.2.4. Managed Network
- 9.2.5. Managed Infrastructure
- 9.2.6. Managed Mobility
- 9.3. Market Analysis, Insights and Forecast - by Enterprise Size
- 9.3.1. Small and Medium Enterprises
- 9.3.2. Large Enterprises
- 9.4. Market Analysis, Insights and Forecast - by End-user Vertical
- 9.4.1. BFSI
- 9.4.2. IT and Telecom
- 9.4.3. Healthcare
- 9.4.4. Entertainment and Media
- 9.4.5. Retail
- 9.4.6. Manufacturing
- 9.4.7. Government
- 9.4.8. Other End-user Verticals
- 9.1. Market Analysis, Insights and Forecast - by Deployment
- 10. Asia Pacific USA Managed Service Industry Analysis, Insights and Forecast, 2020-2032
- 10.1. Market Analysis, Insights and Forecast - by Deployment
- 10.1.1. On-premise
- 10.1.2. Cloud
- 10.2. Market Analysis, Insights and Forecast - by Type
- 10.2.1. Managed Data Center
- 10.2.2. Managed Security
- 10.2.3. Managed Communications
- 10.2.4. Managed Network
- 10.2.5. Managed Infrastructure
- 10.2.6. Managed Mobility
- 10.3. Market Analysis, Insights and Forecast - by Enterprise Size
- 10.3.1. Small and Medium Enterprises
- 10.3.2. Large Enterprises
- 10.4. Market Analysis, Insights and Forecast - by End-user Vertical
- 10.4.1. BFSI
- 10.4.2. IT and Telecom
- 10.4.3. Healthcare
- 10.4.4. Entertainment and Media
- 10.4.5. Retail
- 10.4.6. Manufacturing
- 10.4.7. Government
- 10.4.8. Other End-user Verticals
- 10.1. Market Analysis, Insights and Forecast - by Deployment
- 11. Competitive Analysis
- 11.1. Global Market Share Analysis 2025
- 11.2. Company Profiles
- 11.2.1 Wipro Limite
- 11.2.1.1. Overview
- 11.2.1.2. Products
- 11.2.1.3. SWOT Analysis
- 11.2.1.4. Recent Developments
- 11.2.1.5. Financials (Based on Availability)
- 11.2.2 Rackspace Technology Inc
- 11.2.2.1. Overview
- 11.2.2.2. Products
- 11.2.2.3. SWOT Analysis
- 11.2.2.4. Recent Developments
- 11.2.2.5. Financials (Based on Availability)
- 11.2.3 IBM Corporation
- 11.2.3.1. Overview
- 11.2.3.2. Products
- 11.2.3.3. SWOT Analysis
- 11.2.3.4. Recent Developments
- 11.2.3.5. Financials (Based on Availability)
- 11.2.4 Cisco Systems Inc
- 11.2.4.1. Overview
- 11.2.4.2. Products
- 11.2.4.3. SWOT Analysis
- 11.2.4.4. Recent Developments
- 11.2.4.5. Financials (Based on Availability)
- 11.2.5 Verizon Communications Inc
- 11.2.5.1. Overview
- 11.2.5.2. Products
- 11.2.5.3. SWOT Analysis
- 11.2.5.4. Recent Developments
- 11.2.5.5. Financials (Based on Availability)
- 11.2.6 Microsoft Corporation
- 11.2.6.1. Overview
- 11.2.6.2. Products
- 11.2.6.3. SWOT Analysis
- 11.2.6.4. Recent Developments
- 11.2.6.5. Financials (Based on Availability)
- 11.2.7 HP Inc
- 11.2.7.1. Overview
- 11.2.7.2. Products
- 11.2.7.3. SWOT Analysis
- 11.2.7.4. Recent Developments
- 11.2.7.5. Financials (Based on Availability)
- 11.2.8 Fujitsu Limited
- 11.2.8.1. Overview
- 11.2.8.2. Products
- 11.2.8.3. SWOT Analysis
- 11.2.8.4. Recent Developments
- 11.2.8.5. Financials (Based on Availability)
- 11.2.9 Tata Consultancy Services Limited
- 11.2.9.1. Overview
- 11.2.9.2. Products
- 11.2.9.3. SWOT Analysis
- 11.2.9.4. Recent Developments
- 11.2.9.5. Financials (Based on Availability)
- 11.2.10 Dell Technologies Inc
- 11.2.10.1. Overview
- 11.2.10.2. Products
- 11.2.10.3. SWOT Analysis
- 11.2.10.4. Recent Developments
- 11.2.10.5. Financials (Based on Availability)
- 11.2.11 AT&T Inc
- 11.2.11.1. Overview
- 11.2.11.2. Products
- 11.2.11.3. SWOT Analysis
- 11.2.11.4. Recent Developments
- 11.2.11.5. Financials (Based on Availability)
- 11.2.12 Citrix Systems Inc
- 11.2.12.1. Overview
- 11.2.12.2. Products
- 11.2.12.3. SWOT Analysis
- 11.2.12.4. Recent Developments
- 11.2.12.5. Financials (Based on Availability)
- 11.2.1 Wipro Limite
List of Figures
- Figure 1: Global USA Managed Service Industry Revenue Breakdown (Million, %) by Region 2025 & 2033
- Figure 2: North America USA Managed Service Industry Revenue (Million), by Deployment 2025 & 2033
- Figure 3: North America USA Managed Service Industry Revenue Share (%), by Deployment 2025 & 2033
- Figure 4: North America USA Managed Service Industry Revenue (Million), by Type 2025 & 2033
- Figure 5: North America USA Managed Service Industry Revenue Share (%), by Type 2025 & 2033
- Figure 6: North America USA Managed Service Industry Revenue (Million), by Enterprise Size 2025 & 2033
- Figure 7: North America USA Managed Service Industry Revenue Share (%), by Enterprise Size 2025 & 2033
- Figure 8: North America USA Managed Service Industry Revenue (Million), by End-user Vertical 2025 & 2033
- Figure 9: North America USA Managed Service Industry Revenue Share (%), by End-user Vertical 2025 & 2033
- Figure 10: North America USA Managed Service Industry Revenue (Million), by Country 2025 & 2033
- Figure 11: North America USA Managed Service Industry Revenue Share (%), by Country 2025 & 2033
- Figure 12: South America USA Managed Service Industry Revenue (Million), by Deployment 2025 & 2033
- Figure 13: South America USA Managed Service Industry Revenue Share (%), by Deployment 2025 & 2033
- Figure 14: South America USA Managed Service Industry Revenue (Million), by Type 2025 & 2033
- Figure 15: South America USA Managed Service Industry Revenue Share (%), by Type 2025 & 2033
- Figure 16: South America USA Managed Service Industry Revenue (Million), by Enterprise Size 2025 & 2033
- Figure 17: South America USA Managed Service Industry Revenue Share (%), by Enterprise Size 2025 & 2033
- Figure 18: South America USA Managed Service Industry Revenue (Million), by End-user Vertical 2025 & 2033
- Figure 19: South America USA Managed Service Industry Revenue Share (%), by End-user Vertical 2025 & 2033
- Figure 20: South America USA Managed Service Industry Revenue (Million), by Country 2025 & 2033
- Figure 21: South America USA Managed Service Industry Revenue Share (%), by Country 2025 & 2033
- Figure 22: Europe USA Managed Service Industry Revenue (Million), by Deployment 2025 & 2033
- Figure 23: Europe USA Managed Service Industry Revenue Share (%), by Deployment 2025 & 2033
- Figure 24: Europe USA Managed Service Industry Revenue (Million), by Type 2025 & 2033
- Figure 25: Europe USA Managed Service Industry Revenue Share (%), by Type 2025 & 2033
- Figure 26: Europe USA Managed Service Industry Revenue (Million), by Enterprise Size 2025 & 2033
- Figure 27: Europe USA Managed Service Industry Revenue Share (%), by Enterprise Size 2025 & 2033
- Figure 28: Europe USA Managed Service Industry Revenue (Million), by End-user Vertical 2025 & 2033
- Figure 29: Europe USA Managed Service Industry Revenue Share (%), by End-user Vertical 2025 & 2033
- Figure 30: Europe USA Managed Service Industry Revenue (Million), by Country 2025 & 2033
- Figure 31: Europe USA Managed Service Industry Revenue Share (%), by Country 2025 & 2033
- Figure 32: Middle East & Africa USA Managed Service Industry Revenue (Million), by Deployment 2025 & 2033
- Figure 33: Middle East & Africa USA Managed Service Industry Revenue Share (%), by Deployment 2025 & 2033
- Figure 34: Middle East & Africa USA Managed Service Industry Revenue (Million), by Type 2025 & 2033
- Figure 35: Middle East & Africa USA Managed Service Industry Revenue Share (%), by Type 2025 & 2033
- Figure 36: Middle East & Africa USA Managed Service Industry Revenue (Million), by Enterprise Size 2025 & 2033
- Figure 37: Middle East & Africa USA Managed Service Industry Revenue Share (%), by Enterprise Size 2025 & 2033
- Figure 38: Middle East & Africa USA Managed Service Industry Revenue (Million), by End-user Vertical 2025 & 2033
- Figure 39: Middle East & Africa USA Managed Service Industry Revenue Share (%), by End-user Vertical 2025 & 2033
- Figure 40: Middle East & Africa USA Managed Service Industry Revenue (Million), by Country 2025 & 2033
- Figure 41: Middle East & Africa USA Managed Service Industry Revenue Share (%), by Country 2025 & 2033
- Figure 42: Asia Pacific USA Managed Service Industry Revenue (Million), by Deployment 2025 & 2033
- Figure 43: Asia Pacific USA Managed Service Industry Revenue Share (%), by Deployment 2025 & 2033
- Figure 44: Asia Pacific USA Managed Service Industry Revenue (Million), by Type 2025 & 2033
- Figure 45: Asia Pacific USA Managed Service Industry Revenue Share (%), by Type 2025 & 2033
- Figure 46: Asia Pacific USA Managed Service Industry Revenue (Million), by Enterprise Size 2025 & 2033
- Figure 47: Asia Pacific USA Managed Service Industry Revenue Share (%), by Enterprise Size 2025 & 2033
- Figure 48: Asia Pacific USA Managed Service Industry Revenue (Million), by End-user Vertical 2025 & 2033
- Figure 49: Asia Pacific USA Managed Service Industry Revenue Share (%), by End-user Vertical 2025 & 2033
- Figure 50: Asia Pacific USA Managed Service Industry Revenue (Million), by Country 2025 & 2033
- Figure 51: Asia Pacific USA Managed Service Industry Revenue Share (%), by Country 2025 & 2033
List of Tables
- Table 1: Global USA Managed Service Industry Revenue Million Forecast, by Deployment 2020 & 2033
- Table 2: Global USA Managed Service Industry Revenue Million Forecast, by Type 2020 & 2033
- Table 3: Global USA Managed Service Industry Revenue Million Forecast, by Enterprise Size 2020 & 2033
- Table 4: Global USA Managed Service Industry Revenue Million Forecast, by End-user Vertical 2020 & 2033
- Table 5: Global USA Managed Service Industry Revenue Million Forecast, by Region 2020 & 2033
- Table 6: Global USA Managed Service Industry Revenue Million Forecast, by Deployment 2020 & 2033
- Table 7: Global USA Managed Service Industry Revenue Million Forecast, by Type 2020 & 2033
- Table 8: Global USA Managed Service Industry Revenue Million Forecast, by Enterprise Size 2020 & 2033
- Table 9: Global USA Managed Service Industry Revenue Million Forecast, by End-user Vertical 2020 & 2033
- Table 10: Global USA Managed Service Industry Revenue Million Forecast, by Country 2020 & 2033
- Table 11: United States USA Managed Service Industry Revenue (Million) Forecast, by Application 2020 & 2033
- Table 12: Canada USA Managed Service Industry Revenue (Million) Forecast, by Application 2020 & 2033
- Table 13: Mexico USA Managed Service Industry Revenue (Million) Forecast, by Application 2020 & 2033
- Table 14: Global USA Managed Service Industry Revenue Million Forecast, by Deployment 2020 & 2033
- Table 15: Global USA Managed Service Industry Revenue Million Forecast, by Type 2020 & 2033
- Table 16: Global USA Managed Service Industry Revenue Million Forecast, by Enterprise Size 2020 & 2033
- Table 17: Global USA Managed Service Industry Revenue Million Forecast, by End-user Vertical 2020 & 2033
- Table 18: Global USA Managed Service Industry Revenue Million Forecast, by Country 2020 & 2033
- Table 19: Brazil USA Managed Service Industry Revenue (Million) Forecast, by Application 2020 & 2033
- Table 20: Argentina USA Managed Service Industry Revenue (Million) Forecast, by Application 2020 & 2033
- Table 21: Rest of South America USA Managed Service Industry Revenue (Million) Forecast, by Application 2020 & 2033
- Table 22: Global USA Managed Service Industry Revenue Million Forecast, by Deployment 2020 & 2033
- Table 23: Global USA Managed Service Industry Revenue Million Forecast, by Type 2020 & 2033
- Table 24: Global USA Managed Service Industry Revenue Million Forecast, by Enterprise Size 2020 & 2033
- Table 25: Global USA Managed Service Industry Revenue Million Forecast, by End-user Vertical 2020 & 2033
- Table 26: Global USA Managed Service Industry Revenue Million Forecast, by Country 2020 & 2033
- Table 27: United Kingdom USA Managed Service Industry Revenue (Million) Forecast, by Application 2020 & 2033
- Table 28: Germany USA Managed Service Industry Revenue (Million) Forecast, by Application 2020 & 2033
- Table 29: France USA Managed Service Industry Revenue (Million) Forecast, by Application 2020 & 2033
- Table 30: Italy USA Managed Service Industry Revenue (Million) Forecast, by Application 2020 & 2033
- Table 31: Spain USA Managed Service Industry Revenue (Million) Forecast, by Application 2020 & 2033
- Table 32: Russia USA Managed Service Industry Revenue (Million) Forecast, by Application 2020 & 2033
- Table 33: Benelux USA Managed Service Industry Revenue (Million) Forecast, by Application 2020 & 2033
- Table 34: Nordics USA Managed Service Industry Revenue (Million) Forecast, by Application 2020 & 2033
- Table 35: Rest of Europe USA Managed Service Industry Revenue (Million) Forecast, by Application 2020 & 2033
- Table 36: Global USA Managed Service Industry Revenue Million Forecast, by Deployment 2020 & 2033
- Table 37: Global USA Managed Service Industry Revenue Million Forecast, by Type 2020 & 2033
- Table 38: Global USA Managed Service Industry Revenue Million Forecast, by Enterprise Size 2020 & 2033
- Table 39: Global USA Managed Service Industry Revenue Million Forecast, by End-user Vertical 2020 & 2033
- Table 40: Global USA Managed Service Industry Revenue Million Forecast, by Country 2020 & 2033
- Table 41: Turkey USA Managed Service Industry Revenue (Million) Forecast, by Application 2020 & 2033
- Table 42: Israel USA Managed Service Industry Revenue (Million) Forecast, by Application 2020 & 2033
- Table 43: GCC USA Managed Service Industry Revenue (Million) Forecast, by Application 2020 & 2033
- Table 44: North Africa USA Managed Service Industry Revenue (Million) Forecast, by Application 2020 & 2033
- Table 45: South Africa USA Managed Service Industry Revenue (Million) Forecast, by Application 2020 & 2033
- Table 46: Rest of Middle East & Africa USA Managed Service Industry Revenue (Million) Forecast, by Application 2020 & 2033
- Table 47: Global USA Managed Service Industry Revenue Million Forecast, by Deployment 2020 & 2033
- Table 48: Global USA Managed Service Industry Revenue Million Forecast, by Type 2020 & 2033
- Table 49: Global USA Managed Service Industry Revenue Million Forecast, by Enterprise Size 2020 & 2033
- Table 50: Global USA Managed Service Industry Revenue Million Forecast, by End-user Vertical 2020 & 2033
- Table 51: Global USA Managed Service Industry Revenue Million Forecast, by Country 2020 & 2033
- Table 52: China USA Managed Service Industry Revenue (Million) Forecast, by Application 2020 & 2033
- Table 53: India USA Managed Service Industry Revenue (Million) Forecast, by Application 2020 & 2033
- Table 54: Japan USA Managed Service Industry Revenue (Million) Forecast, by Application 2020 & 2033
- Table 55: South Korea USA Managed Service Industry Revenue (Million) Forecast, by Application 2020 & 2033
- Table 56: ASEAN USA Managed Service Industry Revenue (Million) Forecast, by Application 2020 & 2033
- Table 57: Oceania USA Managed Service Industry Revenue (Million) Forecast, by Application 2020 & 2033
- Table 58: Rest of Asia Pacific USA Managed Service Industry Revenue (Million) Forecast, by Application 2020 & 2033
Frequently Asked Questions
1. What is the projected Compound Annual Growth Rate (CAGR) of the USA Managed Service Industry?
The projected CAGR is approximately 10.82%.
2. Which companies are prominent players in the USA Managed Service Industry?
Key companies in the market include Wipro Limite, Rackspace Technology Inc, IBM Corporation, Cisco Systems Inc, Verizon Communications Inc, Microsoft Corporation, HP Inc, Fujitsu Limited, Tata Consultancy Services Limited, Dell Technologies Inc, AT&T Inc, Citrix Systems Inc.
3. What are the main segments of the USA Managed Service Industry?
The market segments include Deployment, Type, Enterprise Size, End-user Vertical.
4. Can you provide details about the market size?
The market size is estimated to be USD 62.76 Million as of 2022.
5. What are some drivers contributing to market growth?
Increasing Shift to Hybrid IT; Improved Cost and Operational Efficiency.
6. What are the notable trends driving market growth?
Cloud to Witness Significant Growth.
7. Are there any restraints impacting market growth?
High Risk of Radiation Since it uses Gamma Rays. X-Rays; High Deployment Costs.
8. Can you provide examples of recent developments in the market?
October 2023 - Rackspace Technology introduced Rackspace Managed Cloud (RMC), an all-inclusive service enabling customers to delegate their cloud environments' management and operations. This comprehensive solution is tailored for organizations utilizing platforms such as AWS, Azure, Google Cloud, Rackspace Private Cloud, and on-premises infrastructure.
9. What pricing options are available for accessing the report?
Pricing options include single-user, multi-user, and enterprise licenses priced at USD 3800, USD 4500, and USD 5800 respectively.
10. Is the market size provided in terms of value or volume?
The market size is provided in terms of value, measured in Million.
11. Are there any specific market keywords associated with the report?
Yes, the market keyword associated with the report is "USA Managed Service Industry," which aids in identifying and referencing the specific market segment covered.
12. How do I determine which pricing option suits my needs best?
The pricing options vary based on user requirements and access needs. Individual users may opt for single-user licenses, while businesses requiring broader access may choose multi-user or enterprise licenses for cost-effective access to the report.
13. Are there any additional resources or data provided in the USA Managed Service Industry report?
While the report offers comprehensive insights, it's advisable to review the specific contents or supplementary materials provided to ascertain if additional resources or data are available.
14. How can I stay updated on further developments or reports in the USA Managed Service Industry?
To stay informed about further developments, trends, and reports in the USA Managed Service Industry, consider subscribing to industry newsletters, following relevant companies and organizations, or regularly checking reputable industry news sources and publications.
Methodology
Step 1 - Identification of Relevant Samples Size from Population Database


Step 2 - Approaches for Defining Global Market Size (Value, Volume* & Price*)

Note*: In applicable scenarios
Step 3 - Data Sources
Primary Research
- Web Analytics
- Survey Reports
- Research Institute
- Latest Research Reports
- Opinion Leaders
Secondary Research
- Annual Reports
- White Paper
- Latest Press Release
- Industry Association
- Paid Database
- Investor Presentations

Step 4 - Data Triangulation
Involves using different sources of information in order to increase the validity of a study
These sources are likely to be stakeholders in a program - participants, other researchers, program staff, other community members, and so on.
Then we put all data in single framework & apply various statistical tools to find out the dynamic on the market.
During the analysis stage, feedback from the stakeholder groups would be compared to determine areas of agreement as well as areas of divergence