

Key Insights
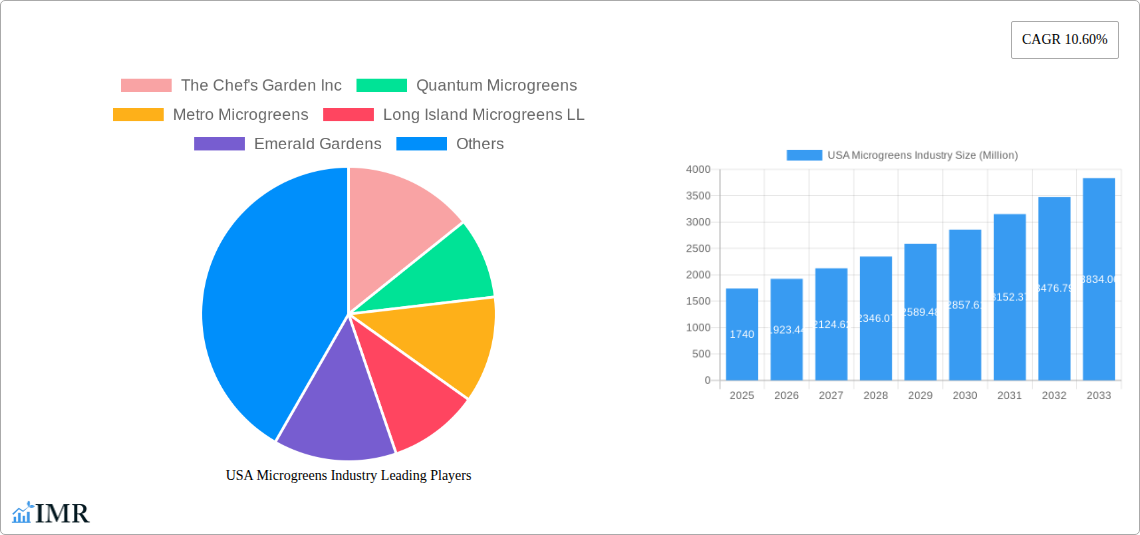
The US microgreens industry, valued at $1.74 billion in 2025, is experiencing robust growth, projected to expand at a compound annual growth rate (CAGR) of 10.60% from 2025 to 2033. This surge is driven by several key factors. Increasing consumer awareness of the nutritional benefits of microgreens, coupled with rising health consciousness, fuels strong demand. The versatility of microgreens, easily incorporated into various culinary applications, from gourmet restaurants to everyday home cooking, further bolsters market expansion. The rise of the food service sector, particularly in quick-service and fast-casual restaurants, also contributes significantly. Furthermore, the growing popularity of indoor and vertical farming techniques offers a solution to land constraints and enables year-round microgreen production, enhancing supply chain resilience. Significant investments in agricultural technology are improving yields and reducing production costs, further driving industry growth. The diverse range of microgreen varieties, from broccoli and lettuce to basil and kale, caters to a wide spectrum of consumer preferences, contributing to overall market expansion.
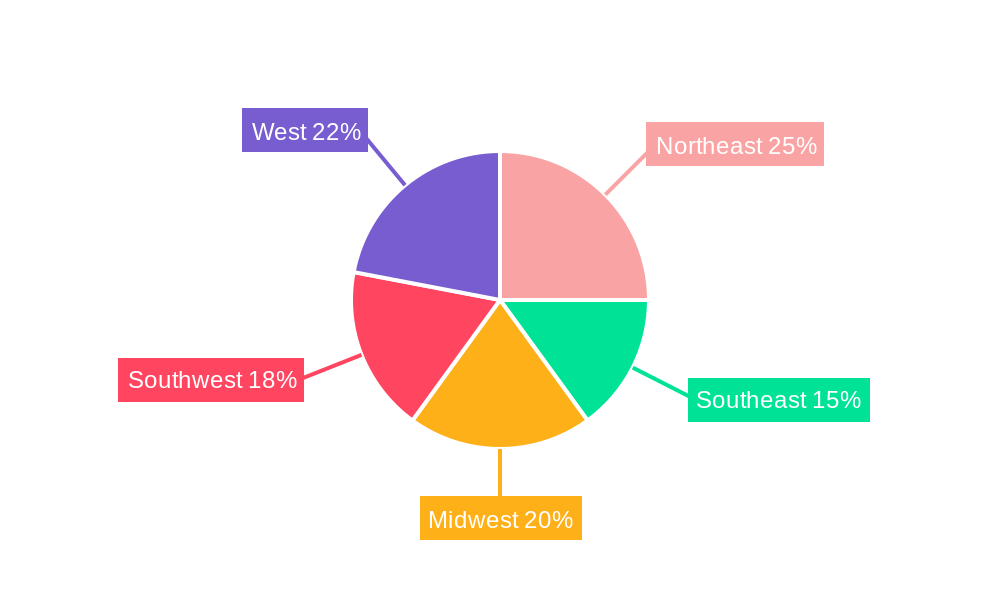
Market segmentation reveals a dynamic landscape. Hypermarkets and supermarkets represent a major sales channel, while restaurants are emerging as a significant growth driver. Farming techniques are diversifying, with indoor and vertical farming gaining momentum due to their efficiency and sustainability benefits. While specific market share data for each segment and region isn't provided, it's reasonable to infer that the Northeast and West regions, known for their higher concentrations of health-conscious consumers and advanced agricultural technologies, likely hold larger market shares. The competitive landscape includes established players like AeroFarms and emerging companies targeting specific niches. However, potential restraints include challenges in maintaining consistent quality and supply chain efficiency, along with price sensitivity among some consumers. Continued innovation and strategic partnerships across the supply chain will be vital for sustaining the industry's impressive growth trajectory.
USA Microgreens Industry Market Report: 2019-2033
This comprehensive report provides an in-depth analysis of the USA microgreens industry, encompassing market dynamics, growth trends, dominant segments, and key players. With a study period spanning 2019-2033, a base year of 2025, and a forecast period of 2025-2033, this report is an essential resource for industry professionals, investors, and anyone seeking to understand this rapidly evolving market. The report uses Million units for all values.
USA Microgreens Industry Market Dynamics & Structure
The US microgreens market exhibits moderate concentration, with a few large players and numerous smaller regional producers. Technological innovation, particularly in vertical farming and aeroponics, is a key driver, alongside increasing consumer demand for healthy and sustainable food options. Regulatory frameworks concerning food safety and labeling influence market practices. Competitive substitutes include traditional leafy greens and sprouts. The market is characterized by a growing consumer base focused on health-conscious millennials and Gen Z. M&A activity remains relatively low, with xx deals recorded between 2019-2024, indicating potential for future consolidation.
- Market Concentration: Moderately concentrated, with xx% market share held by the top 5 players in 2024.
- Technological Innovation: Rapid advancements in vertical farming and aeroponics driving efficiency and scalability.
- Regulatory Framework: Stringent food safety regulations impacting production and labeling.
- Competitive Substitutes: Traditional leafy greens and sprouts pose a competitive challenge.
- End-User Demographics: Health-conscious consumers, particularly millennials and Gen Z, are key drivers.
- M&A Trends: Low level of M&A activity (xx deals between 2019-2024), with potential for future consolidation.
USA Microgreens Industry Growth Trends & Insights
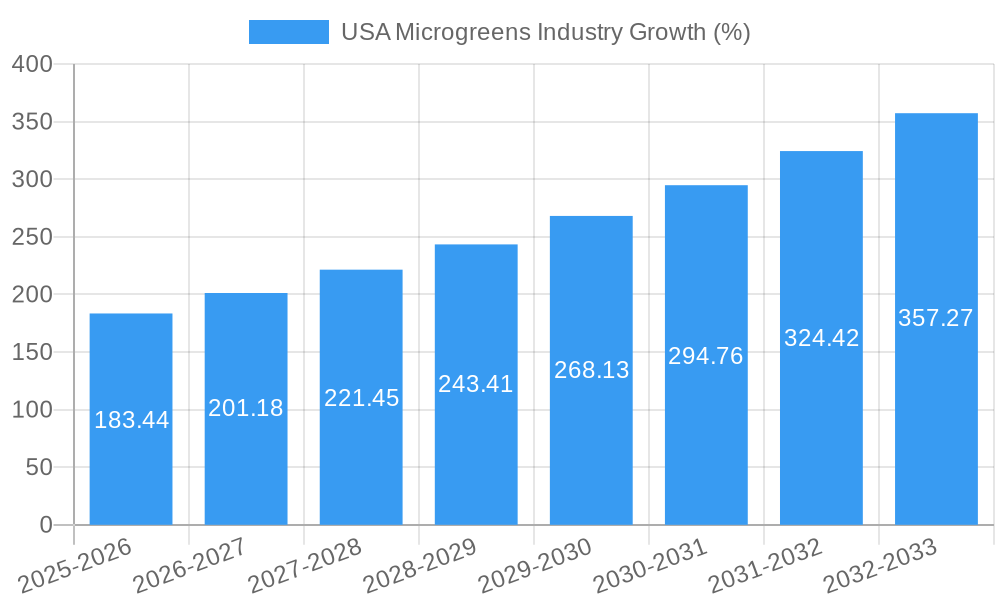
The US microgreens market experienced significant growth between 2019 and 2024, expanding from xx Million units to xx Million units. This growth is fueled by increasing consumer awareness of the nutritional benefits of microgreens, coupled with rising demand for fresh, locally sourced produce. The market is witnessing a shift towards sustainable farming practices, with indoor and vertical farming gaining traction. Technological advancements are streamlining production processes, enhancing yields, and reducing costs. Consumer behavior is shifting towards purchasing microgreens through various channels, including supermarkets, restaurants, and online platforms. The compound annual growth rate (CAGR) for the period 2019-2024 is estimated at xx%, while the projected CAGR for 2025-2033 is xx%, indicating sustained market expansion. Market penetration is expected to reach xx% by 2033.
Dominant Regions, Countries, or Segments in USA Microgreens Industry
The leading sales channel is hypermarkets/supermarkets, capturing xx% of the market in 2024, driven by increasing availability and consumer preference for convenient purchasing. Restaurants represent another significant segment, contributing xx% in 2024 due to the growing incorporation of microgreens in gourmet dishes. Indoor farming is the dominant farming technique, accounting for xx% of production in 2024, offering year-round production and controlled environment advantages. Within microgreen types, Broccoli, Lettuce and Chicory dominate with xx% of the market in 2024, followed by Basil, accounting for xx%.
- Sales Channels:
- Hypermarkets/Supermarkets: Dominant channel due to convenience and widespread availability.
- Restaurants: Significant segment driven by growing culinary applications.
- Other Channels: Includes farmers' markets, online retailers, and direct-to-consumer sales.
- Farming Techniques:
- Indoor Farming: Leading technique due to controlled environment and year-round production capabilities.
- Vertical Farming: Rapidly growing segment leveraging space optimization and automation.
- Commercial Greenhouses: Traditional method offering cost-effective production in suitable climates.
- Other Farming Techniques: Includes outdoor farming and hydroponics.
- Microgreen Types:
- Broccoli, Lettuce and Chicory: Largest segment due to high consumer demand and adaptability.
- Basil: Popular segment due to versatility in culinary applications.
- Other types: Includes a diverse range of microgreens, each with specific market niches.
USA Microgreens Industry Product Landscape
The US microgreens market offers a variety of microgreens, catering to diverse culinary preferences and nutritional needs. Product innovation focuses on extending shelf life, enhancing flavor profiles, and developing unique blends tailored to specific consumer segments. Technological advancements in controlled environment agriculture (CEA) are improving yields and quality, while reducing resource consumption. The unique selling propositions of microgreens are their high nutritional value, versatility in culinary applications, and appeal to health-conscious consumers.
Key Drivers, Barriers & Challenges in USA Microgreens Industry
Key Drivers:
- Growing consumer demand for healthy and nutritious food.
- Increasing adoption of sustainable and eco-friendly farming practices.
- Technological advancements in vertical and indoor farming.
- Rising interest in locally sourced and fresh produce.
Key Challenges & Restraints:
- High initial investment costs for advanced farming technologies.
- Fluctuations in energy prices affecting production costs.
- Competition from established leafy green producers.
- Concerns regarding food safety and quality control. xx% of producers experienced supply chain disruptions in 2024.
Emerging Opportunities in USA Microgreens Industry
Untapped markets include expanding distribution to smaller retailers, increasing consumer awareness through educational campaigns, and developing value-added products like microgreen-based snacks and supplements. Innovative applications include incorporating microgreens into ready-to-eat meals and packaged salads. Evolving consumer preferences for convenience, sustainability, and unique flavor profiles present significant opportunities.
Growth Accelerators in the USA Microgreens Industry Industry
Technological advancements in vertical farming and aeroponics are significantly accelerating growth, increasing yields, and reducing costs. Strategic partnerships between microgreen producers and food retailers, restaurants, and food processors are broadening market reach and accelerating sales. Expansion into new geographic markets and product diversification are vital for long-term growth.
Key Players Shaping the USA Microgreens Industry Market
- The Chef's Garden Inc
- Quantum Microgreens
- Metro Microgreens
- Long Island Microgreens LL
- Emerald Gardens
- Fresh Origins
- Florida Microgreens
- Farmbox Greens LLC
- Arizona Microgreens LLC
- AeroFarms LLC
Notable Milestones in USA Microgreens Industry Sector
- September 2022: AeroFarms establishes the world's largest aeroponic smart farm in Danville, VA, capable of producing over 3 million lbs of leafy greens annually.
- July 2022: AeroFarms expands its Pittsylvania County vertical farm, increasing leafy green production to meet growing demand.
- February 2022: Infarm opens a new vertical farming center in Texas, significantly boosting market presence in the region.
In-Depth USA Microgreens Industry Market Outlook
The US microgreens market is poised for robust growth over the next decade, driven by technological innovations, increasing consumer demand for healthy foods, and the expansion of sustainable farming practices. Strategic partnerships and market expansion into untapped segments will further fuel market expansion, creating lucrative opportunities for established players and new entrants. The market is expected to reach xx Million units by 2033, representing a significant increase from its current size.
USA Microgreens Industry Segmentation
- 1. Production Analysis
- 2. Consumption Analysis
- 3. Import Market Analysis (Value & Volume)
- 4. Export Market Analysis (Value & Volume)
- 5. Price Trend Analysis
USA Microgreens Industry Segmentation By Geography
-
1. North America
- 1.1. United States
- 1.2. Canada
- 1.3. Mexico
-
2. South America
- 2.1. Brazil
- 2.2. Argentina
- 2.3. Rest of South America
-
3. Europe
- 3.1. United Kingdom
- 3.2. Germany
- 3.3. France
- 3.4. Italy
- 3.5. Spain
- 3.6. Russia
- 3.7. Benelux
- 3.8. Nordics
- 3.9. Rest of Europe
-
4. Middle East & Africa
- 4.1. Turkey
- 4.2. Israel
- 4.3. GCC
- 4.4. North Africa
- 4.5. South Africa
- 4.6. Rest of Middle East & Africa
-
5. Asia Pacific
- 5.1. China
- 5.2. India
- 5.3. Japan
- 5.4. South Korea
- 5.5. ASEAN
- 5.6. Oceania
- 5.7. Rest of Asia Pacific
USA Microgreens Industry REPORT HIGHLIGHTS
| Aspects | Details |
|---|---|
| Study Period | 2019-2033 |
| Base Year | 2024 |
| Estimated Year | 2025 |
| Forecast Period | 2025-2033 |
| Historical Period | 2019-2024 |
| Growth Rate | CAGR of 10.60% from 2019-2033 |
| Segmentation |
|
Table of Contents
- 1. Introduction
- 1.1. Research Scope
- 1.2. Market Segmentation
- 1.3. Research Methodology
- 1.4. Definitions and Assumptions
- 2. Executive Summary
- 2.1. Introduction
- 3. Market Dynamics
- 3.1. Introduction
- 3.2. Market Drivers
- 3.2.1. Need for Custom Product Development; Use of CROs for Regulatory Services
- 3.3. Market Restrains
- 3.3.1. Data and Cyber Security Concerns; Lack of Experts and Professionals in this Industry
- 3.4. Market Trends
- 3.4.1. Increased Investments in Vertical Farming Domain
- 4. Market Factor Analysis
- 4.1. Porters Five Forces
- 4.2. Supply/Value Chain
- 4.3. PESTEL analysis
- 4.4. Market Entropy
- 4.5. Patent/Trademark Analysis
- 5. Global USA Microgreens Industry Analysis, Insights and Forecast, 2019-2031
- 5.1. Market Analysis, Insights and Forecast - by Production Analysis
- 5.2. Market Analysis, Insights and Forecast - by Consumption Analysis
- 5.3. Market Analysis, Insights and Forecast - by Import Market Analysis (Value & Volume)
- 5.4. Market Analysis, Insights and Forecast - by Export Market Analysis (Value & Volume)
- 5.5. Market Analysis, Insights and Forecast - by Price Trend Analysis
- 5.6. Market Analysis, Insights and Forecast - by Region
- 5.6.1. North America
- 5.6.2. South America
- 5.6.3. Europe
- 5.6.4. Middle East & Africa
- 5.6.5. Asia Pacific
- 5.1. Market Analysis, Insights and Forecast - by Production Analysis
- 6. North America USA Microgreens Industry Analysis, Insights and Forecast, 2019-2031
- 6.1. Market Analysis, Insights and Forecast - by Production Analysis
- 6.2. Market Analysis, Insights and Forecast - by Consumption Analysis
- 6.3. Market Analysis, Insights and Forecast - by Import Market Analysis (Value & Volume)
- 6.4. Market Analysis, Insights and Forecast - by Export Market Analysis (Value & Volume)
- 6.5. Market Analysis, Insights and Forecast - by Price Trend Analysis
- 6.1. Market Analysis, Insights and Forecast - by Production Analysis
- 7. South America USA Microgreens Industry Analysis, Insights and Forecast, 2019-2031
- 7.1. Market Analysis, Insights and Forecast - by Production Analysis
- 7.2. Market Analysis, Insights and Forecast - by Consumption Analysis
- 7.3. Market Analysis, Insights and Forecast - by Import Market Analysis (Value & Volume)
- 7.4. Market Analysis, Insights and Forecast - by Export Market Analysis (Value & Volume)
- 7.5. Market Analysis, Insights and Forecast - by Price Trend Analysis
- 7.1. Market Analysis, Insights and Forecast - by Production Analysis
- 8. Europe USA Microgreens Industry Analysis, Insights and Forecast, 2019-2031
- 8.1. Market Analysis, Insights and Forecast - by Production Analysis
- 8.2. Market Analysis, Insights and Forecast - by Consumption Analysis
- 8.3. Market Analysis, Insights and Forecast - by Import Market Analysis (Value & Volume)
- 8.4. Market Analysis, Insights and Forecast - by Export Market Analysis (Value & Volume)
- 8.5. Market Analysis, Insights and Forecast - by Price Trend Analysis
- 8.1. Market Analysis, Insights and Forecast - by Production Analysis
- 9. Middle East & Africa USA Microgreens Industry Analysis, Insights and Forecast, 2019-2031
- 9.1. Market Analysis, Insights and Forecast - by Production Analysis
- 9.2. Market Analysis, Insights and Forecast - by Consumption Analysis
- 9.3. Market Analysis, Insights and Forecast - by Import Market Analysis (Value & Volume)
- 9.4. Market Analysis, Insights and Forecast - by Export Market Analysis (Value & Volume)
- 9.5. Market Analysis, Insights and Forecast - by Price Trend Analysis
- 9.1. Market Analysis, Insights and Forecast - by Production Analysis
- 10. Asia Pacific USA Microgreens Industry Analysis, Insights and Forecast, 2019-2031
- 10.1. Market Analysis, Insights and Forecast - by Production Analysis
- 10.2. Market Analysis, Insights and Forecast - by Consumption Analysis
- 10.3. Market Analysis, Insights and Forecast - by Import Market Analysis (Value & Volume)
- 10.4. Market Analysis, Insights and Forecast - by Export Market Analysis (Value & Volume)
- 10.5. Market Analysis, Insights and Forecast - by Price Trend Analysis
- 10.1. Market Analysis, Insights and Forecast - by Production Analysis
- 11. Northeast USA Microgreens Industry Analysis, Insights and Forecast, 2019-2031
- 12. Southeast USA Microgreens Industry Analysis, Insights and Forecast, 2019-2031
- 13. Midwest USA Microgreens Industry Analysis, Insights and Forecast, 2019-2031
- 14. Southwest USA Microgreens Industry Analysis, Insights and Forecast, 2019-2031
- 15. West USA Microgreens Industry Analysis, Insights and Forecast, 2019-2031
- 16. Competitive Analysis
- 16.1. Global Market Share Analysis 2024
- 16.2. Company Profiles
- 16.2.1 The Chef's Garden Inc
- 16.2.1.1. Overview
- 16.2.1.2. Products
- 16.2.1.3. SWOT Analysis
- 16.2.1.4. Recent Developments
- 16.2.1.5. Financials (Based on Availability)
- 16.2.2 Quantum Microgreens
- 16.2.2.1. Overview
- 16.2.2.2. Products
- 16.2.2.3. SWOT Analysis
- 16.2.2.4. Recent Developments
- 16.2.2.5. Financials (Based on Availability)
- 16.2.3 Metro Microgreens
- 16.2.3.1. Overview
- 16.2.3.2. Products
- 16.2.3.3. SWOT Analysis
- 16.2.3.4. Recent Developments
- 16.2.3.5. Financials (Based on Availability)
- 16.2.4 Long Island Microgreens LL
- 16.2.4.1. Overview
- 16.2.4.2. Products
- 16.2.4.3. SWOT Analysis
- 16.2.4.4. Recent Developments
- 16.2.4.5. Financials (Based on Availability)
- 16.2.5 Emerald Gardens
- 16.2.5.1. Overview
- 16.2.5.2. Products
- 16.2.5.3. SWOT Analysis
- 16.2.5.4. Recent Developments
- 16.2.5.5. Financials (Based on Availability)
- 16.2.6 Fresh Origins
- 16.2.6.1. Overview
- 16.2.6.2. Products
- 16.2.6.3. SWOT Analysis
- 16.2.6.4. Recent Developments
- 16.2.6.5. Financials (Based on Availability)
- 16.2.7 Florida Microgreens
- 16.2.7.1. Overview
- 16.2.7.2. Products
- 16.2.7.3. SWOT Analysis
- 16.2.7.4. Recent Developments
- 16.2.7.5. Financials (Based on Availability)
- 16.2.8 Farmbox Greens LLC
- 16.2.8.1. Overview
- 16.2.8.2. Products
- 16.2.8.3. SWOT Analysis
- 16.2.8.4. Recent Developments
- 16.2.8.5. Financials (Based on Availability)
- 16.2.9 Arizona Microgreens LLC
- 16.2.9.1. Overview
- 16.2.9.2. Products
- 16.2.9.3. SWOT Analysis
- 16.2.9.4. Recent Developments
- 16.2.9.5. Financials (Based on Availability)
- 16.2.10 AeroFarms LLC
- 16.2.10.1. Overview
- 16.2.10.2. Products
- 16.2.10.3. SWOT Analysis
- 16.2.10.4. Recent Developments
- 16.2.10.5. Financials (Based on Availability)
- 16.2.1 The Chef's Garden Inc
List of Figures
- Figure 1: Global USA Microgreens Industry Revenue Breakdown (Million, %) by Region 2024 & 2032
- Figure 2: United states USA Microgreens Industry Revenue (Million), by Country 2024 & 2032
- Figure 3: United states USA Microgreens Industry Revenue Share (%), by Country 2024 & 2032
- Figure 4: North America USA Microgreens Industry Revenue (Million), by Production Analysis 2024 & 2032
- Figure 5: North America USA Microgreens Industry Revenue Share (%), by Production Analysis 2024 & 2032
- Figure 6: North America USA Microgreens Industry Revenue (Million), by Consumption Analysis 2024 & 2032
- Figure 7: North America USA Microgreens Industry Revenue Share (%), by Consumption Analysis 2024 & 2032
- Figure 8: North America USA Microgreens Industry Revenue (Million), by Import Market Analysis (Value & Volume) 2024 & 2032
- Figure 9: North America USA Microgreens Industry Revenue Share (%), by Import Market Analysis (Value & Volume) 2024 & 2032
- Figure 10: North America USA Microgreens Industry Revenue (Million), by Export Market Analysis (Value & Volume) 2024 & 2032
- Figure 11: North America USA Microgreens Industry Revenue Share (%), by Export Market Analysis (Value & Volume) 2024 & 2032
- Figure 12: North America USA Microgreens Industry Revenue (Million), by Price Trend Analysis 2024 & 2032
- Figure 13: North America USA Microgreens Industry Revenue Share (%), by Price Trend Analysis 2024 & 2032
- Figure 14: North America USA Microgreens Industry Revenue (Million), by Country 2024 & 2032
- Figure 15: North America USA Microgreens Industry Revenue Share (%), by Country 2024 & 2032
- Figure 16: South America USA Microgreens Industry Revenue (Million), by Production Analysis 2024 & 2032
- Figure 17: South America USA Microgreens Industry Revenue Share (%), by Production Analysis 2024 & 2032
- Figure 18: South America USA Microgreens Industry Revenue (Million), by Consumption Analysis 2024 & 2032
- Figure 19: South America USA Microgreens Industry Revenue Share (%), by Consumption Analysis 2024 & 2032
- Figure 20: South America USA Microgreens Industry Revenue (Million), by Import Market Analysis (Value & Volume) 2024 & 2032
- Figure 21: South America USA Microgreens Industry Revenue Share (%), by Import Market Analysis (Value & Volume) 2024 & 2032
- Figure 22: South America USA Microgreens Industry Revenue (Million), by Export Market Analysis (Value & Volume) 2024 & 2032
- Figure 23: South America USA Microgreens Industry Revenue Share (%), by Export Market Analysis (Value & Volume) 2024 & 2032
- Figure 24: South America USA Microgreens Industry Revenue (Million), by Price Trend Analysis 2024 & 2032
- Figure 25: South America USA Microgreens Industry Revenue Share (%), by Price Trend Analysis 2024 & 2032
- Figure 26: South America USA Microgreens Industry Revenue (Million), by Country 2024 & 2032
- Figure 27: South America USA Microgreens Industry Revenue Share (%), by Country 2024 & 2032
- Figure 28: Europe USA Microgreens Industry Revenue (Million), by Production Analysis 2024 & 2032
- Figure 29: Europe USA Microgreens Industry Revenue Share (%), by Production Analysis 2024 & 2032
- Figure 30: Europe USA Microgreens Industry Revenue (Million), by Consumption Analysis 2024 & 2032
- Figure 31: Europe USA Microgreens Industry Revenue Share (%), by Consumption Analysis 2024 & 2032
- Figure 32: Europe USA Microgreens Industry Revenue (Million), by Import Market Analysis (Value & Volume) 2024 & 2032
- Figure 33: Europe USA Microgreens Industry Revenue Share (%), by Import Market Analysis (Value & Volume) 2024 & 2032
- Figure 34: Europe USA Microgreens Industry Revenue (Million), by Export Market Analysis (Value & Volume) 2024 & 2032
- Figure 35: Europe USA Microgreens Industry Revenue Share (%), by Export Market Analysis (Value & Volume) 2024 & 2032
- Figure 36: Europe USA Microgreens Industry Revenue (Million), by Price Trend Analysis 2024 & 2032
- Figure 37: Europe USA Microgreens Industry Revenue Share (%), by Price Trend Analysis 2024 & 2032
- Figure 38: Europe USA Microgreens Industry Revenue (Million), by Country 2024 & 2032
- Figure 39: Europe USA Microgreens Industry Revenue Share (%), by Country 2024 & 2032
- Figure 40: Middle East & Africa USA Microgreens Industry Revenue (Million), by Production Analysis 2024 & 2032
- Figure 41: Middle East & Africa USA Microgreens Industry Revenue Share (%), by Production Analysis 2024 & 2032
- Figure 42: Middle East & Africa USA Microgreens Industry Revenue (Million), by Consumption Analysis 2024 & 2032
- Figure 43: Middle East & Africa USA Microgreens Industry Revenue Share (%), by Consumption Analysis 2024 & 2032
- Figure 44: Middle East & Africa USA Microgreens Industry Revenue (Million), by Import Market Analysis (Value & Volume) 2024 & 2032
- Figure 45: Middle East & Africa USA Microgreens Industry Revenue Share (%), by Import Market Analysis (Value & Volume) 2024 & 2032
- Figure 46: Middle East & Africa USA Microgreens Industry Revenue (Million), by Export Market Analysis (Value & Volume) 2024 & 2032
- Figure 47: Middle East & Africa USA Microgreens Industry Revenue Share (%), by Export Market Analysis (Value & Volume) 2024 & 2032
- Figure 48: Middle East & Africa USA Microgreens Industry Revenue (Million), by Price Trend Analysis 2024 & 2032
- Figure 49: Middle East & Africa USA Microgreens Industry Revenue Share (%), by Price Trend Analysis 2024 & 2032
- Figure 50: Middle East & Africa USA Microgreens Industry Revenue (Million), by Country 2024 & 2032
- Figure 51: Middle East & Africa USA Microgreens Industry Revenue Share (%), by Country 2024 & 2032
- Figure 52: Asia Pacific USA Microgreens Industry Revenue (Million), by Production Analysis 2024 & 2032
- Figure 53: Asia Pacific USA Microgreens Industry Revenue Share (%), by Production Analysis 2024 & 2032
- Figure 54: Asia Pacific USA Microgreens Industry Revenue (Million), by Consumption Analysis 2024 & 2032
- Figure 55: Asia Pacific USA Microgreens Industry Revenue Share (%), by Consumption Analysis 2024 & 2032
- Figure 56: Asia Pacific USA Microgreens Industry Revenue (Million), by Import Market Analysis (Value & Volume) 2024 & 2032
- Figure 57: Asia Pacific USA Microgreens Industry Revenue Share (%), by Import Market Analysis (Value & Volume) 2024 & 2032
- Figure 58: Asia Pacific USA Microgreens Industry Revenue (Million), by Export Market Analysis (Value & Volume) 2024 & 2032
- Figure 59: Asia Pacific USA Microgreens Industry Revenue Share (%), by Export Market Analysis (Value & Volume) 2024 & 2032
- Figure 60: Asia Pacific USA Microgreens Industry Revenue (Million), by Price Trend Analysis 2024 & 2032
- Figure 61: Asia Pacific USA Microgreens Industry Revenue Share (%), by Price Trend Analysis 2024 & 2032
- Figure 62: Asia Pacific USA Microgreens Industry Revenue (Million), by Country 2024 & 2032
- Figure 63: Asia Pacific USA Microgreens Industry Revenue Share (%), by Country 2024 & 2032
List of Tables
- Table 1: Global USA Microgreens Industry Revenue Million Forecast, by Region 2019 & 2032
- Table 2: Global USA Microgreens Industry Revenue Million Forecast, by Production Analysis 2019 & 2032
- Table 3: Global USA Microgreens Industry Revenue Million Forecast, by Consumption Analysis 2019 & 2032
- Table 4: Global USA Microgreens Industry Revenue Million Forecast, by Import Market Analysis (Value & Volume) 2019 & 2032
- Table 5: Global USA Microgreens Industry Revenue Million Forecast, by Export Market Analysis (Value & Volume) 2019 & 2032
- Table 6: Global USA Microgreens Industry Revenue Million Forecast, by Price Trend Analysis 2019 & 2032
- Table 7: Global USA Microgreens Industry Revenue Million Forecast, by Region 2019 & 2032
- Table 8: Global USA Microgreens Industry Revenue Million Forecast, by Country 2019 & 2032
- Table 9: Northeast USA Microgreens Industry Revenue (Million) Forecast, by Application 2019 & 2032
- Table 10: Southeast USA Microgreens Industry Revenue (Million) Forecast, by Application 2019 & 2032
- Table 11: Midwest USA Microgreens Industry Revenue (Million) Forecast, by Application 2019 & 2032
- Table 12: Southwest USA Microgreens Industry Revenue (Million) Forecast, by Application 2019 & 2032
- Table 13: West USA Microgreens Industry Revenue (Million) Forecast, by Application 2019 & 2032
- Table 14: Global USA Microgreens Industry Revenue Million Forecast, by Production Analysis 2019 & 2032
- Table 15: Global USA Microgreens Industry Revenue Million Forecast, by Consumption Analysis 2019 & 2032
- Table 16: Global USA Microgreens Industry Revenue Million Forecast, by Import Market Analysis (Value & Volume) 2019 & 2032
- Table 17: Global USA Microgreens Industry Revenue Million Forecast, by Export Market Analysis (Value & Volume) 2019 & 2032
- Table 18: Global USA Microgreens Industry Revenue Million Forecast, by Price Trend Analysis 2019 & 2032
- Table 19: Global USA Microgreens Industry Revenue Million Forecast, by Country 2019 & 2032
- Table 20: United States USA Microgreens Industry Revenue (Million) Forecast, by Application 2019 & 2032
- Table 21: Canada USA Microgreens Industry Revenue (Million) Forecast, by Application 2019 & 2032
- Table 22: Mexico USA Microgreens Industry Revenue (Million) Forecast, by Application 2019 & 2032
- Table 23: Global USA Microgreens Industry Revenue Million Forecast, by Production Analysis 2019 & 2032
- Table 24: Global USA Microgreens Industry Revenue Million Forecast, by Consumption Analysis 2019 & 2032
- Table 25: Global USA Microgreens Industry Revenue Million Forecast, by Import Market Analysis (Value & Volume) 2019 & 2032
- Table 26: Global USA Microgreens Industry Revenue Million Forecast, by Export Market Analysis (Value & Volume) 2019 & 2032
- Table 27: Global USA Microgreens Industry Revenue Million Forecast, by Price Trend Analysis 2019 & 2032
- Table 28: Global USA Microgreens Industry Revenue Million Forecast, by Country 2019 & 2032
- Table 29: Brazil USA Microgreens Industry Revenue (Million) Forecast, by Application 2019 & 2032
- Table 30: Argentina USA Microgreens Industry Revenue (Million) Forecast, by Application 2019 & 2032
- Table 31: Rest of South America USA Microgreens Industry Revenue (Million) Forecast, by Application 2019 & 2032
- Table 32: Global USA Microgreens Industry Revenue Million Forecast, by Production Analysis 2019 & 2032
- Table 33: Global USA Microgreens Industry Revenue Million Forecast, by Consumption Analysis 2019 & 2032
- Table 34: Global USA Microgreens Industry Revenue Million Forecast, by Import Market Analysis (Value & Volume) 2019 & 2032
- Table 35: Global USA Microgreens Industry Revenue Million Forecast, by Export Market Analysis (Value & Volume) 2019 & 2032
- Table 36: Global USA Microgreens Industry Revenue Million Forecast, by Price Trend Analysis 2019 & 2032
- Table 37: Global USA Microgreens Industry Revenue Million Forecast, by Country 2019 & 2032
- Table 38: United Kingdom USA Microgreens Industry Revenue (Million) Forecast, by Application 2019 & 2032
- Table 39: Germany USA Microgreens Industry Revenue (Million) Forecast, by Application 2019 & 2032
- Table 40: France USA Microgreens Industry Revenue (Million) Forecast, by Application 2019 & 2032
- Table 41: Italy USA Microgreens Industry Revenue (Million) Forecast, by Application 2019 & 2032
- Table 42: Spain USA Microgreens Industry Revenue (Million) Forecast, by Application 2019 & 2032
- Table 43: Russia USA Microgreens Industry Revenue (Million) Forecast, by Application 2019 & 2032
- Table 44: Benelux USA Microgreens Industry Revenue (Million) Forecast, by Application 2019 & 2032
- Table 45: Nordics USA Microgreens Industry Revenue (Million) Forecast, by Application 2019 & 2032
- Table 46: Rest of Europe USA Microgreens Industry Revenue (Million) Forecast, by Application 2019 & 2032
- Table 47: Global USA Microgreens Industry Revenue Million Forecast, by Production Analysis 2019 & 2032
- Table 48: Global USA Microgreens Industry Revenue Million Forecast, by Consumption Analysis 2019 & 2032
- Table 49: Global USA Microgreens Industry Revenue Million Forecast, by Import Market Analysis (Value & Volume) 2019 & 2032
- Table 50: Global USA Microgreens Industry Revenue Million Forecast, by Export Market Analysis (Value & Volume) 2019 & 2032
- Table 51: Global USA Microgreens Industry Revenue Million Forecast, by Price Trend Analysis 2019 & 2032
- Table 52: Global USA Microgreens Industry Revenue Million Forecast, by Country 2019 & 2032
- Table 53: Turkey USA Microgreens Industry Revenue (Million) Forecast, by Application 2019 & 2032
- Table 54: Israel USA Microgreens Industry Revenue (Million) Forecast, by Application 2019 & 2032
- Table 55: GCC USA Microgreens Industry Revenue (Million) Forecast, by Application 2019 & 2032
- Table 56: North Africa USA Microgreens Industry Revenue (Million) Forecast, by Application 2019 & 2032
- Table 57: South Africa USA Microgreens Industry Revenue (Million) Forecast, by Application 2019 & 2032
- Table 58: Rest of Middle East & Africa USA Microgreens Industry Revenue (Million) Forecast, by Application 2019 & 2032
- Table 59: Global USA Microgreens Industry Revenue Million Forecast, by Production Analysis 2019 & 2032
- Table 60: Global USA Microgreens Industry Revenue Million Forecast, by Consumption Analysis 2019 & 2032
- Table 61: Global USA Microgreens Industry Revenue Million Forecast, by Import Market Analysis (Value & Volume) 2019 & 2032
- Table 62: Global USA Microgreens Industry Revenue Million Forecast, by Export Market Analysis (Value & Volume) 2019 & 2032
- Table 63: Global USA Microgreens Industry Revenue Million Forecast, by Price Trend Analysis 2019 & 2032
- Table 64: Global USA Microgreens Industry Revenue Million Forecast, by Country 2019 & 2032
- Table 65: China USA Microgreens Industry Revenue (Million) Forecast, by Application 2019 & 2032
- Table 66: India USA Microgreens Industry Revenue (Million) Forecast, by Application 2019 & 2032
- Table 67: Japan USA Microgreens Industry Revenue (Million) Forecast, by Application 2019 & 2032
- Table 68: South Korea USA Microgreens Industry Revenue (Million) Forecast, by Application 2019 & 2032
- Table 69: ASEAN USA Microgreens Industry Revenue (Million) Forecast, by Application 2019 & 2032
- Table 70: Oceania USA Microgreens Industry Revenue (Million) Forecast, by Application 2019 & 2032
- Table 71: Rest of Asia Pacific USA Microgreens Industry Revenue (Million) Forecast, by Application 2019 & 2032
Frequently Asked Questions
1. What is the projected Compound Annual Growth Rate (CAGR) of the USA Microgreens Industry?
The projected CAGR is approximately 10.60%.
2. Which companies are prominent players in the USA Microgreens Industry?
Key companies in the market include The Chef's Garden Inc, Quantum Microgreens, Metro Microgreens, Long Island Microgreens LL, Emerald Gardens, Fresh Origins, Florida Microgreens, Farmbox Greens LLC, Arizona Microgreens LLC, AeroFarms LLC.
3. What are the main segments of the USA Microgreens Industry?
The market segments include Production Analysis, Consumption Analysis, Import Market Analysis (Value & Volume), Export Market Analysis (Value & Volume), Price Trend Analysis.
4. Can you provide details about the market size?
The market size is estimated to be USD 1.74 Million as of 2022.
5. What are some drivers contributing to market growth?
Need for Custom Product Development; Use of CROs for Regulatory Services.
6. What are the notable trends driving market growth?
Increased Investments in Vertical Farming Domain.
7. Are there any restraints impacting market growth?
Data and Cyber Security Concerns; Lack of Experts and Professionals in this Industry.
8. Can you provide examples of recent developments in the market?
September 2022: To meet increased customer demand, AeroFarmsDanville VA established the world's largest Aeroponic Smart Farm with the newest Indoor Vertical Farm capable of growing over 3 million lb of fresh leafy greens annually.
9. What pricing options are available for accessing the report?
Pricing options include single-user, multi-user, and enterprise licenses priced at USD 3800, USD 4500, and USD 5800 respectively.
10. Is the market size provided in terms of value or volume?
The market size is provided in terms of value, measured in Million.
11. Are there any specific market keywords associated with the report?
Yes, the market keyword associated with the report is "USA Microgreens Industry," which aids in identifying and referencing the specific market segment covered.
12. How do I determine which pricing option suits my needs best?
The pricing options vary based on user requirements and access needs. Individual users may opt for single-user licenses, while businesses requiring broader access may choose multi-user or enterprise licenses for cost-effective access to the report.
13. Are there any additional resources or data provided in the USA Microgreens Industry report?
While the report offers comprehensive insights, it's advisable to review the specific contents or supplementary materials provided to ascertain if additional resources or data are available.
14. How can I stay updated on further developments or reports in the USA Microgreens Industry?
To stay informed about further developments, trends, and reports in the USA Microgreens Industry, consider subscribing to industry newsletters, following relevant companies and organizations, or regularly checking reputable industry news sources and publications.
Methodology
Step 1 - Identification of Relevant Samples Size from Population Database


Step 2 - Approaches for Defining Global Market Size (Value, Volume* & Price*)

Note*: In applicable scenarios
Step 3 - Data Sources
Primary Research
- Web Analytics
- Survey Reports
- Research Institute
- Latest Research Reports
- Opinion Leaders
Secondary Research
- Annual Reports
- White Paper
- Latest Press Release
- Industry Association
- Paid Database
- Investor Presentations

Step 4 - Data Triangulation
Involves using different sources of information in order to increase the validity of a study
These sources are likely to be stakeholders in a program - participants, other researchers, program staff, other community members, and so on.
Then we put all data in single framework & apply various statistical tools to find out the dynamic on the market.
During the analysis stage, feedback from the stakeholder groups would be compared to determine areas of agreement as well as areas of divergence
