

Key Insights
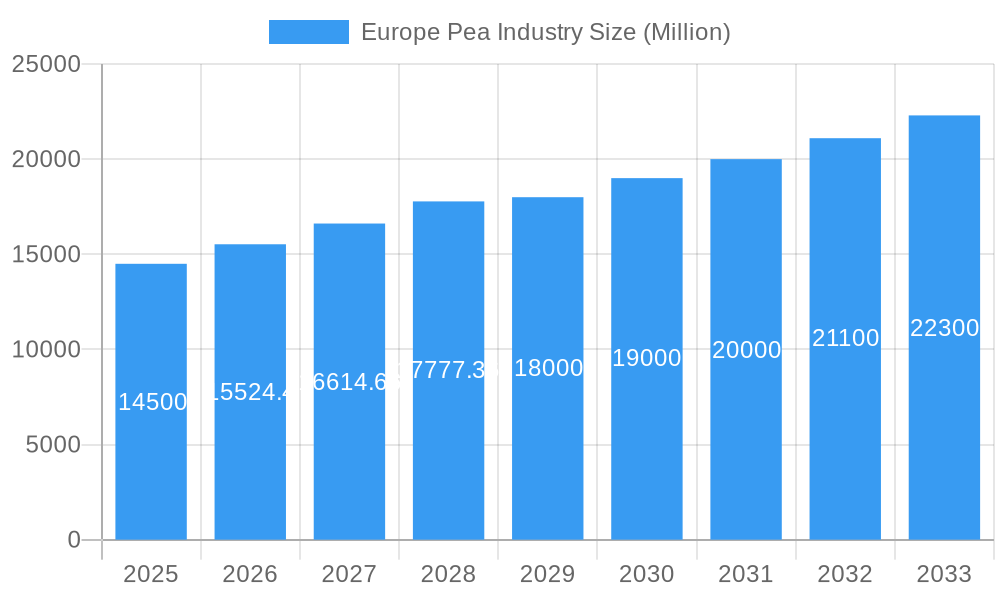
The European pea industry, valued at €14.5 billion in 2025, is projected to experience robust growth, driven by increasing consumer demand for plant-based proteins and the rising popularity of pea-based food products. This surge in demand is fueled by health-conscious consumers seeking alternatives to traditional protein sources, coupled with the growing awareness of the environmental benefits of pea cultivation compared to other protein crops. Key growth drivers include the expanding food processing and animal feed sectors, both actively incorporating peas into their product lines. Furthermore, advancements in pea breeding and processing technologies are enhancing the quality and versatility of pea ingredients, opening new avenues for innovation in food and beverage applications. While potential restraints such as weather patterns and fluctuating agricultural yields exist, technological advancements and strategic investments within the industry are mitigating these challenges. Specific market segments such as those focusing on human consumption and animal feed show strong potential. Leading companies like Sensus, Tereos, Lantmännen, AGRANA, and Roquette are capitalizing on these trends through strategic partnerships, product diversification, and expansion into new markets. The industry’s performance within specific European nations— including Germany, France, Italy, the UK, Netherlands, and Sweden — will vary based on individual consumer preferences, local agricultural policies, and economic conditions. The forecast for 2025-2033 predicts continued expansion, solidifying the European pea industry's position as a key player in the global plant-based protein market.
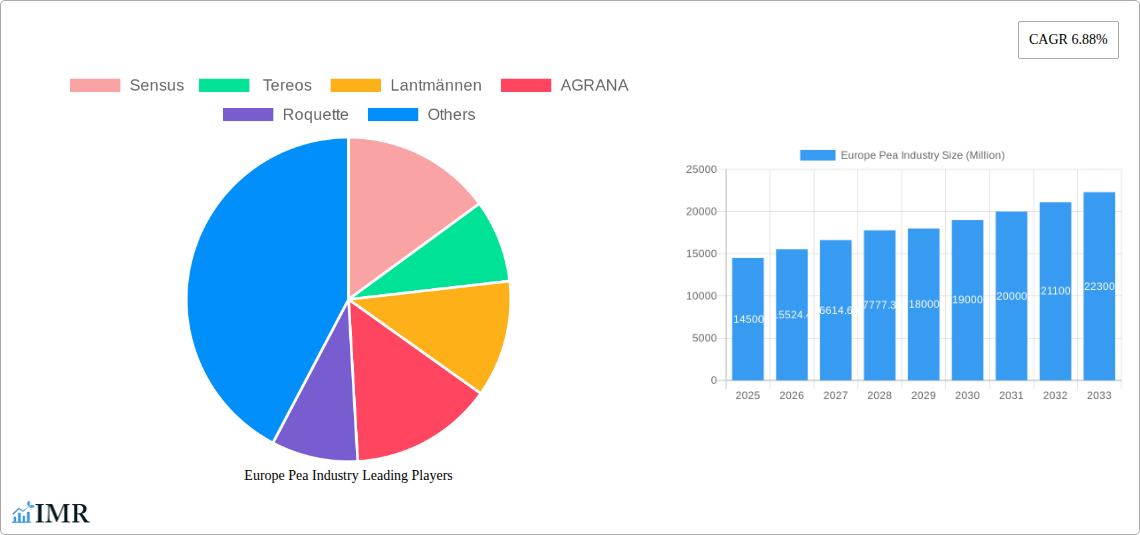
Europe Pea Industry Market Size (In Billion)
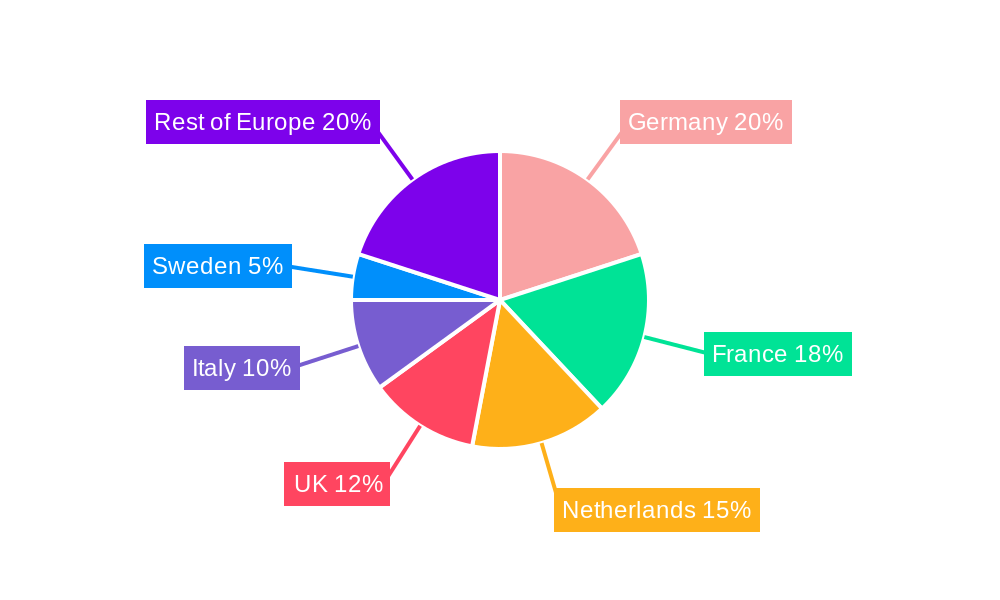
The geographical distribution of market share within Europe will reflect established agricultural strengths in specific countries. Germany, France, and the Netherlands, for instance, are likely to maintain significant market share due to established agricultural infrastructure and high production volumes. However, other countries such as Italy, the UK, and Sweden could exhibit varying rates of growth depending on internal market dynamics and government support for the agricultural sector. The price trends across major European producing countries like Ukraine, France, and Spain will be influenced by factors such as harvest yields, global demand, and geopolitical events. While the impact of these factors is complex and challenging to predict precisely, ongoing analysis of these dynamic variables is vital for understanding the overall financial health and future trajectory of the European pea industry. The study period of 2019-2033, encompassing both historical and forecast data, provides a comprehensive picture of market evolution, allowing for informed decision-making by industry stakeholders.
Europe Pea Industry Company Market Share
Europe Pea Industry: A Comprehensive Market Report (2019-2033)
This in-depth report provides a comprehensive analysis of the Europe pea industry, encompassing market dynamics, growth trends, regional performance, and key players. With a focus on the parent market of agricultural commodities and the child market of plant-based ingredients, this report is an essential resource for industry professionals, investors, and stakeholders seeking to understand the current landscape and future potential of this rapidly evolving sector. The study period covers 2019-2033, with a base year of 2025 and a forecast period of 2025-2033. The historical period analyzed is 2019-2024. Market values are presented in million units.
Europe Pea Industry Market Dynamics & Structure
The European pea industry is characterized by moderate market concentration, with key players like Roquette, Roquette, Lantmännen, Lantmännen, AGRANA, Tereos, and Sensus holding significant market share. Technological innovation, particularly in pea protein extraction and processing, is a major driver, though barriers remain in scaling up sustainable and cost-effective solutions. Regulatory frameworks concerning food safety and labeling influence market dynamics. Competitive substitutes include other legume-based proteins and traditional animal proteins. End-user demographics show growing demand for plant-based alternatives, fueling market expansion. M&A activity in the sector has been moderate, with xx deals recorded between 2019 and 2024, reflecting strategic consolidation efforts.
- Market Concentration: Moderately concentrated, with top 5 players holding approximately xx% market share.
- Technological Innovation: Focus on improving protein extraction efficiency and developing new pea-based ingredients.
- Regulatory Framework: EU food safety regulations and labeling requirements impact market access and product development.
- Competitive Substitutes: Soy protein, other legume proteins, and animal proteins.
- End-User Demographics: Increasing demand from vegan, vegetarian, and flexitarian consumers.
- M&A Activity: xx deals recorded between 2019 and 2024, driven by strategic consolidation and expansion.
Europe Pea Industry Growth Trends & Insights
The European pea industry experienced robust growth during the historical period (2019-2024), with a Compound Annual Growth Rate (CAGR) of xx%. Market size reached xx million units in 2024. This growth is attributed to several factors, including increasing consumer demand for plant-based foods, technological advancements in pea protein production, and supportive government policies promoting sustainable agriculture. Market penetration of pea-based products in various food applications has significantly increased, reaching xx% in 2024. Technological disruptions, like improved extraction methods and the development of novel pea-based ingredients, further fueled this growth. Changing consumer behaviors, driven by health consciousness and environmental concerns, are expected to propel the market in the forecast period. The projected CAGR for 2025-2033 is xx%, with an estimated market size of xx million units in 2033.
Dominant Regions, Countries, or Segments in Europe Pea Industry
France, Spain, and the Netherlands are currently the leading pea-producing and consuming countries in Europe, with France holding the largest market share due to favorable climatic conditions and established agricultural infrastructure. However, Eastern European countries show significant growth potential due to increasing arable land and government support for agriculture.
Russia: Production Analysis: Russia's pea production experienced fluctuations between 2019 and 2024, averaging xx million units annually.
Price Trend Analysis: Ukraine, France, Spain, Netherlands, and Rest of Europe show varying price trends reflecting seasonal factors and global demand. Average price fluctuations in Ukraine are higher due to geopolitical instability.
- France: Largest market share due to favorable climate and agricultural infrastructure.
- Spain: Strong growth potential due to increasing demand for plant-based foods.
- Netherlands: Well-developed agricultural sector and strong export capabilities.
- Eastern Europe: Emerging market with high growth potential due to increased arable land and government support.
- Key Drivers: Favorable climate, established agricultural infrastructure, supportive government policies, and growing demand for plant-based foods.
Europe Pea Industry Product Landscape
The European pea industry offers a diverse product range, including whole peas, split peas, pea flour, pea protein isolates and concentrates, and pea starch. Recent innovations focus on enhancing the functionality and nutritional value of pea-based ingredients, meeting diverse consumer needs. Technological advancements in extraction and processing methods are key to unlocking new applications and improving product quality. Unique selling propositions include high protein content, hypoallergenic properties, and sustainability credentials.
Key Drivers, Barriers & Challenges in Europe Pea Industry
Key Drivers:
- Growing consumer demand for plant-based protein sources.
- Technological advancements leading to improved efficiency and cost-effectiveness.
- Government policies promoting sustainable agriculture and plant-based food production.
Challenges & Restraints:
- Fluctuations in raw material prices due to weather conditions and global supply chain issues.
- Competition from established protein sources like soy and other legumes.
- Regulatory hurdles related to food safety and labeling requirements. These lead to approximately xx million units of lost potential sales annually.
Emerging Opportunities in Europe Pea Industry
- Expansion into new food applications, such as meat alternatives and dairy substitutes.
- Development of novel pea-based ingredients with enhanced functionality and nutritional value.
- Exploring untapped markets in Eastern Europe and other regions.
- Leveraging the growing interest in sustainable and ethical sourcing.
Growth Accelerators in the Europe Pea Industry Industry
Long-term growth will be fueled by continued technological advancements in pea protein extraction and processing, the development of innovative pea-based products meeting diverse consumer preferences, strategic partnerships between food manufacturers and pea processors, and expansion into new geographic markets.
Key Players Shaping the Europe Pea Industry Market
Notable Milestones in Europe Pea Industry Sector
- October 2022: Roquette launched a new line of organic pea ingredients.
- September 2022: Lantmännen invested USD 95.7 million in a new pea protein production facility.
- May 2022: China and Russia signed a phytosanitary protocol for peas, potentially increasing competition for Canadian exporters.
In-Depth Europe Pea Industry Market Outlook
The European pea industry is poised for sustained growth driven by several factors, including the increasing demand for plant-based protein and innovative product development. Strategic partnerships and investments in technological advancements will further fuel market expansion. The market’s future potential is significant, presenting substantial opportunities for businesses involved in the production, processing, and marketing of pea-based products. The market is expected to reach xx million units by 2033, presenting attractive investment opportunities for new market entrants and existing players.
Europe Pea Industry Segmentation
-
1. Russia
-
1.1. Production Analysis
- 1.1.1. Consumption Analysis and Market Value
- 1.1.2. Import Market Analysis (Volume and Value)
- 1.1.3. Export Market Analysis (Volume and Value)
- 1.1.4. Price Trend Analysis
- 1.2. Ukraine
- 1.3. France
- 1.4. Spain
- 1.5. Netherlands
- 1.6. Rest of Europe
-
1.1. Production Analysis
-
2. Russia
-
2.1. Production Analysis
- 2.1.1. Consumption Analysis and Market Value
- 2.1.2. Import Market Analysis (Volume and Value)
- 2.1.3. Export Market Analysis (Volume and Value)
- 2.1.4. Price Trend Analysis
- 2.2. Ukraine
- 2.3. France
- 2.4. Spain
- 2.5. Netherlands
- 2.6. Rest of Europe
-
2.1. Production Analysis
Europe Pea Industry Segmentation By Geography
-
1. Europe
- 1.1. United Kingdom
- 1.2. Germany
- 1.3. France
- 1.4. Italy
- 1.5. Spain
- 1.6. Netherlands
- 1.7. Belgium
- 1.8. Sweden
- 1.9. Norway
- 1.10. Poland
- 1.11. Denmark
Europe Pea Industry Regional Market Share
Geographic Coverage of Europe Pea Industry
Europe Pea Industry REPORT HIGHLIGHTS
| Aspects | Details |
|---|---|
| Study Period | 2020-2034 |
| Base Year | 2025 |
| Estimated Year | 2026 |
| Forecast Period | 2026-2034 |
| Historical Period | 2020-2025 |
| Growth Rate | CAGR of 6.88% from 2020-2034 |
| Segmentation |
|
Table of Contents
- 1. Introduction
- 1.1. Research Scope
- 1.2. Market Segmentation
- 1.3. Research Objective
- 1.4. Definitions and Assumptions
- 2. Executive Summary
- 2.1. Market Snapshot
- 3. Market Dynamics
- 3.1. Market Drivers
- 3.2. Market Restrains
- 3.3. Market Trends
- 3.4. Market Opportunities
- 4. Market Factor Analysis
- 4.1. Porters Five Forces
- 4.1.1. Bargaining Power of Suppliers
- 4.1.2. Bargaining Power of Buyers
- 4.1.3. Threat of New Entrants
- 4.1.4. Threat of Substitutes
- 4.1.5. Competitive Rivalry
- 4.2. PESTEL analysis
- 4.3. BCG Analysis
- 4.3.1. Stars (High Growth, High Market Share)
- 4.3.2. Cash Cows (Low Growth, High Market Share)
- 4.3.3. Question Mark (High Growth, Low Market Share)
- 4.3.4. Dogs (Low Growth, Low Market Share)
- 4.4. Ansoff Matrix Analysis
- 4.5. Supply Chain Analysis
- 4.6. Regulatory Landscape
- 4.7. Current Market Potential and Opportunity Assessment (TAM–SAM–SOM Framework)
- 4.8. IMR Analyst Note
- 4.1. Porters Five Forces
- 5. Market Analysis, Insights and Forecast 2021-2033
- 5.1. Market Analysis, Insights and Forecast - by Russia
- 5.1.1. Production Analysis
- 5.1.1.1. Consumption Analysis and Market Value
- 5.1.1.2. Import Market Analysis (Volume and Value)
- 5.1.1.3. Export Market Analysis (Volume and Value)
- 5.1.1.4. Price Trend Analysis
- 5.1.2. Ukraine
- 5.1.3. France
- 5.1.4. Spain
- 5.1.5. Netherlands
- 5.1.6. Rest of Europe
- 5.1.1. Production Analysis
- 5.2. Market Analysis, Insights and Forecast - by Russia
- 5.2.1. Production Analysis
- 5.2.1.1. Consumption Analysis and Market Value
- 5.2.1.2. Import Market Analysis (Volume and Value)
- 5.2.1.3. Export Market Analysis (Volume and Value)
- 5.2.1.4. Price Trend Analysis
- 5.2.2. Ukraine
- 5.2.3. France
- 5.2.4. Spain
- 5.2.5. Netherlands
- 5.2.6. Rest of Europe
- 5.2.1. Production Analysis
- 5.3. Market Analysis, Insights and Forecast - by Region
- 5.3.1. Europe
- 5.1. Market Analysis, Insights and Forecast - by Russia
- 6. Europe Pea Industry Analysis, Insights and Forecast, 2021-2033
- 6.1. Market Analysis, Insights and Forecast - by Russia
- 6.1.1. Production Analysis
- 6.1.1.1. Consumption Analysis and Market Value
- 6.1.1.2. Import Market Analysis (Volume and Value)
- 6.1.1.3. Export Market Analysis (Volume and Value)
- 6.1.1.4. Price Trend Analysis
- 6.1.2. Ukraine
- 6.1.3. France
- 6.1.4. Spain
- 6.1.5. Netherlands
- 6.1.6. Rest of Europe
- 6.1.1. Production Analysis
- 6.2. Market Analysis, Insights and Forecast - by Russia
- 6.2.1. Production Analysis
- 6.2.1.1. Consumption Analysis and Market Value
- 6.2.1.2. Import Market Analysis (Volume and Value)
- 6.2.1.3. Export Market Analysis (Volume and Value)
- 6.2.1.4. Price Trend Analysis
- 6.2.2. Ukraine
- 6.2.3. France
- 6.2.4. Spain
- 6.2.5. Netherlands
- 6.2.6. Rest of Europe
- 6.2.1. Production Analysis
- 6.1. Market Analysis, Insights and Forecast - by Russia
- 7. Competitive Analysis
- 7.1. Company Profiles
- 7.1.1 Sensus
- 7.1.1.1. Company Overview
- 7.1.1.2. Products
- 7.1.1.3. Company Financials
- 7.1.1.4. SWOT Analysis
- 7.1.2 Tereos
- 7.1.2.1. Company Overview
- 7.1.2.2. Products
- 7.1.2.3. Company Financials
- 7.1.2.4. SWOT Analysis
- 7.1.3 Lantmännen
- 7.1.3.1. Company Overview
- 7.1.3.2. Products
- 7.1.3.3. Company Financials
- 7.1.3.4. SWOT Analysis
- 7.1.4 AGRANA
- 7.1.4.1. Company Overview
- 7.1.4.2. Products
- 7.1.4.3. Company Financials
- 7.1.4.4. SWOT Analysis
- 7.1.5 Roquette
- 7.1.5.1. Company Overview
- 7.1.5.2. Products
- 7.1.5.3. Company Financials
- 7.1.5.4. SWOT Analysis
- 7.1.1 Sensus
- 7.2. Market Entropy
- 7.2.1 Company's Key Areas Served
- 7.2.2 Recent Developments
- 7.3. Company Market Share Analysis 2025
- 7.3.1 Top 5 Companies Market Share Analysis
- 7.3.2 Top 3 Companies Market Share Analysis
- 7.4. List of Potential Customers
- 8. Research Methodology
List of Figures
- Figure 1: Europe Pea Industry Revenue Breakdown (Million, %) by Product 2025 & 2033
- Figure 2: Europe Pea Industry Share (%) by Company 2025
List of Tables
- Table 1: Europe Pea Industry Revenue Million Forecast, by Russia 2020 & 2033
- Table 2: Europe Pea Industry Volume million units Forecast, by Russia 2020 & 2033
- Table 3: Europe Pea Industry Revenue Million Forecast, by Russia 2020 & 2033
- Table 4: Europe Pea Industry Volume million units Forecast, by Russia 2020 & 2033
- Table 5: Europe Pea Industry Revenue Million Forecast, by Region 2020 & 2033
- Table 6: Europe Pea Industry Volume million units Forecast, by Region 2020 & 2033
- Table 7: Europe Pea Industry Revenue Million Forecast, by Russia 2020 & 2033
- Table 8: Europe Pea Industry Volume million units Forecast, by Russia 2020 & 2033
- Table 9: Europe Pea Industry Revenue Million Forecast, by Russia 2020 & 2033
- Table 10: Europe Pea Industry Volume million units Forecast, by Russia 2020 & 2033
- Table 11: Europe Pea Industry Revenue Million Forecast, by Country 2020 & 2033
- Table 12: Europe Pea Industry Volume million units Forecast, by Country 2020 & 2033
- Table 13: United Kingdom Europe Pea Industry Revenue (Million) Forecast, by Application 2020 & 2033
- Table 14: United Kingdom Europe Pea Industry Volume (million units) Forecast, by Application 2020 & 2033
- Table 15: Germany Europe Pea Industry Revenue (Million) Forecast, by Application 2020 & 2033
- Table 16: Germany Europe Pea Industry Volume (million units) Forecast, by Application 2020 & 2033
- Table 17: France Europe Pea Industry Revenue (Million) Forecast, by Application 2020 & 2033
- Table 18: France Europe Pea Industry Volume (million units) Forecast, by Application 2020 & 2033
- Table 19: Italy Europe Pea Industry Revenue (Million) Forecast, by Application 2020 & 2033
- Table 20: Italy Europe Pea Industry Volume (million units) Forecast, by Application 2020 & 2033
- Table 21: Spain Europe Pea Industry Revenue (Million) Forecast, by Application 2020 & 2033
- Table 22: Spain Europe Pea Industry Volume (million units) Forecast, by Application 2020 & 2033
- Table 23: Netherlands Europe Pea Industry Revenue (Million) Forecast, by Application 2020 & 2033
- Table 24: Netherlands Europe Pea Industry Volume (million units) Forecast, by Application 2020 & 2033
- Table 25: Belgium Europe Pea Industry Revenue (Million) Forecast, by Application 2020 & 2033
- Table 26: Belgium Europe Pea Industry Volume (million units) Forecast, by Application 2020 & 2033
- Table 27: Sweden Europe Pea Industry Revenue (Million) Forecast, by Application 2020 & 2033
- Table 28: Sweden Europe Pea Industry Volume (million units) Forecast, by Application 2020 & 2033
- Table 29: Norway Europe Pea Industry Revenue (Million) Forecast, by Application 2020 & 2033
- Table 30: Norway Europe Pea Industry Volume (million units) Forecast, by Application 2020 & 2033
- Table 31: Poland Europe Pea Industry Revenue (Million) Forecast, by Application 2020 & 2033
- Table 32: Poland Europe Pea Industry Volume (million units) Forecast, by Application 2020 & 2033
- Table 33: Denmark Europe Pea Industry Revenue (Million) Forecast, by Application 2020 & 2033
- Table 34: Denmark Europe Pea Industry Volume (million units) Forecast, by Application 2020 & 2033
Frequently Asked Questions
1. What is the projected Compound Annual Growth Rate (CAGR) of the Europe Pea Industry?
The projected CAGR is approximately 6.88%.
2. Which companies are prominent players in the Europe Pea Industry?
Key companies in the market include Sensus, Tereos , Lantmännen , AGRANA, Roquette .
3. What are the main segments of the Europe Pea Industry?
The market segments include Russia, Russia.
4. Can you provide details about the market size?
The market size is estimated to be USD 14.50 Million as of 2022.
5. What are some drivers contributing to market growth?
Rising Consumption of Cashew Nuts in the Country; Favorable Government Initiatives.
6. What are the notable trends driving market growth?
Growing Export Opportunity.
7. Are there any restraints impacting market growth?
Hazardous Climatic Condition Hinders Cashew Production; Stringent Regulations Related to Food Quality Standards.
8. Can you provide examples of recent developments in the market?
October 2022: Roquette, a global leader in plant-based ingredients and a pioneer of plant proteins, launched a new line of organic pea ingredients: organic pea starch and organic pea protein to the Europe market.
9. What pricing options are available for accessing the report?
Pricing options include single-user, multi-user, and enterprise licenses priced at USD 4750, USD 4950, and USD 6800 respectively.
10. Is the market size provided in terms of value or volume?
The market size is provided in terms of value, measured in Million and volume, measured in million units.
11. Are there any specific market keywords associated with the report?
Yes, the market keyword associated with the report is "Europe Pea Industry," which aids in identifying and referencing the specific market segment covered.
12. How do I determine which pricing option suits my needs best?
The pricing options vary based on user requirements and access needs. Individual users may opt for single-user licenses, while businesses requiring broader access may choose multi-user or enterprise licenses for cost-effective access to the report.
13. Are there any additional resources or data provided in the Europe Pea Industry report?
While the report offers comprehensive insights, it's advisable to review the specific contents or supplementary materials provided to ascertain if additional resources or data are available.
14. How can I stay updated on further developments or reports in the Europe Pea Industry?
To stay informed about further developments, trends, and reports in the Europe Pea Industry, consider subscribing to industry newsletters, following relevant companies and organizations, or regularly checking reputable industry news sources and publications.
Methodology
Step 1 - Identification of Relevant Samples Size from Population Database


Step 2 - Approaches for Defining Global Market Size (Value, Volume* & Price*)

Note*: In applicable scenarios
Step 3 - Data Sources
Primary Research
- Web Analytics
- Survey Reports
- Research Institute
- Latest Research Reports
- Opinion Leaders
Secondary Research
- Annual Reports
- White Paper
- Latest Press Release
- Industry Association
- Paid Database
- Investor Presentations

Step 4 - Data Triangulation
Involves using different sources of information in order to increase the validity of a study
These sources are likely to be stakeholders in a program - participants, other researchers, program staff, other community members, and so on.
Then we put all data in single framework & apply various statistical tools to find out the dynamic on the market.
During the analysis stage, feedback from the stakeholder groups would be compared to determine areas of agreement as well as areas of divergence