

Key Insights
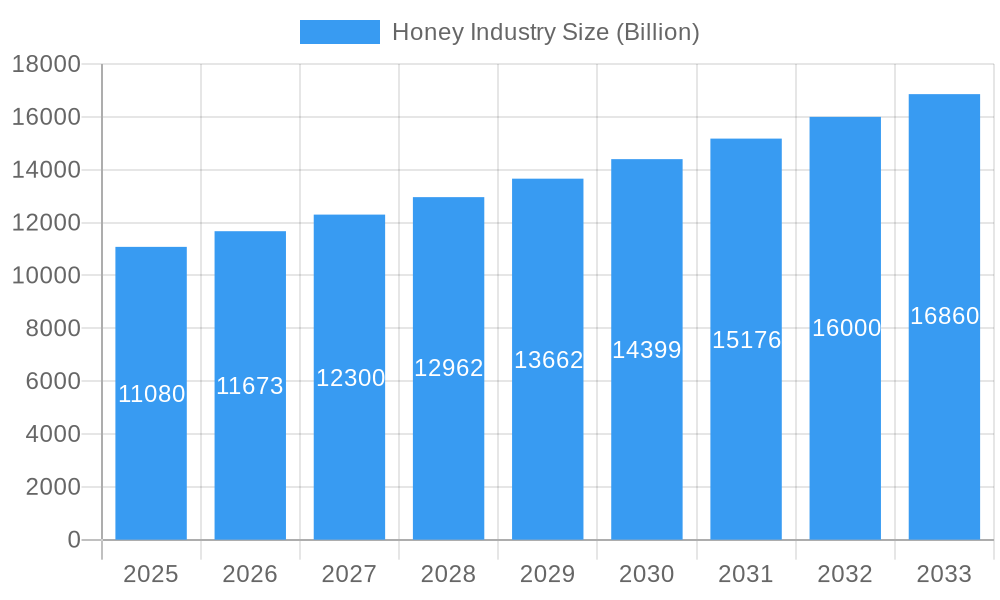
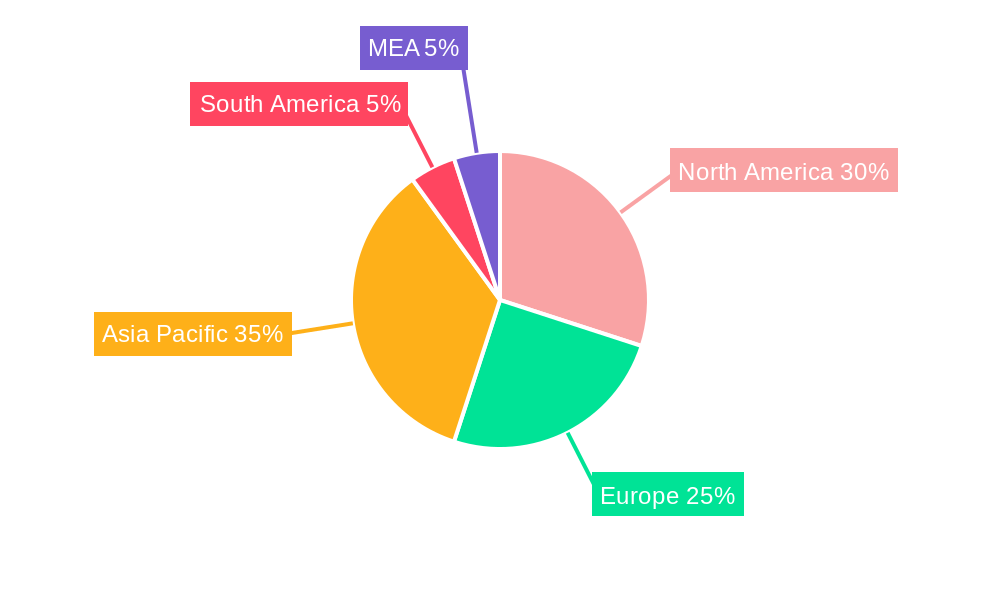
The global honey market, valued at $11.08 billion in 2025, is projected to experience robust growth, driven by rising consumer awareness of honey's health benefits and its versatile applications in food and beverages, pharmaceuticals, and cosmetics. The market's Compound Annual Growth Rate (CAGR) of 5.20% from 2025 to 2033 indicates a significant expansion in market size over the forecast period. Key growth drivers include the increasing preference for natural and organic sweeteners, the rising popularity of honey-based functional foods and beverages, and the expanding use of honey in skincare and personal care products. Significant market segmentation exists across honey types (raw, filtered, flavored, organic, Manuka), distribution channels (retail, online, bulk), and end-users (households, food manufacturers, pharmaceutical industry). While challenges such as fluctuating honey production due to climate change and adulteration concerns exist, the overall market outlook remains positive, particularly in regions with high consumer disposable income and a growing health-conscious population. North America and Europe currently hold substantial market shares, but the Asia-Pacific region is poised for significant growth due to increasing urbanization, rising middle-class incomes, and a growing demand for natural food products. Leading companies like Dabur Honey, Patanjali Ayurved, and Al Kabeer Exports are strategically investing in product diversification, brand building, and expanding distribution networks to capitalize on the market's growth potential.
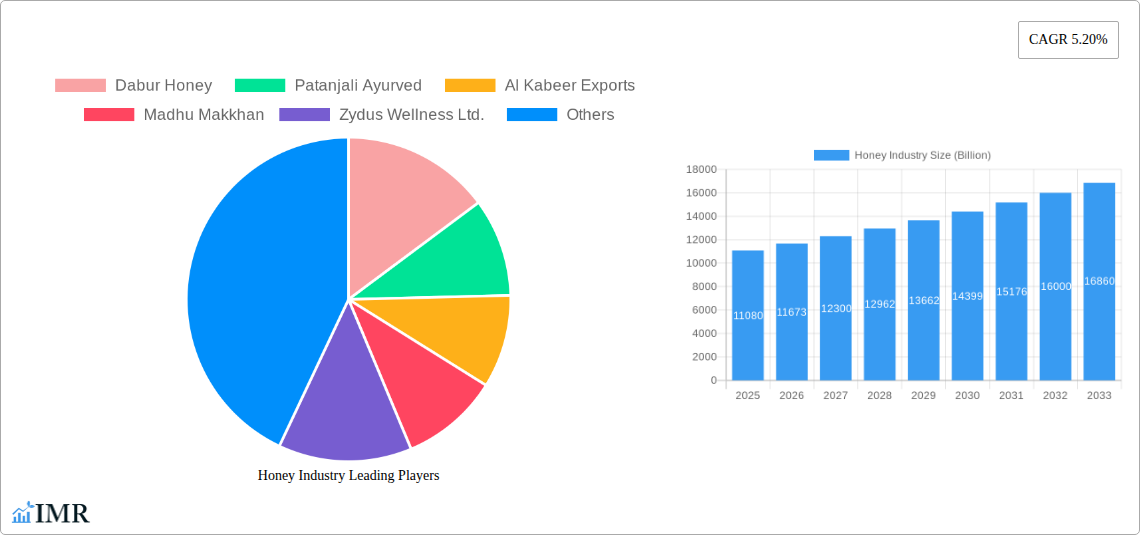
Honey Industry Market Size (In Billion)
The competitive landscape is characterized by both large multinational corporations and smaller, regional producers. Successful players are focusing on premium honey varieties, like Manuka honey, which command higher prices and cater to consumers seeking high-quality, specialized products. Furthermore, the rise of e-commerce platforms has opened new avenues for honey sales, reaching broader consumer bases and offering improved convenience. Future market growth will depend on factors such as sustainable honey production practices, stringent quality control measures to address adulteration issues, and innovative product development to meet the evolving consumer preferences for functional and convenient honey products. The continued focus on health and wellness, coupled with rising disposable incomes globally, suggests the honey market will maintain a strong growth trajectory for the foreseeable future.
Honey Industry Company Market Share
Honey Industry Market Report: 2019-2033
This comprehensive report provides an in-depth analysis of the global honey industry, encompassing market dynamics, growth trends, regional dominance, product landscapes, and key players. With a focus on the parent market (food and beverage) and child market (natural sweeteners), this report offers actionable insights for industry professionals, investors, and stakeholders seeking to navigate this evolving landscape. The study period covers 2019-2033, with a base year of 2025 and a forecast period of 2025-2033. Market values are presented in billions of USD.
Honey Industry Market Dynamics & Structure
The honey industry is characterized by a moderately fragmented market structure, with a mix of large multinational corporations and smaller regional players. Market concentration is influenced by factors such as production capacity, distribution networks, and brand recognition. Technological innovations, particularly in beekeeping practices and honey processing, are driving efficiency gains and product diversification. Stringent regulatory frameworks governing food safety and quality standards play a vital role. Competitive substitutes include artificial sweeteners and other natural sweeteners like maple syrup and agave nectar. End-user demographics are expanding, with increasing demand from health-conscious consumers driving growth in organic and specialty honey segments. M&A activity is moderate, with larger companies acquiring smaller players to expand their market share and product portfolios.
- Market Concentration: Moderately Fragmented (xx%)
- Technological Innovation Drivers: Improved beekeeping techniques, automated processing, quality control advancements.
- Regulatory Frameworks: Stringent food safety regulations, labeling requirements.
- Competitive Product Substitutes: Artificial sweeteners (market size: xx Billion), Maple syrup (market size: xx Billion), Agave nectar (market size: xx Billion).
- End-User Demographics: Growing health consciousness among consumers (xx% growth in organic honey demand)
- M&A Trends: Moderate activity, focused on expanding market reach and product lines (xx deals in the past 5 years).
Honey Industry Growth Trends & Insights
The global honey market has witnessed consistent growth over the historical period (2019-2024), driven by rising consumer awareness of honey’s health benefits and increasing demand for natural sweeteners. The market is expected to exhibit a Compound Annual Growth Rate (CAGR) of xx% during the forecast period (2025-2033), reaching a market size of xx Billion by 2033. Technological disruptions in beekeeping and processing have improved efficiency and product quality, while changing consumer preferences towards organic and specialty honey varieties are influencing market segmentation. Market penetration of organic honey is gradually increasing, driven by growing consumer preference for natural and sustainable products.
Dominant Regions, Countries, or Segments in Honey Industry
The Asia-Pacific region dominates the global honey market, with significant contributions from countries like India and China. High honey consumption, coupled with a large and growing population, fuels this dominance. Within honey types, raw honey and organic honey exhibit the highest growth potential, while flavored honey maintains a steady market share. The retail distribution channel continues to lead, followed by online sales, and bulk purchases by food manufacturers. Household consumption remains the largest end-user segment, followed by significant demand from the food manufacturing and pharmaceutical industries.
- Key Drivers:
- Asia-Pacific: High consumption rates, large population, increasing disposable incomes.
- Raw Honey: Perceived health benefits, purity.
- Organic Honey: Growing preference for natural and sustainable products.
- Retail Channel: Convenience, wide availability.
Honey Industry Product Landscape
The honey product landscape is characterized by a diverse range of offerings, including raw honey, filtered honey, flavored honey, organic honey, and specialty varieties like Manuka honey. Innovations focus on enhancing product quality, shelf life, and functionality. Unique selling propositions include certifications (organic, fair trade), unique flavor profiles (e.g., infused with spices or fruits), and health-related claims backed by scientific research.
Key Drivers, Barriers & Challenges in Honey Industry
Key Drivers:
- Rising consumer demand for natural sweeteners.
- Growing health consciousness and awareness of honey's nutritional value.
- Government initiatives promoting beekeeping and honey production (e.g., NBHM in India).
Key Challenges:
- Fluctuating honey production due to climate change and bee health issues.
- Adulteration and quality control concerns.
- Intense competition from artificial sweeteners and other natural alternatives.
- Supply chain inefficiencies resulting in price volatility.
Emerging Opportunities in Honey Industry
- Expanding into new markets with high growth potential.
- Developing innovative honey-based products (e.g., honey-infused beverages, cosmetics).
- Catering to evolving consumer preferences for convenience and on-the-go consumption.
Growth Accelerators in the Honey Industry
Technological advancements in beekeeping and honey processing are crucial for improving efficiency and product quality. Strategic partnerships between beekeepers, processors, and retailers can enhance supply chain management and market access. Expansion into new markets and diversification of product offerings are further vital for long-term growth.
Key Players Shaping the Honey Industry Market
- Dabur Honey
- Patanjali Ayurved
- Al Kabeer Exports
- Madhu Makkhan
- Zydus Wellness Ltd.
Notable Milestones in Honey Industry Sector
- August 2022: APEDA launched a project under AtmaNirbhar Bharat to boost honey production, with INR 500 crore (USD 60.5 million) allocated to NBHM.
- May 2024: The Canadian government increased funding for the Honey Bee Health Initiative by USD 1 million to improve beekeeper operations.
In-Depth Honey Industry Market Outlook
The global honey market is poised for continued growth, driven by strong consumer demand, technological advancements, and supportive government policies. Strategic investments in sustainable beekeeping practices, product diversification, and effective marketing initiatives will be critical for success in this dynamic market. Opportunities abound for companies to innovate and capture market share in niche segments and emerging markets.
Honey Industry Segmentation
- 1. Production Analysis
- 2. Consumption Analysis
- 3. Import Market Analysis (Value & Volume)
- 4. Export Market Analysis (Value & Volume)
- 5. Price Trend Analysis
Honey Industry Segmentation By Geography
-
1. North America
- 1.1. United States
- 1.2. Canada
- 1.3. Mexico
-
2. Europe
- 2.1. Spain
- 2.2. Ukraine
- 2.3. Poland
- 2.4. Germany
-
3. Asia Pacific
- 3.1. China
- 3.2. India
- 3.3. Japan
- 3.4. New Zealand
-
4. South America
- 4.1. Argentina
- 4.2. Brazil
-
5. Middle East and Africa
- 5.1. Turkey
- 5.2. Iran
Honey Industry Regional Market Share
Geographic Coverage of Honey Industry
Honey Industry REPORT HIGHLIGHTS
| Aspects | Details |
|---|---|
| Study Period | 2020-2034 |
| Base Year | 2025 |
| Estimated Year | 2026 |
| Forecast Period | 2026-2034 |
| Historical Period | 2020-2025 |
| Growth Rate | CAGR of 5.20% from 2020-2034 |
| Segmentation |
|
Table of Contents
- 1. Introduction
- 1.1. Research Scope
- 1.2. Market Segmentation
- 1.3. Research Objective
- 1.4. Definitions and Assumptions
- 2. Executive Summary
- 2.1. Market Snapshot
- 3. Market Dynamics
- 3.1. Market Drivers
- 3.2. Market Restrains
- 3.3. Market Trends
- 3.4. Market Opportunities
- 4. Market Factor Analysis
- 4.1. Porters Five Forces
- 4.1.1. Bargaining Power of Suppliers
- 4.1.2. Bargaining Power of Buyers
- 4.1.3. Threat of New Entrants
- 4.1.4. Threat of Substitutes
- 4.1.5. Competitive Rivalry
- 4.2. PESTEL analysis
- 4.3. BCG Analysis
- 4.3.1. Stars (High Growth, High Market Share)
- 4.3.2. Cash Cows (Low Growth, High Market Share)
- 4.3.3. Question Mark (High Growth, Low Market Share)
- 4.3.4. Dogs (Low Growth, Low Market Share)
- 4.4. Ansoff Matrix Analysis
- 4.5. Supply Chain Analysis
- 4.6. Regulatory Landscape
- 4.7. Current Market Potential and Opportunity Assessment (TAM–SAM–SOM Framework)
- 4.8. IMR Analyst Note
- 4.1. Porters Five Forces
- 5. Market Analysis, Insights and Forecast 2021-2033
- 5.1. Market Analysis, Insights and Forecast - by Production Analysis
- 5.2. Market Analysis, Insights and Forecast - by Consumption Analysis
- 5.3. Market Analysis, Insights and Forecast - by Import Market Analysis (Value & Volume)
- 5.4. Market Analysis, Insights and Forecast - by Export Market Analysis (Value & Volume)
- 5.5. Market Analysis, Insights and Forecast - by Price Trend Analysis
- 5.6. Market Analysis, Insights and Forecast - by Region
- 5.6.1. North America
- 5.6.2. Europe
- 5.6.3. Asia Pacific
- 5.6.4. South America
- 5.6.5. Middle East and Africa
- 6. Global Honey Industry Analysis, Insights and Forecast, 2021-2033
- 6.1. Market Analysis, Insights and Forecast - by Production Analysis
- 6.2. Market Analysis, Insights and Forecast - by Consumption Analysis
- 6.3. Market Analysis, Insights and Forecast - by Import Market Analysis (Value & Volume)
- 6.4. Market Analysis, Insights and Forecast - by Export Market Analysis (Value & Volume)
- 6.5. Market Analysis, Insights and Forecast - by Price Trend Analysis
- 7. North America Honey Industry Analysis, Insights and Forecast, 2020-2032
- 7.1. Market Analysis, Insights and Forecast - by Production Analysis
- 7.2. Market Analysis, Insights and Forecast - by Consumption Analysis
- 7.3. Market Analysis, Insights and Forecast - by Import Market Analysis (Value & Volume)
- 7.4. Market Analysis, Insights and Forecast - by Export Market Analysis (Value & Volume)
- 7.5. Market Analysis, Insights and Forecast - by Price Trend Analysis
- 8. Europe Honey Industry Analysis, Insights and Forecast, 2020-2032
- 8.1. Market Analysis, Insights and Forecast - by Production Analysis
- 8.2. Market Analysis, Insights and Forecast - by Consumption Analysis
- 8.3. Market Analysis, Insights and Forecast - by Import Market Analysis (Value & Volume)
- 8.4. Market Analysis, Insights and Forecast - by Export Market Analysis (Value & Volume)
- 8.5. Market Analysis, Insights and Forecast - by Price Trend Analysis
- 9. Asia Pacific Honey Industry Analysis, Insights and Forecast, 2020-2032
- 9.1. Market Analysis, Insights and Forecast - by Production Analysis
- 9.2. Market Analysis, Insights and Forecast - by Consumption Analysis
- 9.3. Market Analysis, Insights and Forecast - by Import Market Analysis (Value & Volume)
- 9.4. Market Analysis, Insights and Forecast - by Export Market Analysis (Value & Volume)
- 9.5. Market Analysis, Insights and Forecast - by Price Trend Analysis
- 10. South America Honey Industry Analysis, Insights and Forecast, 2020-2032
- 10.1. Market Analysis, Insights and Forecast - by Production Analysis
- 10.2. Market Analysis, Insights and Forecast - by Consumption Analysis
- 10.3. Market Analysis, Insights and Forecast - by Import Market Analysis (Value & Volume)
- 10.4. Market Analysis, Insights and Forecast - by Export Market Analysis (Value & Volume)
- 10.5. Market Analysis, Insights and Forecast - by Price Trend Analysis
- 11. Middle East and Africa Honey Industry Analysis, Insights and Forecast, 2020-2032
- 11.1. Market Analysis, Insights and Forecast - by Production Analysis
- 11.2. Market Analysis, Insights and Forecast - by Consumption Analysis
- 11.3. Market Analysis, Insights and Forecast - by Import Market Analysis (Value & Volume)
- 11.4. Market Analysis, Insights and Forecast - by Export Market Analysis (Value & Volume)
- 11.5. Market Analysis, Insights and Forecast - by Price Trend Analysis
- 12. Competitive Analysis
- 12.1. Company Profiles
- 12.1.1 Dabur Honey
- 12.1.1.1. Company Overview
- 12.1.1.2. Products
- 12.1.1.3. Company Financials
- 12.1.1.4. SWOT Analysis
- 12.1.2 Patanjali Ayurved
- 12.1.2.1. Company Overview
- 12.1.2.2. Products
- 12.1.2.3. Company Financials
- 12.1.2.4. SWOT Analysis
- 12.1.3 Al Kabeer Exports
- 12.1.3.1. Company Overview
- 12.1.3.2. Products
- 12.1.3.3. Company Financials
- 12.1.3.4. SWOT Analysis
- 12.1.4 Madhu Makkhan
- 12.1.4.1. Company Overview
- 12.1.4.2. Products
- 12.1.4.3. Company Financials
- 12.1.4.4. SWOT Analysis
- 12.1.5 Zydus Wellness Ltd.
- 12.1.5.1. Company Overview
- 12.1.5.2. Products
- 12.1.5.3. Company Financials
- 12.1.5.4. SWOT Analysis
- 12.1.1 Dabur Honey
- 12.2. Market Entropy
- 12.2.1 Company's Key Areas Served
- 12.2.2 Recent Developments
- 12.3. Company Market Share Analysis 2025
- 12.3.1 Top 5 Companies Market Share Analysis
- 12.3.2 Top 3 Companies Market Share Analysis
- 12.4. List of Potential Customers
- 13. Research Methodology
List of Figures
- Figure 1: Global Honey Industry Revenue Breakdown (Billion, %) by Region 2025 & 2033
- Figure 2: North America Honey Industry Revenue (Billion), by Production Analysis 2025 & 2033
- Figure 3: North America Honey Industry Revenue Share (%), by Production Analysis 2025 & 2033
- Figure 4: North America Honey Industry Revenue (Billion), by Consumption Analysis 2025 & 2033
- Figure 5: North America Honey Industry Revenue Share (%), by Consumption Analysis 2025 & 2033
- Figure 6: North America Honey Industry Revenue (Billion), by Import Market Analysis (Value & Volume) 2025 & 2033
- Figure 7: North America Honey Industry Revenue Share (%), by Import Market Analysis (Value & Volume) 2025 & 2033
- Figure 8: North America Honey Industry Revenue (Billion), by Export Market Analysis (Value & Volume) 2025 & 2033
- Figure 9: North America Honey Industry Revenue Share (%), by Export Market Analysis (Value & Volume) 2025 & 2033
- Figure 10: North America Honey Industry Revenue (Billion), by Price Trend Analysis 2025 & 2033
- Figure 11: North America Honey Industry Revenue Share (%), by Price Trend Analysis 2025 & 2033
- Figure 12: North America Honey Industry Revenue (Billion), by Country 2025 & 2033
- Figure 13: North America Honey Industry Revenue Share (%), by Country 2025 & 2033
- Figure 14: Europe Honey Industry Revenue (Billion), by Production Analysis 2025 & 2033
- Figure 15: Europe Honey Industry Revenue Share (%), by Production Analysis 2025 & 2033
- Figure 16: Europe Honey Industry Revenue (Billion), by Consumption Analysis 2025 & 2033
- Figure 17: Europe Honey Industry Revenue Share (%), by Consumption Analysis 2025 & 2033
- Figure 18: Europe Honey Industry Revenue (Billion), by Import Market Analysis (Value & Volume) 2025 & 2033
- Figure 19: Europe Honey Industry Revenue Share (%), by Import Market Analysis (Value & Volume) 2025 & 2033
- Figure 20: Europe Honey Industry Revenue (Billion), by Export Market Analysis (Value & Volume) 2025 & 2033
- Figure 21: Europe Honey Industry Revenue Share (%), by Export Market Analysis (Value & Volume) 2025 & 2033
- Figure 22: Europe Honey Industry Revenue (Billion), by Price Trend Analysis 2025 & 2033
- Figure 23: Europe Honey Industry Revenue Share (%), by Price Trend Analysis 2025 & 2033
- Figure 24: Europe Honey Industry Revenue (Billion), by Country 2025 & 2033
- Figure 25: Europe Honey Industry Revenue Share (%), by Country 2025 & 2033
- Figure 26: Asia Pacific Honey Industry Revenue (Billion), by Production Analysis 2025 & 2033
- Figure 27: Asia Pacific Honey Industry Revenue Share (%), by Production Analysis 2025 & 2033
- Figure 28: Asia Pacific Honey Industry Revenue (Billion), by Consumption Analysis 2025 & 2033
- Figure 29: Asia Pacific Honey Industry Revenue Share (%), by Consumption Analysis 2025 & 2033
- Figure 30: Asia Pacific Honey Industry Revenue (Billion), by Import Market Analysis (Value & Volume) 2025 & 2033
- Figure 31: Asia Pacific Honey Industry Revenue Share (%), by Import Market Analysis (Value & Volume) 2025 & 2033
- Figure 32: Asia Pacific Honey Industry Revenue (Billion), by Export Market Analysis (Value & Volume) 2025 & 2033
- Figure 33: Asia Pacific Honey Industry Revenue Share (%), by Export Market Analysis (Value & Volume) 2025 & 2033
- Figure 34: Asia Pacific Honey Industry Revenue (Billion), by Price Trend Analysis 2025 & 2033
- Figure 35: Asia Pacific Honey Industry Revenue Share (%), by Price Trend Analysis 2025 & 2033
- Figure 36: Asia Pacific Honey Industry Revenue (Billion), by Country 2025 & 2033
- Figure 37: Asia Pacific Honey Industry Revenue Share (%), by Country 2025 & 2033
- Figure 38: South America Honey Industry Revenue (Billion), by Production Analysis 2025 & 2033
- Figure 39: South America Honey Industry Revenue Share (%), by Production Analysis 2025 & 2033
- Figure 40: South America Honey Industry Revenue (Billion), by Consumption Analysis 2025 & 2033
- Figure 41: South America Honey Industry Revenue Share (%), by Consumption Analysis 2025 & 2033
- Figure 42: South America Honey Industry Revenue (Billion), by Import Market Analysis (Value & Volume) 2025 & 2033
- Figure 43: South America Honey Industry Revenue Share (%), by Import Market Analysis (Value & Volume) 2025 & 2033
- Figure 44: South America Honey Industry Revenue (Billion), by Export Market Analysis (Value & Volume) 2025 & 2033
- Figure 45: South America Honey Industry Revenue Share (%), by Export Market Analysis (Value & Volume) 2025 & 2033
- Figure 46: South America Honey Industry Revenue (Billion), by Price Trend Analysis 2025 & 2033
- Figure 47: South America Honey Industry Revenue Share (%), by Price Trend Analysis 2025 & 2033
- Figure 48: South America Honey Industry Revenue (Billion), by Country 2025 & 2033
- Figure 49: South America Honey Industry Revenue Share (%), by Country 2025 & 2033
- Figure 50: Middle East and Africa Honey Industry Revenue (Billion), by Production Analysis 2025 & 2033
- Figure 51: Middle East and Africa Honey Industry Revenue Share (%), by Production Analysis 2025 & 2033
- Figure 52: Middle East and Africa Honey Industry Revenue (Billion), by Consumption Analysis 2025 & 2033
- Figure 53: Middle East and Africa Honey Industry Revenue Share (%), by Consumption Analysis 2025 & 2033
- Figure 54: Middle East and Africa Honey Industry Revenue (Billion), by Import Market Analysis (Value & Volume) 2025 & 2033
- Figure 55: Middle East and Africa Honey Industry Revenue Share (%), by Import Market Analysis (Value & Volume) 2025 & 2033
- Figure 56: Middle East and Africa Honey Industry Revenue (Billion), by Export Market Analysis (Value & Volume) 2025 & 2033
- Figure 57: Middle East and Africa Honey Industry Revenue Share (%), by Export Market Analysis (Value & Volume) 2025 & 2033
- Figure 58: Middle East and Africa Honey Industry Revenue (Billion), by Price Trend Analysis 2025 & 2033
- Figure 59: Middle East and Africa Honey Industry Revenue Share (%), by Price Trend Analysis 2025 & 2033
- Figure 60: Middle East and Africa Honey Industry Revenue (Billion), by Country 2025 & 2033
- Figure 61: Middle East and Africa Honey Industry Revenue Share (%), by Country 2025 & 2033
List of Tables
- Table 1: Global Honey Industry Revenue Billion Forecast, by Production Analysis 2020 & 2033
- Table 2: Global Honey Industry Revenue Billion Forecast, by Consumption Analysis 2020 & 2033
- Table 3: Global Honey Industry Revenue Billion Forecast, by Import Market Analysis (Value & Volume) 2020 & 2033
- Table 4: Global Honey Industry Revenue Billion Forecast, by Export Market Analysis (Value & Volume) 2020 & 2033
- Table 5: Global Honey Industry Revenue Billion Forecast, by Price Trend Analysis 2020 & 2033
- Table 6: Global Honey Industry Revenue Billion Forecast, by Region 2020 & 2033
- Table 7: Global Honey Industry Revenue Billion Forecast, by Production Analysis 2020 & 2033
- Table 8: Global Honey Industry Revenue Billion Forecast, by Consumption Analysis 2020 & 2033
- Table 9: Global Honey Industry Revenue Billion Forecast, by Import Market Analysis (Value & Volume) 2020 & 2033
- Table 10: Global Honey Industry Revenue Billion Forecast, by Export Market Analysis (Value & Volume) 2020 & 2033
- Table 11: Global Honey Industry Revenue Billion Forecast, by Price Trend Analysis 2020 & 2033
- Table 12: Global Honey Industry Revenue Billion Forecast, by Country 2020 & 2033
- Table 13: United States Honey Industry Revenue (Billion) Forecast, by Application 2020 & 2033
- Table 14: Canada Honey Industry Revenue (Billion) Forecast, by Application 2020 & 2033
- Table 15: Mexico Honey Industry Revenue (Billion) Forecast, by Application 2020 & 2033
- Table 16: Global Honey Industry Revenue Billion Forecast, by Production Analysis 2020 & 2033
- Table 17: Global Honey Industry Revenue Billion Forecast, by Consumption Analysis 2020 & 2033
- Table 18: Global Honey Industry Revenue Billion Forecast, by Import Market Analysis (Value & Volume) 2020 & 2033
- Table 19: Global Honey Industry Revenue Billion Forecast, by Export Market Analysis (Value & Volume) 2020 & 2033
- Table 20: Global Honey Industry Revenue Billion Forecast, by Price Trend Analysis 2020 & 2033
- Table 21: Global Honey Industry Revenue Billion Forecast, by Country 2020 & 2033
- Table 22: Spain Honey Industry Revenue (Billion) Forecast, by Application 2020 & 2033
- Table 23: Ukraine Honey Industry Revenue (Billion) Forecast, by Application 2020 & 2033
- Table 24: Poland Honey Industry Revenue (Billion) Forecast, by Application 2020 & 2033
- Table 25: Germany Honey Industry Revenue (Billion) Forecast, by Application 2020 & 2033
- Table 26: Global Honey Industry Revenue Billion Forecast, by Production Analysis 2020 & 2033
- Table 27: Global Honey Industry Revenue Billion Forecast, by Consumption Analysis 2020 & 2033
- Table 28: Global Honey Industry Revenue Billion Forecast, by Import Market Analysis (Value & Volume) 2020 & 2033
- Table 29: Global Honey Industry Revenue Billion Forecast, by Export Market Analysis (Value & Volume) 2020 & 2033
- Table 30: Global Honey Industry Revenue Billion Forecast, by Price Trend Analysis 2020 & 2033
- Table 31: Global Honey Industry Revenue Billion Forecast, by Country 2020 & 2033
- Table 32: China Honey Industry Revenue (Billion) Forecast, by Application 2020 & 2033
- Table 33: India Honey Industry Revenue (Billion) Forecast, by Application 2020 & 2033
- Table 34: Japan Honey Industry Revenue (Billion) Forecast, by Application 2020 & 2033
- Table 35: New Zealand Honey Industry Revenue (Billion) Forecast, by Application 2020 & 2033
- Table 36: Global Honey Industry Revenue Billion Forecast, by Production Analysis 2020 & 2033
- Table 37: Global Honey Industry Revenue Billion Forecast, by Consumption Analysis 2020 & 2033
- Table 38: Global Honey Industry Revenue Billion Forecast, by Import Market Analysis (Value & Volume) 2020 & 2033
- Table 39: Global Honey Industry Revenue Billion Forecast, by Export Market Analysis (Value & Volume) 2020 & 2033
- Table 40: Global Honey Industry Revenue Billion Forecast, by Price Trend Analysis 2020 & 2033
- Table 41: Global Honey Industry Revenue Billion Forecast, by Country 2020 & 2033
- Table 42: Argentina Honey Industry Revenue (Billion) Forecast, by Application 2020 & 2033
- Table 43: Brazil Honey Industry Revenue (Billion) Forecast, by Application 2020 & 2033
- Table 44: Global Honey Industry Revenue Billion Forecast, by Production Analysis 2020 & 2033
- Table 45: Global Honey Industry Revenue Billion Forecast, by Consumption Analysis 2020 & 2033
- Table 46: Global Honey Industry Revenue Billion Forecast, by Import Market Analysis (Value & Volume) 2020 & 2033
- Table 47: Global Honey Industry Revenue Billion Forecast, by Export Market Analysis (Value & Volume) 2020 & 2033
- Table 48: Global Honey Industry Revenue Billion Forecast, by Price Trend Analysis 2020 & 2033
- Table 49: Global Honey Industry Revenue Billion Forecast, by Country 2020 & 2033
- Table 50: Turkey Honey Industry Revenue (Billion) Forecast, by Application 2020 & 2033
- Table 51: Iran Honey Industry Revenue (Billion) Forecast, by Application 2020 & 2033
Frequently Asked Questions
1. What is the projected Compound Annual Growth Rate (CAGR) of the Honey Industry?
The projected CAGR is approximately 5.20%.
2. Which companies are prominent players in the Honey Industry?
Key companies in the market include Dabur Honey , Patanjali Ayurved , Al Kabeer Exports , Madhu Makkhan, Zydus Wellness Ltd. .
3. What are the main segments of the Honey Industry?
The market segments include Production Analysis, Consumption Analysis, Import Market Analysis (Value & Volume), Export Market Analysis (Value & Volume), Price Trend Analysis.
4. Can you provide details about the market size?
The market size is estimated to be USD 11.08 Billion as of 2022.
5. What are some drivers contributing to market growth?
Increasing Demand for Garlic Due to Various Uses in Industries; Rising Demad of Organic Garlic; Increasing Government Initiatives.
6. What are the notable trends driving market growth?
Increasing Demand for Natural Sweeteners with Health Benefits of Natural Honey.
7. Are there any restraints impacting market growth?
Lack of Technical Knowledge of Farmers; Price Fluctuations.
8. Can you provide examples of recent developments in the market?
May 2024: The government of Canada is increasing funding to the Honey Bee Health Initiative by up to USD 1 million to help improve the resiliency and competitiveness of beekeeper operations in Ontario. The additional funding will help more Ontario beekeepers better protect their colonies over the winter and protect against invasive pests such as varroa mites which pose a serious threat to honeybee health.
9. What pricing options are available for accessing the report?
Pricing options include single-user, multi-user, and enterprise licenses priced at USD 4750, USD 5250, and USD 8750 respectively.
10. Is the market size provided in terms of value or volume?
The market size is provided in terms of value, measured in Billion.
11. Are there any specific market keywords associated with the report?
Yes, the market keyword associated with the report is "Honey Industry," which aids in identifying and referencing the specific market segment covered.
12. How do I determine which pricing option suits my needs best?
The pricing options vary based on user requirements and access needs. Individual users may opt for single-user licenses, while businesses requiring broader access may choose multi-user or enterprise licenses for cost-effective access to the report.
13. Are there any additional resources or data provided in the Honey Industry report?
While the report offers comprehensive insights, it's advisable to review the specific contents or supplementary materials provided to ascertain if additional resources or data are available.
14. How can I stay updated on further developments or reports in the Honey Industry?
To stay informed about further developments, trends, and reports in the Honey Industry, consider subscribing to industry newsletters, following relevant companies and organizations, or regularly checking reputable industry news sources and publications.
Methodology
Step 1 - Identification of Relevant Samples Size from Population Database


Step 2 - Approaches for Defining Global Market Size (Value, Volume* & Price*)

Note*: In applicable scenarios
Step 3 - Data Sources
Primary Research
- Web Analytics
- Survey Reports
- Research Institute
- Latest Research Reports
- Opinion Leaders
Secondary Research
- Annual Reports
- White Paper
- Latest Press Release
- Industry Association
- Paid Database
- Investor Presentations

Step 4 - Data Triangulation
Involves using different sources of information in order to increase the validity of a study
These sources are likely to be stakeholders in a program - participants, other researchers, program staff, other community members, and so on.
Then we put all data in single framework & apply various statistical tools to find out the dynamic on the market.
During the analysis stage, feedback from the stakeholder groups would be compared to determine areas of agreement as well as areas of divergence