

Key Insights
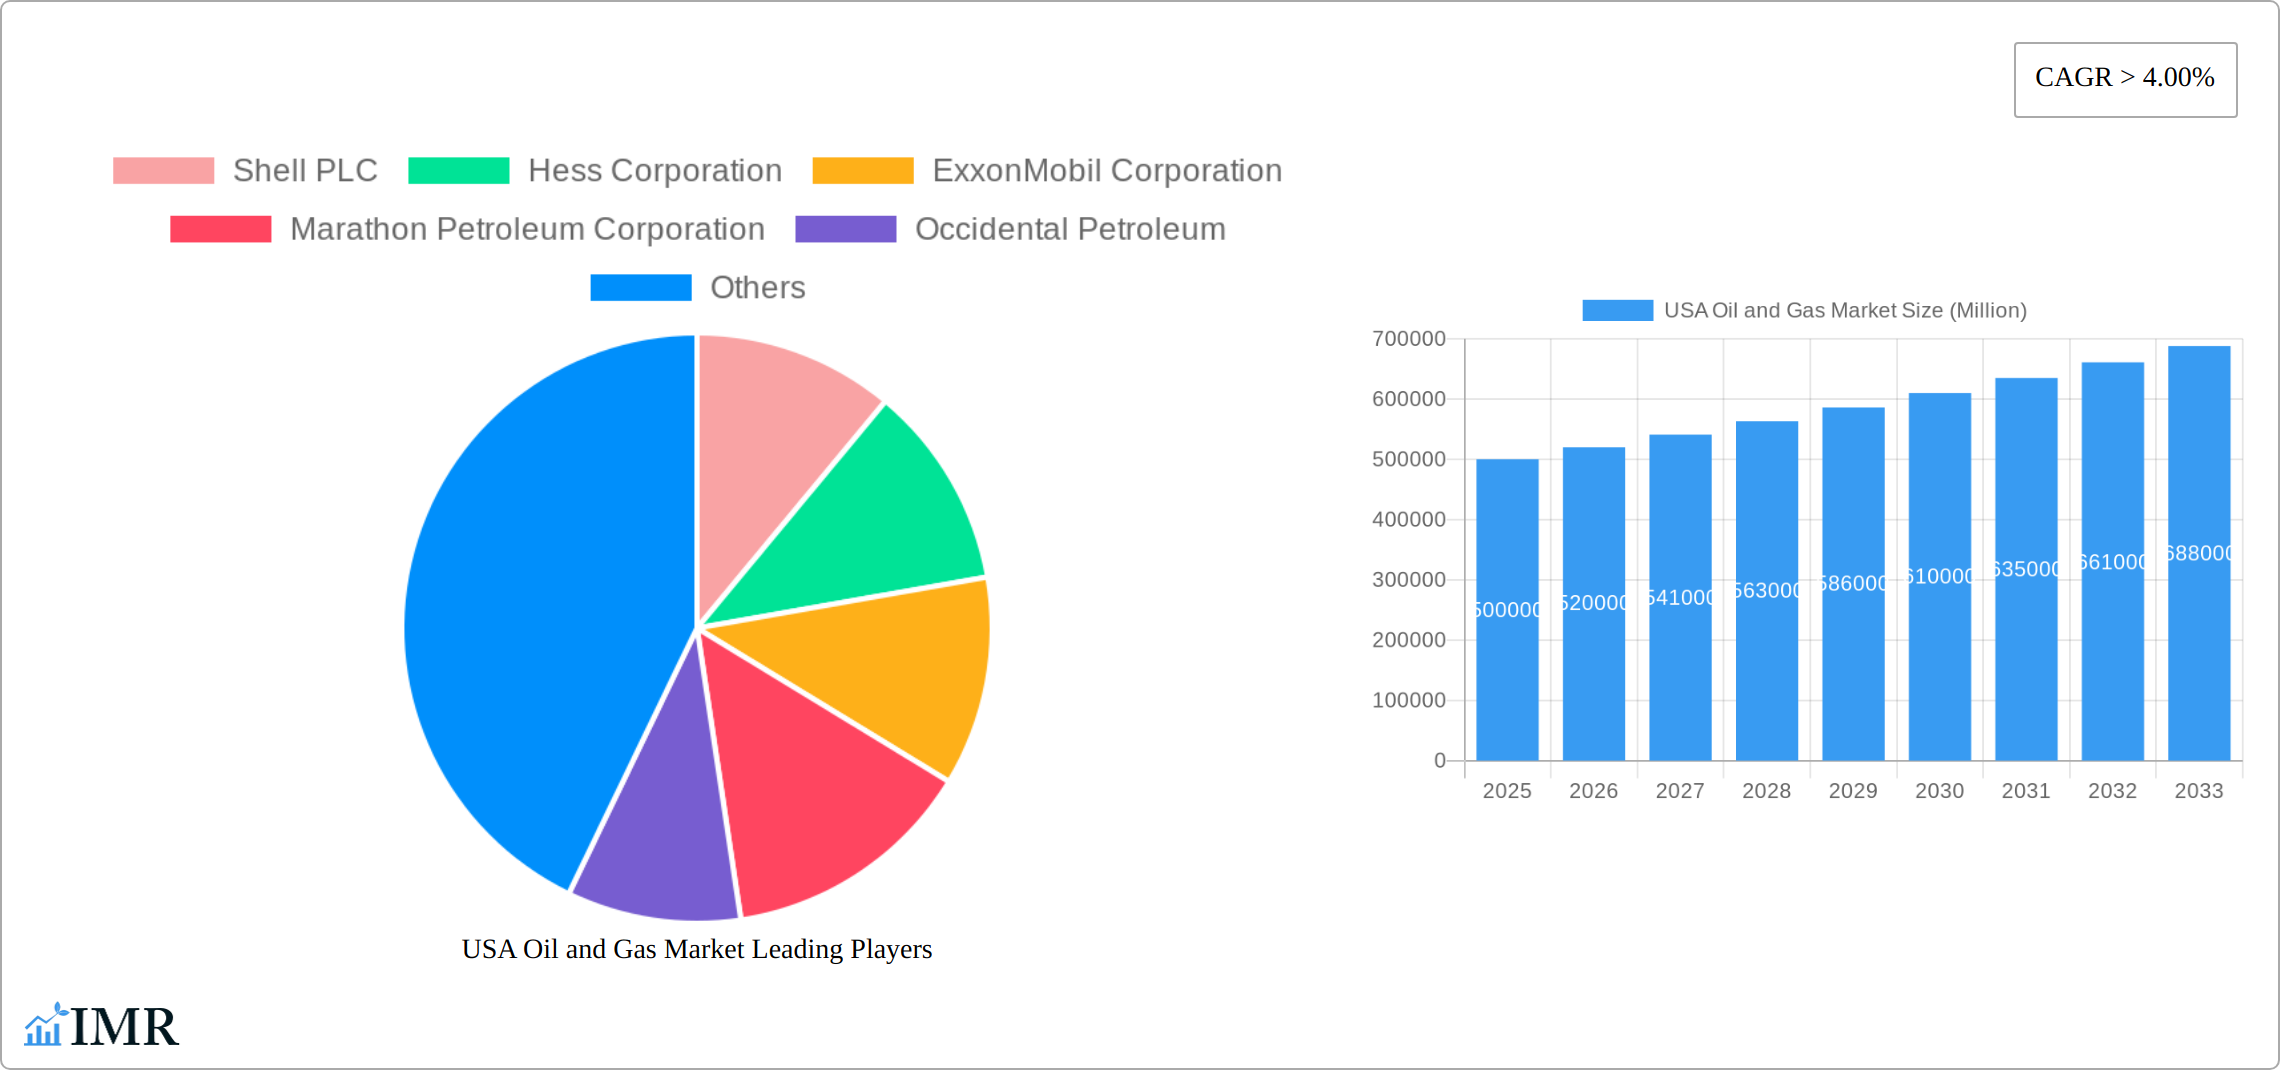
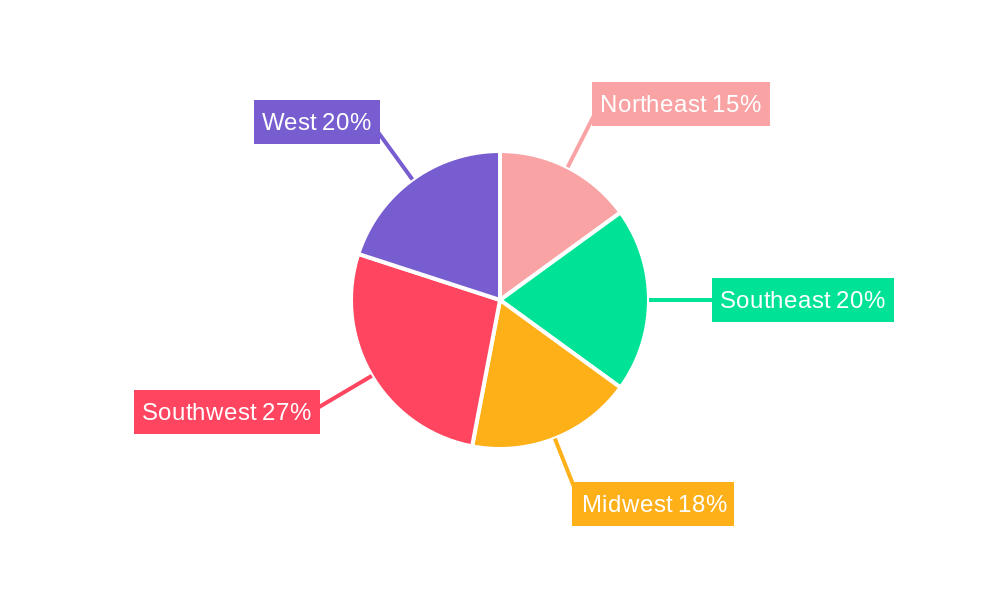
The US oil and gas market, valued at approximately $500 billion in 2025, is projected to experience robust growth, with a compound annual growth rate (CAGR) exceeding 4% from 2025 to 2033. This expansion is driven by several key factors. Increased industrial activity and a growing transportation sector, particularly in the burgeoning Southwest and West regions, fuel significant demand. Further, advancements in extraction technologies like hydraulic fracturing continue to enhance domestic production, bolstering market supply. However, the market faces constraints, including fluctuating global oil prices, increasing environmental regulations aimed at reducing carbon emissions, and ongoing efforts to transition towards renewable energy sources. The market is segmented by product type (crude oil, natural gas, refined products) and end-use sector (industrial, commercial, residential, transportation). The industrial sector, encompassing manufacturing and power generation, represents the largest share of demand, followed closely by the transportation sector. Major players like ExxonMobil, Chevron, and Shell dominate the landscape, with smaller independent producers also contributing significantly. Regional variations exist, with the Southwest and West experiencing the most rapid growth due to extensive shale reserves and energy infrastructure development. The Northeast, while possessing a significant industrial base, faces capacity constraints and environmental scrutiny, leading to comparatively slower growth.
The forecast for the US oil and gas market indicates sustained growth throughout the 2025-2033 period, although the pace may moderate slightly towards the latter half of the forecast due to the aforementioned constraints and the broader energy transition. Strategic investments in pipeline infrastructure, coupled with efforts to enhance energy efficiency and reduce environmental impact, will likely shape the market's trajectory. The dominance of established players will continue, however, increased competition from renewable energy sources and the emergence of innovative technologies are poised to disrupt the market in the long term. This necessitates a proactive approach from incumbent players to maintain market share, through diversification into renewable energy and strategic partnerships.
This comprehensive report provides an in-depth analysis of the USA oil and gas market, encompassing market dynamics, growth trends, regional segmentation, product landscape, key players, and future outlook. The report covers the period from 2019 to 2033, with a focus on the forecast period from 2025 to 2033 and a base year of 2025. This essential resource is designed for industry professionals, investors, and strategic decision-makers seeking a clear understanding of this dynamic sector. The market is segmented by product type (Crude Oil, Natural Gas, Refined Products) and end-use sector (Industrial, Commercial, Residential, Transportation). Key players analyzed include Shell PLC, Hess Corporation, ExxonMobil Corporation, Marathon Petroleum Corporation, Occidental Petroleum, Chevron Corporation, ConocoPhillips Company, Valero Energy, EOG Resources, Total Energies SE, Phillips 66, and BP PLC. The report’s projected market value for 2025 is xx Million.
USA Oil and Gas Market Dynamics & Structure
The USA oil and gas market is characterized by a moderately concentrated structure, with a few major players holding significant market share. Technological innovation, particularly in areas like enhanced oil recovery (EOR) and shale gas extraction, significantly impacts market dynamics. Stringent regulatory frameworks, including environmental regulations and safety standards, pose both challenges and opportunities. Competition from renewable energy sources and the development of alternative fuels serve as key competitive substitutes. End-user demographics, influenced by economic growth and energy consumption patterns, also contribute to market fluctuations. Market consolidation through mergers and acquisitions (M&A) activity, while present, is projected to remain at a moderate pace in the coming years.
- Market Concentration: The top 5 companies hold an estimated xx% market share in 2025.
- Technological Innovation: Focus on EOR and shale gas drives production growth, but faces challenges in terms of cost and environmental impact.
- Regulatory Framework: Environmental regulations and safety standards are constantly evolving, influencing operational costs and investment decisions.
- M&A Activity: An estimated xx M&A deals were completed between 2019 and 2024, valued at approximately xx Million.
USA Oil and Gas Market Growth Trends & Insights
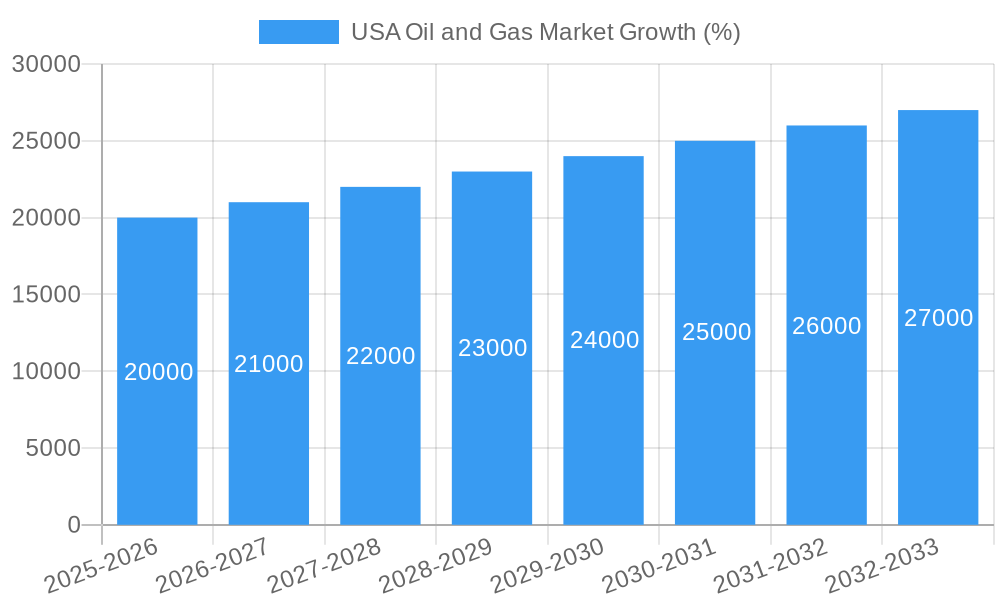
The USA oil and gas market is expected to experience significant growth driven by robust domestic demand and export opportunities. Technological advancements in extraction techniques are enabling increased production from unconventional resources. However, fluctuating crude oil prices and environmental concerns pose challenges. The market’s growth trajectory has been influenced by several factors: from the post-pandemic economic recovery to shifts in global energy demand and geopolitical events. This includes a notable CAGR of xx% from 2019 to 2024 and a projected CAGR of xx% from 2025 to 2033. Market penetration of natural gas in the residential and commercial sectors continues to rise, leading to increased demand. Shifts towards more efficient energy consumption are also expected in response to higher energy costs and growing environmental concerns.
Dominant Regions, Countries, or Segments in USA Oil and Gas Market
The Texas and Permian Basin regions are currently the leading drivers of growth within the USA oil and gas market. The Permian Basin's substantial shale oil and gas reserves contribute significantly to this dominance.
- Crude Oil: The Texas region remains a dominant force due to its extensive reserves and established infrastructure.
- Natural Gas: The Marcellus and Utica shale plays in the Appalachian Basin are significant contributors to natural gas production, fueling growth in the eastern US.
- Refined Products: High population density areas on the East and West coasts drive demand for refined products.
- Transportation: The transportation sector remains a significant consumer of refined petroleum products.
- Key Drivers: Abundant reserves, supportive government policies (initially), and strong infrastructure contribute to the continued dominance of these regions.
USA Oil and Gas Market Product Landscape
The U.S. oil and gas market boasts a diverse product portfolio, encompassing light sweet crude oil, natural gas liquids (NGLs), and refined products such as gasoline, diesel, and petrochemicals. Continuous technological innovation has significantly enhanced extraction efficiency, boosted recovery rates, and facilitated the development of higher-quality, more refined products. Specific advancements include enhanced oil recovery (EOR) techniques like CO2 injection and polymer flooding, maximizing production from mature fields. These improvements are further optimized through sophisticated data analytics and cutting-edge drilling technologies, leading to increased production and operational efficiency.
Key Drivers, Barriers & Challenges in USA Oil and Gas Market
Key Drivers: Abundant domestic reserves, coupled with ongoing technological advancements in extraction and processing, fuel market growth. Robust demand from diverse sectors, including transportation, electricity generation, and manufacturing, further stimulates the market. Government policies and incentives supporting domestic energy production also play a crucial role in fostering expansion.
Key Challenges: The market faces significant headwinds, including volatile oil and gas prices subject to global economic fluctuations and geopolitical events. Stringent environmental regulations and the rising prominence of renewable energy sources pose considerable challenges to sustained growth. Supply chain vulnerabilities, particularly in the face of unexpected disruptions, and intense competition from both domestic and international players add further complexity.
Emerging Opportunities in USA Oil and Gas Market
The increasing preference for natural gas as a relatively cleaner-burning fossil fuel presents substantial opportunities for growth and investment. Technological progress in carbon capture, utilization, and storage (CCUS) offers pathways to mitigate the environmental impact of fossil fuel production, enhancing the sector's sustainability profile. The burgeoning petrochemical industry, driven by the relentless demand for plastics and other chemical products, creates another lucrative avenue for expansion. Furthermore, exploration and production in under-explored regions of the U.S. hold the potential to unlock significant new reserves and extend the lifespan of domestic oil and gas production.
Growth Accelerators in the USA Oil and Gas Market Industry
Several factors will propel future growth in the U.S. oil and gas market. These include groundbreaking technological advancements in extraction and processing technologies, resulting in higher efficiency and lower production costs. Strategic collaborations and partnerships between energy companies and technology providers will be instrumental in driving innovation and deploying new solutions. Expansion into new domestic and international markets, focusing on export opportunities, will broaden market reach and revenue streams. A crucial element of future growth will involve a strong commitment to environmental sustainability and a proactive approach to meeting increasingly stringent net-zero targets.
Key Players Shaping the USA Oil and Gas Market Market
- Shell PLC
- Hess Corporation
- ExxonMobil Corporation
- Marathon Petroleum Corporation
- Occidental Petroleum
- Chevron Corporation
- ConocoPhillips Company
- Valero Energy
- EOG Resources
- Total Energies SE
- Phillips 66
- BP PLC
Notable Milestones in USA Oil and Gas Market Sector
- January 2022: The Department of Energy announced the release of 13.4 million barrels of oil from the Strategic Petroleum Reserve to combat rising gasoline prices.
- March 2022: The landmark energy supply deal between the US and the European Union was agreed upon, aiming to reduce reliance on Russian gas.
In-Depth USA Oil and Gas Market Market Outlook
The USA oil and gas market is poised for continued growth, driven by robust domestic demand and evolving global energy dynamics. Technological advancements and strategic investments will play a crucial role in shaping the future of the sector. Opportunities exist in exploring new reserves, improving efficiency, and focusing on cleaner energy solutions. The market’s long-term potential is substantial, with opportunities for both established players and new entrants.
USA Oil and Gas Market Segmentation
- 1. Upstream
- 2. Midstream
- 3. Downstream
USA Oil and Gas Market Segmentation By Geography
-
1. North America
- 1.1. United States
- 1.2. Canada
- 1.3. Mexico
-
2. South America
- 2.1. Brazil
- 2.2. Argentina
- 2.3. Rest of South America
-
3. Europe
- 3.1. United Kingdom
- 3.2. Germany
- 3.3. France
- 3.4. Italy
- 3.5. Spain
- 3.6. Russia
- 3.7. Benelux
- 3.8. Nordics
- 3.9. Rest of Europe
-
4. Middle East & Africa
- 4.1. Turkey
- 4.2. Israel
- 4.3. GCC
- 4.4. North Africa
- 4.5. South Africa
- 4.6. Rest of Middle East & Africa
-
5. Asia Pacific
- 5.1. China
- 5.2. India
- 5.3. Japan
- 5.4. South Korea
- 5.5. ASEAN
- 5.6. Oceania
- 5.7. Rest of Asia Pacific
USA Oil and Gas Market REPORT HIGHLIGHTS
| Aspects | Details |
|---|---|
| Study Period | 2019-2033 |
| Base Year | 2024 |
| Estimated Year | 2025 |
| Forecast Period | 2025-2033 |
| Historical Period | 2019-2024 |
| Growth Rate | CAGR of > 4.00% from 2019-2033 |
| Segmentation |
|
Table of Contents
- 1. Introduction
- 1.1. Research Scope
- 1.2. Market Segmentation
- 1.3. Research Methodology
- 1.4. Definitions and Assumptions
- 2. Executive Summary
- 2.1. Introduction
- 3. Market Dynamics
- 3.1. Introduction
- 3.2. Market Drivers
- 3.2.1. 4.; Modernization and Upgrades of Existing Military Aircraft Fleets4.; Increasing Defense Budgets
- 3.3. Market Restrains
- 3.3.1. 4.; Shift Toward Unmanned Aircraft
- 3.4. Market Trends
- 3.4.1. Upstream Sector Expected Witness Significant Growth
- 4. Market Factor Analysis
- 4.1. Porters Five Forces
- 4.2. Supply/Value Chain
- 4.3. PESTEL analysis
- 4.4. Market Entropy
- 4.5. Patent/Trademark Analysis
- 5. Global USA Oil and Gas Market Analysis, Insights and Forecast, 2019-2031
- 5.1. Market Analysis, Insights and Forecast - by Upstream
- 5.2. Market Analysis, Insights and Forecast - by Midstream
- 5.3. Market Analysis, Insights and Forecast - by Downstream
- 5.4. Market Analysis, Insights and Forecast - by Region
- 5.4.1. North America
- 5.4.2. South America
- 5.4.3. Europe
- 5.4.4. Middle East & Africa
- 5.4.5. Asia Pacific
- 5.1. Market Analysis, Insights and Forecast - by Upstream
- 6. North America USA Oil and Gas Market Analysis, Insights and Forecast, 2019-2031
- 6.1. Market Analysis, Insights and Forecast - by Upstream
- 6.2. Market Analysis, Insights and Forecast - by Midstream
- 6.3. Market Analysis, Insights and Forecast - by Downstream
- 6.1. Market Analysis, Insights and Forecast - by Upstream
- 7. South America USA Oil and Gas Market Analysis, Insights and Forecast, 2019-2031
- 7.1. Market Analysis, Insights and Forecast - by Upstream
- 7.2. Market Analysis, Insights and Forecast - by Midstream
- 7.3. Market Analysis, Insights and Forecast - by Downstream
- 7.1. Market Analysis, Insights and Forecast - by Upstream
- 8. Europe USA Oil and Gas Market Analysis, Insights and Forecast, 2019-2031
- 8.1. Market Analysis, Insights and Forecast - by Upstream
- 8.2. Market Analysis, Insights and Forecast - by Midstream
- 8.3. Market Analysis, Insights and Forecast - by Downstream
- 8.1. Market Analysis, Insights and Forecast - by Upstream
- 9. Middle East & Africa USA Oil and Gas Market Analysis, Insights and Forecast, 2019-2031
- 9.1. Market Analysis, Insights and Forecast - by Upstream
- 9.2. Market Analysis, Insights and Forecast - by Midstream
- 9.3. Market Analysis, Insights and Forecast - by Downstream
- 9.1. Market Analysis, Insights and Forecast - by Upstream
- 10. Asia Pacific USA Oil and Gas Market Analysis, Insights and Forecast, 2019-2031
- 10.1. Market Analysis, Insights and Forecast - by Upstream
- 10.2. Market Analysis, Insights and Forecast - by Midstream
- 10.3. Market Analysis, Insights and Forecast - by Downstream
- 10.1. Market Analysis, Insights and Forecast - by Upstream
- 11. Northeast USA Oil and Gas Market Analysis, Insights and Forecast, 2019-2031
- 12. Southeast USA Oil and Gas Market Analysis, Insights and Forecast, 2019-2031
- 13. Midwest USA Oil and Gas Market Analysis, Insights and Forecast, 2019-2031
- 14. Southwest USA Oil and Gas Market Analysis, Insights and Forecast, 2019-2031
- 15. West USA Oil and Gas Market Analysis, Insights and Forecast, 2019-2031
- 16. Competitive Analysis
- 16.1. Global Market Share Analysis 2024
- 16.2. Company Profiles
- 16.2.1 Shell PLC
- 16.2.1.1. Overview
- 16.2.1.2. Products
- 16.2.1.3. SWOT Analysis
- 16.2.1.4. Recent Developments
- 16.2.1.5. Financials (Based on Availability)
- 16.2.2 Hess Corporation
- 16.2.2.1. Overview
- 16.2.2.2. Products
- 16.2.2.3. SWOT Analysis
- 16.2.2.4. Recent Developments
- 16.2.2.5. Financials (Based on Availability)
- 16.2.3 ExxonMobil Corporation
- 16.2.3.1. Overview
- 16.2.3.2. Products
- 16.2.3.3. SWOT Analysis
- 16.2.3.4. Recent Developments
- 16.2.3.5. Financials (Based on Availability)
- 16.2.4 Marathon Petroleum Corporation
- 16.2.4.1. Overview
- 16.2.4.2. Products
- 16.2.4.3. SWOT Analysis
- 16.2.4.4. Recent Developments
- 16.2.4.5. Financials (Based on Availability)
- 16.2.5 Occidental Petroleum
- 16.2.5.1. Overview
- 16.2.5.2. Products
- 16.2.5.3. SWOT Analysis
- 16.2.5.4. Recent Developments
- 16.2.5.5. Financials (Based on Availability)
- 16.2.6 Chevron Corporation
- 16.2.6.1. Overview
- 16.2.6.2. Products
- 16.2.6.3. SWOT Analysis
- 16.2.6.4. Recent Developments
- 16.2.6.5. Financials (Based on Availability)
- 16.2.7 ConocoPhillips Company
- 16.2.7.1. Overview
- 16.2.7.2. Products
- 16.2.7.3. SWOT Analysis
- 16.2.7.4. Recent Developments
- 16.2.7.5. Financials (Based on Availability)
- 16.2.8 Valero Energy
- 16.2.8.1. Overview
- 16.2.8.2. Products
- 16.2.8.3. SWOT Analysis
- 16.2.8.4. Recent Developments
- 16.2.8.5. Financials (Based on Availability)
- 16.2.9 EOG Resources
- 16.2.9.1. Overview
- 16.2.9.2. Products
- 16.2.9.3. SWOT Analysis
- 16.2.9.4. Recent Developments
- 16.2.9.5. Financials (Based on Availability)
- 16.2.10 Total Energies SE
- 16.2.10.1. Overview
- 16.2.10.2. Products
- 16.2.10.3. SWOT Analysis
- 16.2.10.4. Recent Developments
- 16.2.10.5. Financials (Based on Availability)
- 16.2.11 Phillips
- 16.2.11.1. Overview
- 16.2.11.2. Products
- 16.2.11.3. SWOT Analysis
- 16.2.11.4. Recent Developments
- 16.2.11.5. Financials (Based on Availability)
- 16.2.12 BP PLC
- 16.2.12.1. Overview
- 16.2.12.2. Products
- 16.2.12.3. SWOT Analysis
- 16.2.12.4. Recent Developments
- 16.2.12.5. Financials (Based on Availability)
- 16.2.1 Shell PLC
List of Figures
- Figure 1: Global USA Oil and Gas Market Revenue Breakdown (Million, %) by Region 2024 & 2032
- Figure 2: Global USA Oil and Gas Market Volume Breakdown (Tonnes, %) by Region 2024 & 2032
- Figure 3: United states USA Oil and Gas Market Revenue (Million), by Country 2024 & 2032
- Figure 4: United states USA Oil and Gas Market Volume (Tonnes), by Country 2024 & 2032
- Figure 5: United states USA Oil and Gas Market Revenue Share (%), by Country 2024 & 2032
- Figure 6: United states USA Oil and Gas Market Volume Share (%), by Country 2024 & 2032
- Figure 7: North America USA Oil and Gas Market Revenue (Million), by Upstream 2024 & 2032
- Figure 8: North America USA Oil and Gas Market Volume (Tonnes), by Upstream 2024 & 2032
- Figure 9: North America USA Oil and Gas Market Revenue Share (%), by Upstream 2024 & 2032
- Figure 10: North America USA Oil and Gas Market Volume Share (%), by Upstream 2024 & 2032
- Figure 11: North America USA Oil and Gas Market Revenue (Million), by Midstream 2024 & 2032
- Figure 12: North America USA Oil and Gas Market Volume (Tonnes), by Midstream 2024 & 2032
- Figure 13: North America USA Oil and Gas Market Revenue Share (%), by Midstream 2024 & 2032
- Figure 14: North America USA Oil and Gas Market Volume Share (%), by Midstream 2024 & 2032
- Figure 15: North America USA Oil and Gas Market Revenue (Million), by Downstream 2024 & 2032
- Figure 16: North America USA Oil and Gas Market Volume (Tonnes), by Downstream 2024 & 2032
- Figure 17: North America USA Oil and Gas Market Revenue Share (%), by Downstream 2024 & 2032
- Figure 18: North America USA Oil and Gas Market Volume Share (%), by Downstream 2024 & 2032
- Figure 19: North America USA Oil and Gas Market Revenue (Million), by Country 2024 & 2032
- Figure 20: North America USA Oil and Gas Market Volume (Tonnes), by Country 2024 & 2032
- Figure 21: North America USA Oil and Gas Market Revenue Share (%), by Country 2024 & 2032
- Figure 22: North America USA Oil and Gas Market Volume Share (%), by Country 2024 & 2032
- Figure 23: South America USA Oil and Gas Market Revenue (Million), by Upstream 2024 & 2032
- Figure 24: South America USA Oil and Gas Market Volume (Tonnes), by Upstream 2024 & 2032
- Figure 25: South America USA Oil and Gas Market Revenue Share (%), by Upstream 2024 & 2032
- Figure 26: South America USA Oil and Gas Market Volume Share (%), by Upstream 2024 & 2032
- Figure 27: South America USA Oil and Gas Market Revenue (Million), by Midstream 2024 & 2032
- Figure 28: South America USA Oil and Gas Market Volume (Tonnes), by Midstream 2024 & 2032
- Figure 29: South America USA Oil and Gas Market Revenue Share (%), by Midstream 2024 & 2032
- Figure 30: South America USA Oil and Gas Market Volume Share (%), by Midstream 2024 & 2032
- Figure 31: South America USA Oil and Gas Market Revenue (Million), by Downstream 2024 & 2032
- Figure 32: South America USA Oil and Gas Market Volume (Tonnes), by Downstream 2024 & 2032
- Figure 33: South America USA Oil and Gas Market Revenue Share (%), by Downstream 2024 & 2032
- Figure 34: South America USA Oil and Gas Market Volume Share (%), by Downstream 2024 & 2032
- Figure 35: South America USA Oil and Gas Market Revenue (Million), by Country 2024 & 2032
- Figure 36: South America USA Oil and Gas Market Volume (Tonnes), by Country 2024 & 2032
- Figure 37: South America USA Oil and Gas Market Revenue Share (%), by Country 2024 & 2032
- Figure 38: South America USA Oil and Gas Market Volume Share (%), by Country 2024 & 2032
- Figure 39: Europe USA Oil and Gas Market Revenue (Million), by Upstream 2024 & 2032
- Figure 40: Europe USA Oil and Gas Market Volume (Tonnes), by Upstream 2024 & 2032
- Figure 41: Europe USA Oil and Gas Market Revenue Share (%), by Upstream 2024 & 2032
- Figure 42: Europe USA Oil and Gas Market Volume Share (%), by Upstream 2024 & 2032
- Figure 43: Europe USA Oil and Gas Market Revenue (Million), by Midstream 2024 & 2032
- Figure 44: Europe USA Oil and Gas Market Volume (Tonnes), by Midstream 2024 & 2032
- Figure 45: Europe USA Oil and Gas Market Revenue Share (%), by Midstream 2024 & 2032
- Figure 46: Europe USA Oil and Gas Market Volume Share (%), by Midstream 2024 & 2032
- Figure 47: Europe USA Oil and Gas Market Revenue (Million), by Downstream 2024 & 2032
- Figure 48: Europe USA Oil and Gas Market Volume (Tonnes), by Downstream 2024 & 2032
- Figure 49: Europe USA Oil and Gas Market Revenue Share (%), by Downstream 2024 & 2032
- Figure 50: Europe USA Oil and Gas Market Volume Share (%), by Downstream 2024 & 2032
- Figure 51: Europe USA Oil and Gas Market Revenue (Million), by Country 2024 & 2032
- Figure 52: Europe USA Oil and Gas Market Volume (Tonnes), by Country 2024 & 2032
- Figure 53: Europe USA Oil and Gas Market Revenue Share (%), by Country 2024 & 2032
- Figure 54: Europe USA Oil and Gas Market Volume Share (%), by Country 2024 & 2032
- Figure 55: Middle East & Africa USA Oil and Gas Market Revenue (Million), by Upstream 2024 & 2032
- Figure 56: Middle East & Africa USA Oil and Gas Market Volume (Tonnes), by Upstream 2024 & 2032
- Figure 57: Middle East & Africa USA Oil and Gas Market Revenue Share (%), by Upstream 2024 & 2032
- Figure 58: Middle East & Africa USA Oil and Gas Market Volume Share (%), by Upstream 2024 & 2032
- Figure 59: Middle East & Africa USA Oil and Gas Market Revenue (Million), by Midstream 2024 & 2032
- Figure 60: Middle East & Africa USA Oil and Gas Market Volume (Tonnes), by Midstream 2024 & 2032
- Figure 61: Middle East & Africa USA Oil and Gas Market Revenue Share (%), by Midstream 2024 & 2032
- Figure 62: Middle East & Africa USA Oil and Gas Market Volume Share (%), by Midstream 2024 & 2032
- Figure 63: Middle East & Africa USA Oil and Gas Market Revenue (Million), by Downstream 2024 & 2032
- Figure 64: Middle East & Africa USA Oil and Gas Market Volume (Tonnes), by Downstream 2024 & 2032
- Figure 65: Middle East & Africa USA Oil and Gas Market Revenue Share (%), by Downstream 2024 & 2032
- Figure 66: Middle East & Africa USA Oil and Gas Market Volume Share (%), by Downstream 2024 & 2032
- Figure 67: Middle East & Africa USA Oil and Gas Market Revenue (Million), by Country 2024 & 2032
- Figure 68: Middle East & Africa USA Oil and Gas Market Volume (Tonnes), by Country 2024 & 2032
- Figure 69: Middle East & Africa USA Oil and Gas Market Revenue Share (%), by Country 2024 & 2032
- Figure 70: Middle East & Africa USA Oil and Gas Market Volume Share (%), by Country 2024 & 2032
- Figure 71: Asia Pacific USA Oil and Gas Market Revenue (Million), by Upstream 2024 & 2032
- Figure 72: Asia Pacific USA Oil and Gas Market Volume (Tonnes), by Upstream 2024 & 2032
- Figure 73: Asia Pacific USA Oil and Gas Market Revenue Share (%), by Upstream 2024 & 2032
- Figure 74: Asia Pacific USA Oil and Gas Market Volume Share (%), by Upstream 2024 & 2032
- Figure 75: Asia Pacific USA Oil and Gas Market Revenue (Million), by Midstream 2024 & 2032
- Figure 76: Asia Pacific USA Oil and Gas Market Volume (Tonnes), by Midstream 2024 & 2032
- Figure 77: Asia Pacific USA Oil and Gas Market Revenue Share (%), by Midstream 2024 & 2032
- Figure 78: Asia Pacific USA Oil and Gas Market Volume Share (%), by Midstream 2024 & 2032
- Figure 79: Asia Pacific USA Oil and Gas Market Revenue (Million), by Downstream 2024 & 2032
- Figure 80: Asia Pacific USA Oil and Gas Market Volume (Tonnes), by Downstream 2024 & 2032
- Figure 81: Asia Pacific USA Oil and Gas Market Revenue Share (%), by Downstream 2024 & 2032
- Figure 82: Asia Pacific USA Oil and Gas Market Volume Share (%), by Downstream 2024 & 2032
- Figure 83: Asia Pacific USA Oil and Gas Market Revenue (Million), by Country 2024 & 2032
- Figure 84: Asia Pacific USA Oil and Gas Market Volume (Tonnes), by Country 2024 & 2032
- Figure 85: Asia Pacific USA Oil and Gas Market Revenue Share (%), by Country 2024 & 2032
- Figure 86: Asia Pacific USA Oil and Gas Market Volume Share (%), by Country 2024 & 2032
List of Tables
- Table 1: Global USA Oil and Gas Market Revenue Million Forecast, by Region 2019 & 2032
- Table 2: Global USA Oil and Gas Market Volume Tonnes Forecast, by Region 2019 & 2032
- Table 3: Global USA Oil and Gas Market Revenue Million Forecast, by Upstream 2019 & 2032
- Table 4: Global USA Oil and Gas Market Volume Tonnes Forecast, by Upstream 2019 & 2032
- Table 5: Global USA Oil and Gas Market Revenue Million Forecast, by Midstream 2019 & 2032
- Table 6: Global USA Oil and Gas Market Volume Tonnes Forecast, by Midstream 2019 & 2032
- Table 7: Global USA Oil and Gas Market Revenue Million Forecast, by Downstream 2019 & 2032
- Table 8: Global USA Oil and Gas Market Volume Tonnes Forecast, by Downstream 2019 & 2032
- Table 9: Global USA Oil and Gas Market Revenue Million Forecast, by Region 2019 & 2032
- Table 10: Global USA Oil and Gas Market Volume Tonnes Forecast, by Region 2019 & 2032
- Table 11: Global USA Oil and Gas Market Revenue Million Forecast, by Country 2019 & 2032
- Table 12: Global USA Oil and Gas Market Volume Tonnes Forecast, by Country 2019 & 2032
- Table 13: Northeast USA Oil and Gas Market Revenue (Million) Forecast, by Application 2019 & 2032
- Table 14: Northeast USA Oil and Gas Market Volume (Tonnes) Forecast, by Application 2019 & 2032
- Table 15: Southeast USA Oil and Gas Market Revenue (Million) Forecast, by Application 2019 & 2032
- Table 16: Southeast USA Oil and Gas Market Volume (Tonnes) Forecast, by Application 2019 & 2032
- Table 17: Midwest USA Oil and Gas Market Revenue (Million) Forecast, by Application 2019 & 2032
- Table 18: Midwest USA Oil and Gas Market Volume (Tonnes) Forecast, by Application 2019 & 2032
- Table 19: Southwest USA Oil and Gas Market Revenue (Million) Forecast, by Application 2019 & 2032
- Table 20: Southwest USA Oil and Gas Market Volume (Tonnes) Forecast, by Application 2019 & 2032
- Table 21: West USA Oil and Gas Market Revenue (Million) Forecast, by Application 2019 & 2032
- Table 22: West USA Oil and Gas Market Volume (Tonnes) Forecast, by Application 2019 & 2032
- Table 23: Global USA Oil and Gas Market Revenue Million Forecast, by Upstream 2019 & 2032
- Table 24: Global USA Oil and Gas Market Volume Tonnes Forecast, by Upstream 2019 & 2032
- Table 25: Global USA Oil and Gas Market Revenue Million Forecast, by Midstream 2019 & 2032
- Table 26: Global USA Oil and Gas Market Volume Tonnes Forecast, by Midstream 2019 & 2032
- Table 27: Global USA Oil and Gas Market Revenue Million Forecast, by Downstream 2019 & 2032
- Table 28: Global USA Oil and Gas Market Volume Tonnes Forecast, by Downstream 2019 & 2032
- Table 29: Global USA Oil and Gas Market Revenue Million Forecast, by Country 2019 & 2032
- Table 30: Global USA Oil and Gas Market Volume Tonnes Forecast, by Country 2019 & 2032
- Table 31: United States USA Oil and Gas Market Revenue (Million) Forecast, by Application 2019 & 2032
- Table 32: United States USA Oil and Gas Market Volume (Tonnes) Forecast, by Application 2019 & 2032
- Table 33: Canada USA Oil and Gas Market Revenue (Million) Forecast, by Application 2019 & 2032
- Table 34: Canada USA Oil and Gas Market Volume (Tonnes) Forecast, by Application 2019 & 2032
- Table 35: Mexico USA Oil and Gas Market Revenue (Million) Forecast, by Application 2019 & 2032
- Table 36: Mexico USA Oil and Gas Market Volume (Tonnes) Forecast, by Application 2019 & 2032
- Table 37: Global USA Oil and Gas Market Revenue Million Forecast, by Upstream 2019 & 2032
- Table 38: Global USA Oil and Gas Market Volume Tonnes Forecast, by Upstream 2019 & 2032
- Table 39: Global USA Oil and Gas Market Revenue Million Forecast, by Midstream 2019 & 2032
- Table 40: Global USA Oil and Gas Market Volume Tonnes Forecast, by Midstream 2019 & 2032
- Table 41: Global USA Oil and Gas Market Revenue Million Forecast, by Downstream 2019 & 2032
- Table 42: Global USA Oil and Gas Market Volume Tonnes Forecast, by Downstream 2019 & 2032
- Table 43: Global USA Oil and Gas Market Revenue Million Forecast, by Country 2019 & 2032
- Table 44: Global USA Oil and Gas Market Volume Tonnes Forecast, by Country 2019 & 2032
- Table 45: Brazil USA Oil and Gas Market Revenue (Million) Forecast, by Application 2019 & 2032
- Table 46: Brazil USA Oil and Gas Market Volume (Tonnes) Forecast, by Application 2019 & 2032
- Table 47: Argentina USA Oil and Gas Market Revenue (Million) Forecast, by Application 2019 & 2032
- Table 48: Argentina USA Oil and Gas Market Volume (Tonnes) Forecast, by Application 2019 & 2032
- Table 49: Rest of South America USA Oil and Gas Market Revenue (Million) Forecast, by Application 2019 & 2032
- Table 50: Rest of South America USA Oil and Gas Market Volume (Tonnes) Forecast, by Application 2019 & 2032
- Table 51: Global USA Oil and Gas Market Revenue Million Forecast, by Upstream 2019 & 2032
- Table 52: Global USA Oil and Gas Market Volume Tonnes Forecast, by Upstream 2019 & 2032
- Table 53: Global USA Oil and Gas Market Revenue Million Forecast, by Midstream 2019 & 2032
- Table 54: Global USA Oil and Gas Market Volume Tonnes Forecast, by Midstream 2019 & 2032
- Table 55: Global USA Oil and Gas Market Revenue Million Forecast, by Downstream 2019 & 2032
- Table 56: Global USA Oil and Gas Market Volume Tonnes Forecast, by Downstream 2019 & 2032
- Table 57: Global USA Oil and Gas Market Revenue Million Forecast, by Country 2019 & 2032
- Table 58: Global USA Oil and Gas Market Volume Tonnes Forecast, by Country 2019 & 2032
- Table 59: United Kingdom USA Oil and Gas Market Revenue (Million) Forecast, by Application 2019 & 2032
- Table 60: United Kingdom USA Oil and Gas Market Volume (Tonnes) Forecast, by Application 2019 & 2032
- Table 61: Germany USA Oil and Gas Market Revenue (Million) Forecast, by Application 2019 & 2032
- Table 62: Germany USA Oil and Gas Market Volume (Tonnes) Forecast, by Application 2019 & 2032
- Table 63: France USA Oil and Gas Market Revenue (Million) Forecast, by Application 2019 & 2032
- Table 64: France USA Oil and Gas Market Volume (Tonnes) Forecast, by Application 2019 & 2032
- Table 65: Italy USA Oil and Gas Market Revenue (Million) Forecast, by Application 2019 & 2032
- Table 66: Italy USA Oil and Gas Market Volume (Tonnes) Forecast, by Application 2019 & 2032
- Table 67: Spain USA Oil and Gas Market Revenue (Million) Forecast, by Application 2019 & 2032
- Table 68: Spain USA Oil and Gas Market Volume (Tonnes) Forecast, by Application 2019 & 2032
- Table 69: Russia USA Oil and Gas Market Revenue (Million) Forecast, by Application 2019 & 2032
- Table 70: Russia USA Oil and Gas Market Volume (Tonnes) Forecast, by Application 2019 & 2032
- Table 71: Benelux USA Oil and Gas Market Revenue (Million) Forecast, by Application 2019 & 2032
- Table 72: Benelux USA Oil and Gas Market Volume (Tonnes) Forecast, by Application 2019 & 2032
- Table 73: Nordics USA Oil and Gas Market Revenue (Million) Forecast, by Application 2019 & 2032
- Table 74: Nordics USA Oil and Gas Market Volume (Tonnes) Forecast, by Application 2019 & 2032
- Table 75: Rest of Europe USA Oil and Gas Market Revenue (Million) Forecast, by Application 2019 & 2032
- Table 76: Rest of Europe USA Oil and Gas Market Volume (Tonnes) Forecast, by Application 2019 & 2032
- Table 77: Global USA Oil and Gas Market Revenue Million Forecast, by Upstream 2019 & 2032
- Table 78: Global USA Oil and Gas Market Volume Tonnes Forecast, by Upstream 2019 & 2032
- Table 79: Global USA Oil and Gas Market Revenue Million Forecast, by Midstream 2019 & 2032
- Table 80: Global USA Oil and Gas Market Volume Tonnes Forecast, by Midstream 2019 & 2032
- Table 81: Global USA Oil and Gas Market Revenue Million Forecast, by Downstream 2019 & 2032
- Table 82: Global USA Oil and Gas Market Volume Tonnes Forecast, by Downstream 2019 & 2032
- Table 83: Global USA Oil and Gas Market Revenue Million Forecast, by Country 2019 & 2032
- Table 84: Global USA Oil and Gas Market Volume Tonnes Forecast, by Country 2019 & 2032
- Table 85: Turkey USA Oil and Gas Market Revenue (Million) Forecast, by Application 2019 & 2032
- Table 86: Turkey USA Oil and Gas Market Volume (Tonnes) Forecast, by Application 2019 & 2032
- Table 87: Israel USA Oil and Gas Market Revenue (Million) Forecast, by Application 2019 & 2032
- Table 88: Israel USA Oil and Gas Market Volume (Tonnes) Forecast, by Application 2019 & 2032
- Table 89: GCC USA Oil and Gas Market Revenue (Million) Forecast, by Application 2019 & 2032
- Table 90: GCC USA Oil and Gas Market Volume (Tonnes) Forecast, by Application 2019 & 2032
- Table 91: North Africa USA Oil and Gas Market Revenue (Million) Forecast, by Application 2019 & 2032
- Table 92: North Africa USA Oil and Gas Market Volume (Tonnes) Forecast, by Application 2019 & 2032
- Table 93: South Africa USA Oil and Gas Market Revenue (Million) Forecast, by Application 2019 & 2032
- Table 94: South Africa USA Oil and Gas Market Volume (Tonnes) Forecast, by Application 2019 & 2032
- Table 95: Rest of Middle East & Africa USA Oil and Gas Market Revenue (Million) Forecast, by Application 2019 & 2032
- Table 96: Rest of Middle East & Africa USA Oil and Gas Market Volume (Tonnes) Forecast, by Application 2019 & 2032
- Table 97: Global USA Oil and Gas Market Revenue Million Forecast, by Upstream 2019 & 2032
- Table 98: Global USA Oil and Gas Market Volume Tonnes Forecast, by Upstream 2019 & 2032
- Table 99: Global USA Oil and Gas Market Revenue Million Forecast, by Midstream 2019 & 2032
- Table 100: Global USA Oil and Gas Market Volume Tonnes Forecast, by Midstream 2019 & 2032
- Table 101: Global USA Oil and Gas Market Revenue Million Forecast, by Downstream 2019 & 2032
- Table 102: Global USA Oil and Gas Market Volume Tonnes Forecast, by Downstream 2019 & 2032
- Table 103: Global USA Oil and Gas Market Revenue Million Forecast, by Country 2019 & 2032
- Table 104: Global USA Oil and Gas Market Volume Tonnes Forecast, by Country 2019 & 2032
- Table 105: China USA Oil and Gas Market Revenue (Million) Forecast, by Application 2019 & 2032
- Table 106: China USA Oil and Gas Market Volume (Tonnes) Forecast, by Application 2019 & 2032
- Table 107: India USA Oil and Gas Market Revenue (Million) Forecast, by Application 2019 & 2032
- Table 108: India USA Oil and Gas Market Volume (Tonnes) Forecast, by Application 2019 & 2032
- Table 109: Japan USA Oil and Gas Market Revenue (Million) Forecast, by Application 2019 & 2032
- Table 110: Japan USA Oil and Gas Market Volume (Tonnes) Forecast, by Application 2019 & 2032
- Table 111: South Korea USA Oil and Gas Market Revenue (Million) Forecast, by Application 2019 & 2032
- Table 112: South Korea USA Oil and Gas Market Volume (Tonnes) Forecast, by Application 2019 & 2032
- Table 113: ASEAN USA Oil and Gas Market Revenue (Million) Forecast, by Application 2019 & 2032
- Table 114: ASEAN USA Oil and Gas Market Volume (Tonnes) Forecast, by Application 2019 & 2032
- Table 115: Oceania USA Oil and Gas Market Revenue (Million) Forecast, by Application 2019 & 2032
- Table 116: Oceania USA Oil and Gas Market Volume (Tonnes) Forecast, by Application 2019 & 2032
- Table 117: Rest of Asia Pacific USA Oil and Gas Market Revenue (Million) Forecast, by Application 2019 & 2032
- Table 118: Rest of Asia Pacific USA Oil and Gas Market Volume (Tonnes) Forecast, by Application 2019 & 2032
Frequently Asked Questions
1. What is the projected Compound Annual Growth Rate (CAGR) of the USA Oil and Gas Market?
The projected CAGR is approximately > 4.00%.
2. Which companies are prominent players in the USA Oil and Gas Market?
Key companies in the market include Shell PLC, Hess Corporation, ExxonMobil Corporation, Marathon Petroleum Corporation, Occidental Petroleum, Chevron Corporation, ConocoPhillips Company, Valero Energy, EOG Resources, Total Energies SE, Phillips, BP PLC.
3. What are the main segments of the USA Oil and Gas Market?
The market segments include Upstream, Midstream, Downstream.
4. Can you provide details about the market size?
The market size is estimated to be USD XX Million as of 2022.
5. What are some drivers contributing to market growth?
4.; Modernization and Upgrades of Existing Military Aircraft Fleets4.; Increasing Defense Budgets.
6. What are the notable trends driving market growth?
Upstream Sector Expected Witness Significant Growth.
7. Are there any restraints impacting market growth?
4.; Shift Toward Unmanned Aircraft.
8. Can you provide examples of recent developments in the market?
March 2022: The United States' President Joe Biden agreed to a landmark energy supply deal with the European Union. Under this deal, the United States was expected to increase transatlantic gas deliveries. This deal is important to reduce dependence on Russia after the Russia-Ukraine War.
9. What pricing options are available for accessing the report?
Pricing options include single-user, multi-user, and enterprise licenses priced at USD 3800, USD 4500, and USD 5800 respectively.
10. Is the market size provided in terms of value or volume?
The market size is provided in terms of value, measured in Million and volume, measured in Tonnes.
11. Are there any specific market keywords associated with the report?
Yes, the market keyword associated with the report is "USA Oil and Gas Market," which aids in identifying and referencing the specific market segment covered.
12. How do I determine which pricing option suits my needs best?
The pricing options vary based on user requirements and access needs. Individual users may opt for single-user licenses, while businesses requiring broader access may choose multi-user or enterprise licenses for cost-effective access to the report.
13. Are there any additional resources or data provided in the USA Oil and Gas Market report?
While the report offers comprehensive insights, it's advisable to review the specific contents or supplementary materials provided to ascertain if additional resources or data are available.
14. How can I stay updated on further developments or reports in the USA Oil and Gas Market?
To stay informed about further developments, trends, and reports in the USA Oil and Gas Market, consider subscribing to industry newsletters, following relevant companies and organizations, or regularly checking reputable industry news sources and publications.
Methodology
Step 1 - Identification of Relevant Samples Size from Population Database


Step 2 - Approaches for Defining Global Market Size (Value, Volume* & Price*)

Note*: In applicable scenarios
Step 3 - Data Sources
Primary Research
- Web Analytics
- Survey Reports
- Research Institute
- Latest Research Reports
- Opinion Leaders
Secondary Research
- Annual Reports
- White Paper
- Latest Press Release
- Industry Association
- Paid Database
- Investor Presentations

Step 4 - Data Triangulation
Involves using different sources of information in order to increase the validity of a study
These sources are likely to be stakeholders in a program - participants, other researchers, program staff, other community members, and so on.
Then we put all data in single framework & apply various statistical tools to find out the dynamic on the market.
During the analysis stage, feedback from the stakeholder groups would be compared to determine areas of agreement as well as areas of divergence
