

Key Insights
The US LNG bunkering market is experiencing robust growth, driven by increasing demand for cleaner maritime fuels and stringent environmental regulations. With a Compound Annual Growth Rate (CAGR) exceeding 5.20% from 2019 to 2033, the market is projected to reach substantial size. This expansion is fueled by the expanding tanker, container, and bulk cargo fleets seeking to reduce their carbon footprint. The increasing adoption of LNG as a marine fuel is a key driver, along with government incentives and infrastructure development supporting LNG bunkering operations. Key market segments include tanker fleets, which are early adopters due to their long voyages and significant fuel consumption; container fleets are also showing increased interest in LNG bunkering due to port emissions regulations. Bulk and general cargo fleets are expected to gradually adopt LNG bunkering as technology matures and costs decrease. The geographic distribution is concentrated in coastal regions, particularly the Northeast, Southeast, and West Coast, where port infrastructure and demand are highest. Major players like NorthStar Holdco Energy LLC, Harvey Gulf International Marine LLC, and Crowley Maritime Corporation are shaping the market landscape through their investments in LNG bunkering infrastructure and services. However, challenges remain, including the relatively high initial investment costs for LNG-fueled vessels and the limited availability of LNG bunkering infrastructure in certain regions. The industry is also navigating the complexities of LNG handling and safety regulations.
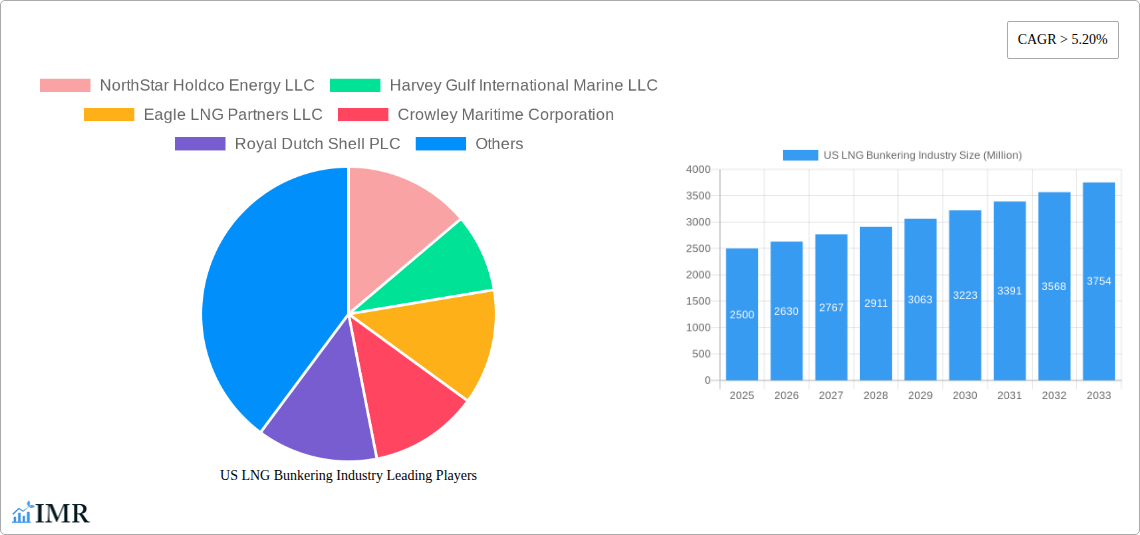
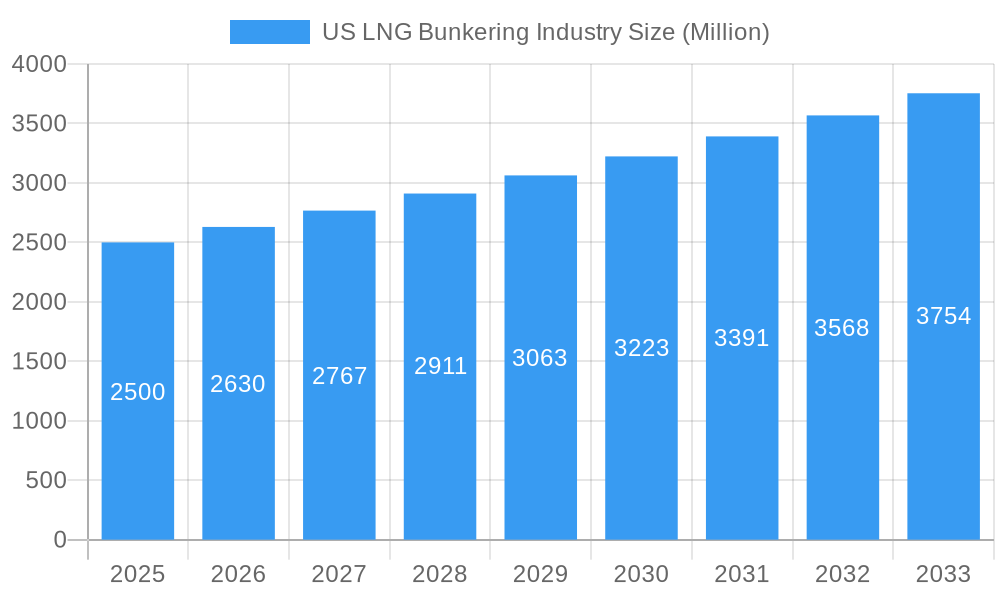
US LNG Bunkering Industry Market Size (In Billion)
The forecast period (2025-2033) will see continued growth, although the rate of expansion might moderate slightly in the later years as market saturation starts to take effect. The ongoing development of LNG bunkering infrastructure and technological advancements will continue to be crucial factors influencing future market growth. Further penetration into the bulk and general cargo fleet segments will be a significant indicator of the market's maturity. Price stability of LNG and a proactive approach to address environmental regulations and safety concerns will be vital for sustainable market expansion in the coming years. The expansion into new regions and the development of innovative bunkering solutions, such as smaller, more mobile bunkering vessels, will be important strategies for companies to secure future market share. Competition among existing players and the potential entry of new players will likely contribute to a dynamic and evolving market landscape.
US LNG Bunkering Industry Company Market Share
US LNG Bunkering Industry: A Comprehensive Market Report (2019-2033)
This comprehensive report provides a detailed analysis of the US LNG bunkering industry, offering invaluable insights for investors, industry professionals, and strategic decision-makers. Covering the period from 2019 to 2033, with a base year of 2025 and a forecast period of 2025-2033, this report unveils the market dynamics, growth trends, and future outlook of this rapidly evolving sector. The report segments the market by end-user (Tanker Fleet, Container Fleet, Bulk and General Cargo Fleet, Ferries and OSV, Others) and profiles key players including NorthStar Holdco Energy LLC, Harvey Gulf International Marine LLC, Eagle LNG Partners LLC, Crowley Maritime Corporation, Royal Dutch Shell PLC, Conrad Shipyards LLC, and JAX LNG LLC. The market size is projected to reach xx Million by 2033.
US LNG Bunkering Industry Market Dynamics & Structure
The US LNG bunkering market is characterized by moderate concentration, with several major players vying for market share. Technological innovation, particularly in LNG storage and handling technologies, is a key driver, while regulatory frameworks concerning emissions and safety play a crucial role. Competitive substitutes, such as traditional marine fuels, pose a significant challenge, though the environmental benefits of LNG are increasingly driving adoption. The end-user demographics are diverse, encompassing various vessel types, each with specific LNG bunkering needs. M&A activity has been relatively low in recent years but is anticipated to increase due to consolidation needs and market expansion strategies.
- Market Concentration: Moderately concentrated, with the top 5 players holding approximately 60% market share in 2025.
- Technological Innovation: Focus on efficient bunkering technologies, reduced emissions, and improved safety systems.
- Regulatory Framework: Stringent environmental regulations driving LNG adoption.
- Competitive Substitutes: Traditional marine fuels (HFO, MDO) remain strong competitors.
- M&A Activity: xx deals in the historical period (2019-2024), expected increase to xx deals in the forecast period (2025-2033).
- Innovation Barriers: High initial investment costs and lack of widespread LNG infrastructure.
US LNG Bunkering Industry Growth Trends & Insights
The US LNG bunkering market has witnessed significant growth in recent years, driven primarily by environmental regulations, decreasing LNG prices, and increasing awareness of the benefits of LNG as a cleaner marine fuel. The market size expanded from xx Million in 2019 to xx Million in 2024, exhibiting a CAGR of xx%. This growth trajectory is expected to continue in the forecast period (2025-2033), albeit at a slightly reduced rate due to market maturity and economic fluctuations. Technological advancements are further accelerating adoption, while shifting consumer preferences toward sustainability are playing a pivotal role. Market penetration has increased from xx% in 2019 to xx% in 2024 and is projected to reach xx% by 2033.
Dominant Regions, Countries, or Segments in US LNG Bunkering Industry
The Tanker Fleet segment is currently the dominant end-user, accounting for approximately 45% of the market share in 2025 due to the large-scale adoption of LNG as a fuel for this type of vessel. This segment's dominance is fueled by stringent environmental regulations imposed on large vessels operating in specific coastal areas. Growth is expected to continue, driven by increasing demand for long-haul tanker operations.
Key Drivers for Tanker Fleet Segment Dominance:
- Stringent Emission Regulations: Compliance with IMO 2020 and other regional emission regulations.
- Cost-Effectiveness: Lower fuel costs in certain regions compared to traditional fuels.
- Infrastructure Development: Growing availability of LNG bunkering infrastructure in major ports.
- Environmental Concerns: Growing preference for environmentally friendly fuel sources.
Growth Potential: The Tanker Fleet segment is poised for strong growth, projected to reach xx Million by 2033.
US LNG Bunkering Industry Product Landscape
LNG bunkering solutions are evolving, encompassing specialized vessels, innovative transfer technologies (e.g., ship-to-ship, truck-to-ship), and advanced safety features. The emphasis is on efficiency, safety, and minimal environmental impact. Products are differentiated based on capacity, speed of bunkering, and compatibility with different vessel types. Technological advancements, such as automated bunkering systems and remote monitoring capabilities, further enhance the appeal of LNG bunkering solutions.
Key Drivers, Barriers & Challenges in US LNG Bunkering Industry
Key Drivers:
- Stringent environmental regulations promoting cleaner fuels.
- Decreasing LNG prices and availability.
- Growing awareness of LNG's environmental benefits.
- Increasing infrastructure development to support LNG bunkering.
Key Challenges:
- High initial investment costs associated with LNG bunkering infrastructure.
- Limited availability of LNG bunkering infrastructure in certain regions.
- Potential safety concerns related to LNG handling and storage.
- Competition from traditional marine fuels.
Emerging Opportunities in US LNG Bunkering Industry
Untapped markets exist in smaller ports and inland waterways. Opportunities also lie in developing innovative bunkering solutions for specialized vessels (e.g., cruise ships, ferries) and in expanding LNG bunkering services to emerging markets within the US. The integration of digital technologies, such as blockchain for supply chain optimization, presents further opportunities.
Growth Accelerators in the US LNG Bunkering Industry
Technological advancements in LNG bunkering systems, strategic partnerships between LNG suppliers and shipping companies, and expansion of LNG bunkering infrastructure are key catalysts driving long-term growth. Government incentives and supportive policies further enhance the market potential.
Key Players Shaping the US LNG Bunkering Industry Market
- NorthStar Holdco Energy LLC
- Harvey Gulf International Marine LLC
- Eagle LNG Partners LLC
- Crowley Maritime Corporation
- Royal Dutch Shell PLC
- Conrad Shipyards LLC
- JAX LNG LLC
Notable Milestones in US LNG Bunkering Industry Sector
- 2020: Implementation of IMO 2020 significantly increases demand for cleaner marine fuels, including LNG.
- 2022: Several major LNG bunkering projects are initiated along the US coast.
- 2023: A significant increase in the number of LNG-fueled vessels operating in US waters.
In-Depth US LNG Bunkering Industry Market Outlook
The US LNG bunkering market is poised for sustained growth over the next decade, driven by a confluence of factors including stricter environmental regulations, increasing LNG infrastructure, and favorable government policies. Strategic partnerships and technological innovations are expected to further accelerate market expansion, presenting significant opportunities for both established players and new entrants. The market is predicted to demonstrate strong growth, with potential for substantial returns on investment in this dynamic sector.
US LNG Bunkering Industry Segmentation
-
1. End-User
- 1.1. Tanker Fleet
- 1.2. Container Fleet
- 1.3. Bulk and General Cargo Fleet
- 1.4. Ferries and OSV
- 1.5. Others
US LNG Bunkering Industry Segmentation By Geography
-
1. North America
- 1.1. United States
- 1.2. Canada
- 1.3. Mexico
-
2. South America
- 2.1. Brazil
- 2.2. Argentina
- 2.3. Rest of South America
-
3. Europe
- 3.1. United Kingdom
- 3.2. Germany
- 3.3. France
- 3.4. Italy
- 3.5. Spain
- 3.6. Russia
- 3.7. Benelux
- 3.8. Nordics
- 3.9. Rest of Europe
-
4. Middle East & Africa
- 4.1. Turkey
- 4.2. Israel
- 4.3. GCC
- 4.4. North Africa
- 4.5. South Africa
- 4.6. Rest of Middle East & Africa
-
5. Asia Pacific
- 5.1. China
- 5.2. India
- 5.3. Japan
- 5.4. South Korea
- 5.5. ASEAN
- 5.6. Oceania
- 5.7. Rest of Asia Pacific
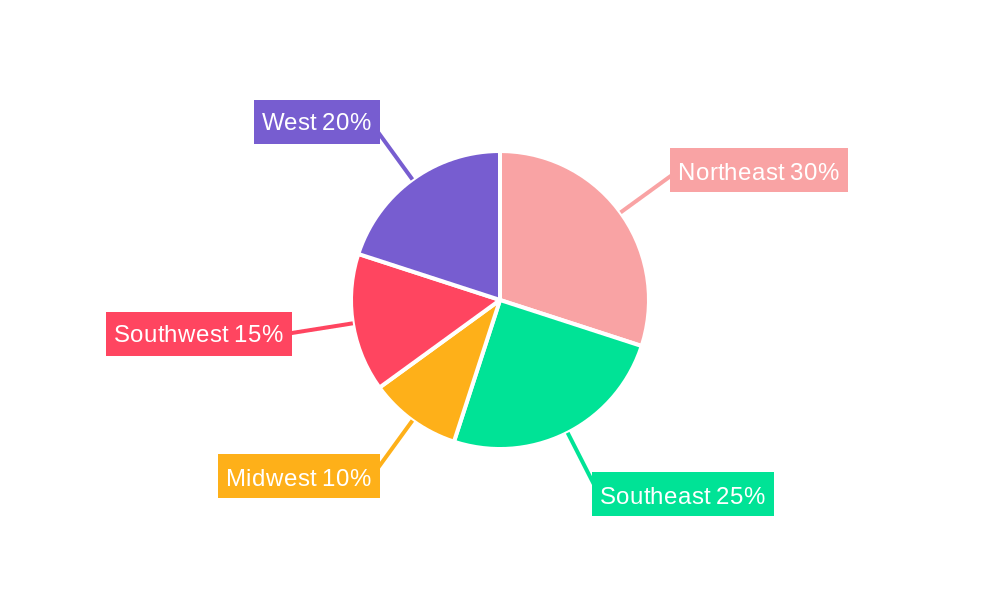
US LNG Bunkering Industry Regional Market Share
Geographic Coverage of US LNG Bunkering Industry
US LNG Bunkering Industry REPORT HIGHLIGHTS
| Aspects | Details |
|---|---|
| Study Period | 2020-2034 |
| Base Year | 2025 |
| Estimated Year | 2026 |
| Forecast Period | 2026-2034 |
| Historical Period | 2020-2025 |
| Growth Rate | CAGR of 6.8% from 2020-2034 |
| Segmentation |
|
Table of Contents
- 1. Introduction
- 1.1. Research Scope
- 1.2. Market Segmentation
- 1.3. Research Methodology
- 1.4. Definitions and Assumptions
- 2. Executive Summary
- 2.1. Introduction
- 3. Market Dynamics
- 3.1. Introduction
- 3.2. Market Drivers
- 3.2.1. 4.; Increasing Production from Unconventional Sources4.; Growing Energy Demand in the Region
- 3.3. Market Restrains
- 3.3.1. 4.; Environmental Concerns
- 3.4. Market Trends
- 3.4.1. Container Fleet is Expected to Dominate in the Market
- 4. Market Factor Analysis
- 4.1. Porters Five Forces
- 4.2. Supply/Value Chain
- 4.3. PESTEL analysis
- 4.4. Market Entropy
- 4.5. Patent/Trademark Analysis
- 5. Global US LNG Bunkering Industry Analysis, Insights and Forecast, 2020-2032
- 5.1. Market Analysis, Insights and Forecast - by End-User
- 5.1.1. Tanker Fleet
- 5.1.2. Container Fleet
- 5.1.3. Bulk and General Cargo Fleet
- 5.1.4. Ferries and OSV
- 5.1.5. Others
- 5.2. Market Analysis, Insights and Forecast - by Region
- 5.2.1. North America
- 5.2.2. South America
- 5.2.3. Europe
- 5.2.4. Middle East & Africa
- 5.2.5. Asia Pacific
- 5.1. Market Analysis, Insights and Forecast - by End-User
- 6. North America US LNG Bunkering Industry Analysis, Insights and Forecast, 2020-2032
- 6.1. Market Analysis, Insights and Forecast - by End-User
- 6.1.1. Tanker Fleet
- 6.1.2. Container Fleet
- 6.1.3. Bulk and General Cargo Fleet
- 6.1.4. Ferries and OSV
- 6.1.5. Others
- 6.1. Market Analysis, Insights and Forecast - by End-User
- 7. South America US LNG Bunkering Industry Analysis, Insights and Forecast, 2020-2032
- 7.1. Market Analysis, Insights and Forecast - by End-User
- 7.1.1. Tanker Fleet
- 7.1.2. Container Fleet
- 7.1.3. Bulk and General Cargo Fleet
- 7.1.4. Ferries and OSV
- 7.1.5. Others
- 7.1. Market Analysis, Insights and Forecast - by End-User
- 8. Europe US LNG Bunkering Industry Analysis, Insights and Forecast, 2020-2032
- 8.1. Market Analysis, Insights and Forecast - by End-User
- 8.1.1. Tanker Fleet
- 8.1.2. Container Fleet
- 8.1.3. Bulk and General Cargo Fleet
- 8.1.4. Ferries and OSV
- 8.1.5. Others
- 8.1. Market Analysis, Insights and Forecast - by End-User
- 9. Middle East & Africa US LNG Bunkering Industry Analysis, Insights and Forecast, 2020-2032
- 9.1. Market Analysis, Insights and Forecast - by End-User
- 9.1.1. Tanker Fleet
- 9.1.2. Container Fleet
- 9.1.3. Bulk and General Cargo Fleet
- 9.1.4. Ferries and OSV
- 9.1.5. Others
- 9.1. Market Analysis, Insights and Forecast - by End-User
- 10. Asia Pacific US LNG Bunkering Industry Analysis, Insights and Forecast, 2020-2032
- 10.1. Market Analysis, Insights and Forecast - by End-User
- 10.1.1. Tanker Fleet
- 10.1.2. Container Fleet
- 10.1.3. Bulk and General Cargo Fleet
- 10.1.4. Ferries and OSV
- 10.1.5. Others
- 10.1. Market Analysis, Insights and Forecast - by End-User
- 11. Competitive Analysis
- 11.1. Global Market Share Analysis 2025
- 11.2. Company Profiles
- 11.2.1 NorthStar Holdco Energy LLC
- 11.2.1.1. Overview
- 11.2.1.2. Products
- 11.2.1.3. SWOT Analysis
- 11.2.1.4. Recent Developments
- 11.2.1.5. Financials (Based on Availability)
- 11.2.2 Harvey Gulf International Marine LLC
- 11.2.2.1. Overview
- 11.2.2.2. Products
- 11.2.2.3. SWOT Analysis
- 11.2.2.4. Recent Developments
- 11.2.2.5. Financials (Based on Availability)
- 11.2.3 Eagle LNG Partners LLC
- 11.2.3.1. Overview
- 11.2.3.2. Products
- 11.2.3.3. SWOT Analysis
- 11.2.3.4. Recent Developments
- 11.2.3.5. Financials (Based on Availability)
- 11.2.4 Crowley Maritime Corporation
- 11.2.4.1. Overview
- 11.2.4.2. Products
- 11.2.4.3. SWOT Analysis
- 11.2.4.4. Recent Developments
- 11.2.4.5. Financials (Based on Availability)
- 11.2.5 Royal Dutch Shell PLC
- 11.2.5.1. Overview
- 11.2.5.2. Products
- 11.2.5.3. SWOT Analysis
- 11.2.5.4. Recent Developments
- 11.2.5.5. Financials (Based on Availability)
- 11.2.6 Conrad Shipyards LLC
- 11.2.6.1. Overview
- 11.2.6.2. Products
- 11.2.6.3. SWOT Analysis
- 11.2.6.4. Recent Developments
- 11.2.6.5. Financials (Based on Availability)
- 11.2.7 JAX LNG LLC
- 11.2.7.1. Overview
- 11.2.7.2. Products
- 11.2.7.3. SWOT Analysis
- 11.2.7.4. Recent Developments
- 11.2.7.5. Financials (Based on Availability)
- 11.2.1 NorthStar Holdco Energy LLC
List of Figures
- Figure 1: Global US LNG Bunkering Industry Revenue Breakdown (undefined, %) by Region 2025 & 2033
- Figure 2: North America US LNG Bunkering Industry Revenue (undefined), by End-User 2025 & 2033
- Figure 3: North America US LNG Bunkering Industry Revenue Share (%), by End-User 2025 & 2033
- Figure 4: North America US LNG Bunkering Industry Revenue (undefined), by Country 2025 & 2033
- Figure 5: North America US LNG Bunkering Industry Revenue Share (%), by Country 2025 & 2033
- Figure 6: South America US LNG Bunkering Industry Revenue (undefined), by End-User 2025 & 2033
- Figure 7: South America US LNG Bunkering Industry Revenue Share (%), by End-User 2025 & 2033
- Figure 8: South America US LNG Bunkering Industry Revenue (undefined), by Country 2025 & 2033
- Figure 9: South America US LNG Bunkering Industry Revenue Share (%), by Country 2025 & 2033
- Figure 10: Europe US LNG Bunkering Industry Revenue (undefined), by End-User 2025 & 2033
- Figure 11: Europe US LNG Bunkering Industry Revenue Share (%), by End-User 2025 & 2033
- Figure 12: Europe US LNG Bunkering Industry Revenue (undefined), by Country 2025 & 2033
- Figure 13: Europe US LNG Bunkering Industry Revenue Share (%), by Country 2025 & 2033
- Figure 14: Middle East & Africa US LNG Bunkering Industry Revenue (undefined), by End-User 2025 & 2033
- Figure 15: Middle East & Africa US LNG Bunkering Industry Revenue Share (%), by End-User 2025 & 2033
- Figure 16: Middle East & Africa US LNG Bunkering Industry Revenue (undefined), by Country 2025 & 2033
- Figure 17: Middle East & Africa US LNG Bunkering Industry Revenue Share (%), by Country 2025 & 2033
- Figure 18: Asia Pacific US LNG Bunkering Industry Revenue (undefined), by End-User 2025 & 2033
- Figure 19: Asia Pacific US LNG Bunkering Industry Revenue Share (%), by End-User 2025 & 2033
- Figure 20: Asia Pacific US LNG Bunkering Industry Revenue (undefined), by Country 2025 & 2033
- Figure 21: Asia Pacific US LNG Bunkering Industry Revenue Share (%), by Country 2025 & 2033
List of Tables
- Table 1: Global US LNG Bunkering Industry Revenue undefined Forecast, by End-User 2020 & 2033
- Table 2: Global US LNG Bunkering Industry Revenue undefined Forecast, by Region 2020 & 2033
- Table 3: Global US LNG Bunkering Industry Revenue undefined Forecast, by End-User 2020 & 2033
- Table 4: Global US LNG Bunkering Industry Revenue undefined Forecast, by Country 2020 & 2033
- Table 5: United States US LNG Bunkering Industry Revenue (undefined) Forecast, by Application 2020 & 2033
- Table 6: Canada US LNG Bunkering Industry Revenue (undefined) Forecast, by Application 2020 & 2033
- Table 7: Mexico US LNG Bunkering Industry Revenue (undefined) Forecast, by Application 2020 & 2033
- Table 8: Global US LNG Bunkering Industry Revenue undefined Forecast, by End-User 2020 & 2033
- Table 9: Global US LNG Bunkering Industry Revenue undefined Forecast, by Country 2020 & 2033
- Table 10: Brazil US LNG Bunkering Industry Revenue (undefined) Forecast, by Application 2020 & 2033
- Table 11: Argentina US LNG Bunkering Industry Revenue (undefined) Forecast, by Application 2020 & 2033
- Table 12: Rest of South America US LNG Bunkering Industry Revenue (undefined) Forecast, by Application 2020 & 2033
- Table 13: Global US LNG Bunkering Industry Revenue undefined Forecast, by End-User 2020 & 2033
- Table 14: Global US LNG Bunkering Industry Revenue undefined Forecast, by Country 2020 & 2033
- Table 15: United Kingdom US LNG Bunkering Industry Revenue (undefined) Forecast, by Application 2020 & 2033
- Table 16: Germany US LNG Bunkering Industry Revenue (undefined) Forecast, by Application 2020 & 2033
- Table 17: France US LNG Bunkering Industry Revenue (undefined) Forecast, by Application 2020 & 2033
- Table 18: Italy US LNG Bunkering Industry Revenue (undefined) Forecast, by Application 2020 & 2033
- Table 19: Spain US LNG Bunkering Industry Revenue (undefined) Forecast, by Application 2020 & 2033
- Table 20: Russia US LNG Bunkering Industry Revenue (undefined) Forecast, by Application 2020 & 2033
- Table 21: Benelux US LNG Bunkering Industry Revenue (undefined) Forecast, by Application 2020 & 2033
- Table 22: Nordics US LNG Bunkering Industry Revenue (undefined) Forecast, by Application 2020 & 2033
- Table 23: Rest of Europe US LNG Bunkering Industry Revenue (undefined) Forecast, by Application 2020 & 2033
- Table 24: Global US LNG Bunkering Industry Revenue undefined Forecast, by End-User 2020 & 2033
- Table 25: Global US LNG Bunkering Industry Revenue undefined Forecast, by Country 2020 & 2033
- Table 26: Turkey US LNG Bunkering Industry Revenue (undefined) Forecast, by Application 2020 & 2033
- Table 27: Israel US LNG Bunkering Industry Revenue (undefined) Forecast, by Application 2020 & 2033
- Table 28: GCC US LNG Bunkering Industry Revenue (undefined) Forecast, by Application 2020 & 2033
- Table 29: North Africa US LNG Bunkering Industry Revenue (undefined) Forecast, by Application 2020 & 2033
- Table 30: South Africa US LNG Bunkering Industry Revenue (undefined) Forecast, by Application 2020 & 2033
- Table 31: Rest of Middle East & Africa US LNG Bunkering Industry Revenue (undefined) Forecast, by Application 2020 & 2033
- Table 32: Global US LNG Bunkering Industry Revenue undefined Forecast, by End-User 2020 & 2033
- Table 33: Global US LNG Bunkering Industry Revenue undefined Forecast, by Country 2020 & 2033
- Table 34: China US LNG Bunkering Industry Revenue (undefined) Forecast, by Application 2020 & 2033
- Table 35: India US LNG Bunkering Industry Revenue (undefined) Forecast, by Application 2020 & 2033
- Table 36: Japan US LNG Bunkering Industry Revenue (undefined) Forecast, by Application 2020 & 2033
- Table 37: South Korea US LNG Bunkering Industry Revenue (undefined) Forecast, by Application 2020 & 2033
- Table 38: ASEAN US LNG Bunkering Industry Revenue (undefined) Forecast, by Application 2020 & 2033
- Table 39: Oceania US LNG Bunkering Industry Revenue (undefined) Forecast, by Application 2020 & 2033
- Table 40: Rest of Asia Pacific US LNG Bunkering Industry Revenue (undefined) Forecast, by Application 2020 & 2033
Frequently Asked Questions
1. What is the projected Compound Annual Growth Rate (CAGR) of the US LNG Bunkering Industry?
The projected CAGR is approximately 6.8%.
2. Which companies are prominent players in the US LNG Bunkering Industry?
Key companies in the market include NorthStar Holdco Energy LLC, Harvey Gulf International Marine LLC, Eagle LNG Partners LLC, Crowley Maritime Corporation, Royal Dutch Shell PLC, Conrad Shipyards LLC, JAX LNG LLC.
3. What are the main segments of the US LNG Bunkering Industry?
The market segments include End-User.
4. Can you provide details about the market size?
The market size is estimated to be USD XXX N/A as of 2022.
5. What are some drivers contributing to market growth?
4.; Increasing Production from Unconventional Sources4.; Growing Energy Demand in the Region.
6. What are the notable trends driving market growth?
Container Fleet is Expected to Dominate in the Market.
7. Are there any restraints impacting market growth?
4.; Environmental Concerns.
8. Can you provide examples of recent developments in the market?
N/A
9. What pricing options are available for accessing the report?
Pricing options include single-user, multi-user, and enterprise licenses priced at USD 3800, USD 4500, and USD 5800 respectively.
10. Is the market size provided in terms of value or volume?
The market size is provided in terms of value, measured in N/A.
11. Are there any specific market keywords associated with the report?
Yes, the market keyword associated with the report is "US LNG Bunkering Industry," which aids in identifying and referencing the specific market segment covered.
12. How do I determine which pricing option suits my needs best?
The pricing options vary based on user requirements and access needs. Individual users may opt for single-user licenses, while businesses requiring broader access may choose multi-user or enterprise licenses for cost-effective access to the report.
13. Are there any additional resources or data provided in the US LNG Bunkering Industry report?
While the report offers comprehensive insights, it's advisable to review the specific contents or supplementary materials provided to ascertain if additional resources or data are available.
14. How can I stay updated on further developments or reports in the US LNG Bunkering Industry?
To stay informed about further developments, trends, and reports in the US LNG Bunkering Industry, consider subscribing to industry newsletters, following relevant companies and organizations, or regularly checking reputable industry news sources and publications.
Methodology
Step 1 - Identification of Relevant Samples Size from Population Database


Step 2 - Approaches for Defining Global Market Size (Value, Volume* & Price*)

Note*: In applicable scenarios
Step 3 - Data Sources
Primary Research
- Web Analytics
- Survey Reports
- Research Institute
- Latest Research Reports
- Opinion Leaders
Secondary Research
- Annual Reports
- White Paper
- Latest Press Release
- Industry Association
- Paid Database
- Investor Presentations

Step 4 - Data Triangulation
Involves using different sources of information in order to increase the validity of a study
These sources are likely to be stakeholders in a program - participants, other researchers, program staff, other community members, and so on.
Then we put all data in single framework & apply various statistical tools to find out the dynamic on the market.
During the analysis stage, feedback from the stakeholder groups would be compared to determine areas of agreement as well as areas of divergence