

Key Insights
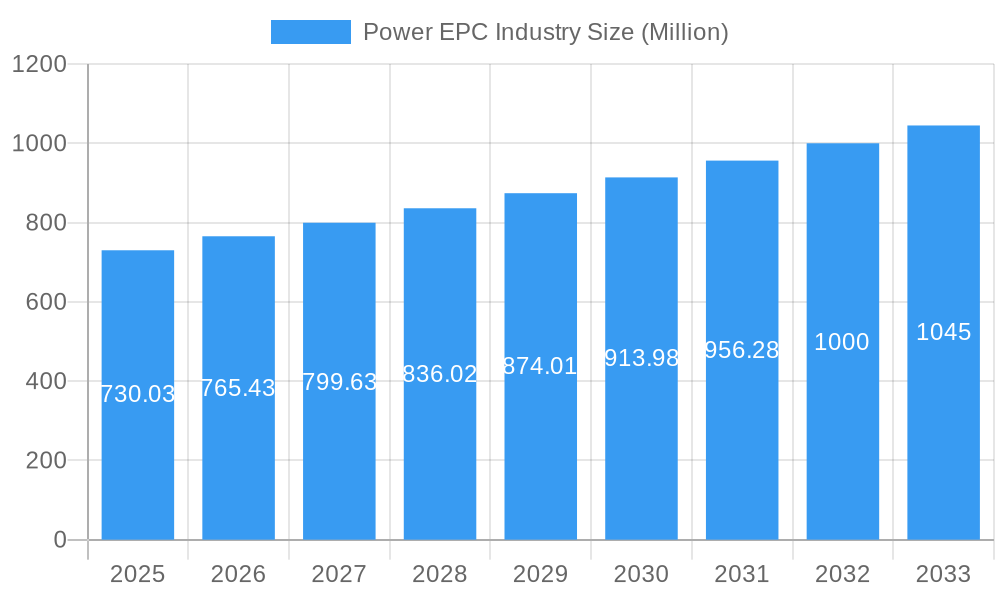
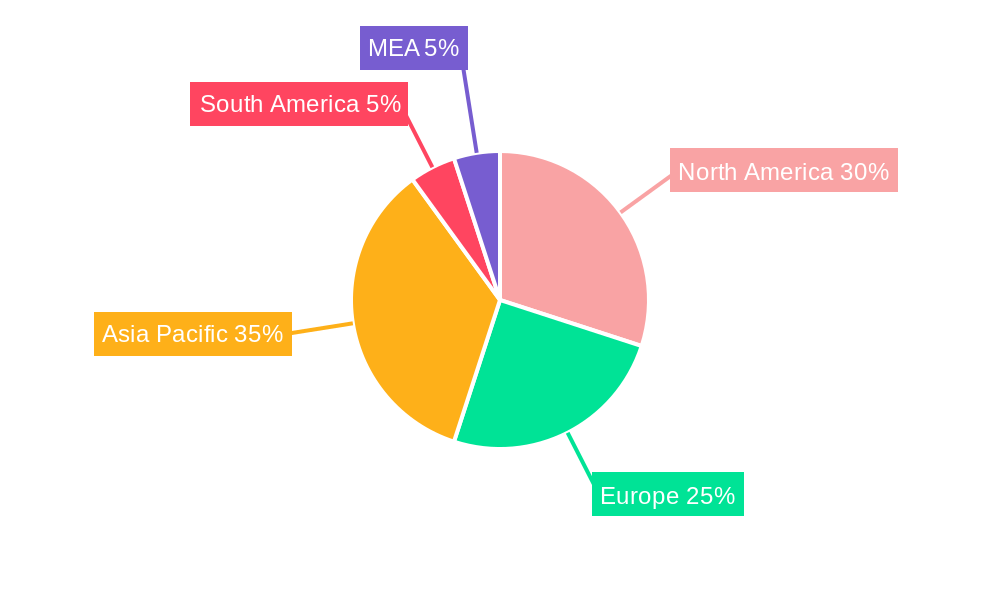
The global Power EPC (Engineering, Procurement, and Construction) market, valued at $730.03 million in 2025, is projected to experience robust growth, driven by increasing global energy demand and the imperative for a cleaner energy mix. A Compound Annual Growth Rate (CAGR) of 4.89% from 2025 to 2033 indicates significant expansion opportunities across various segments. The thermal power generation segment, while still substantial, is expected to see slower growth compared to the renewables sector, which is experiencing rapid expansion due to government incentives, technological advancements, and growing environmental concerns. Hydroelectric and nuclear power generation will maintain a steady presence, albeit with variations based on regional policies and resource availability. Key growth drivers include rising investments in renewable energy infrastructure, modernization of existing power plants, and increasing demand for grid modernization and expansion to accommodate intermittent renewable energy sources. Geographic growth will be diverse, with North America and Asia Pacific anticipated to lead the market due to significant investments in renewable energy and robust economic growth. However, regulatory hurdles, fluctuating energy prices, and geopolitical uncertainties represent potential market restraints. The competitive landscape is characterized by a mix of large multinational EPC contractors like Siemens Energy AG, ABB Ltd, and Bechtel Corporation, alongside specialized Original Equipment Manufacturers (OEMs) focusing on specific technologies and regional players.
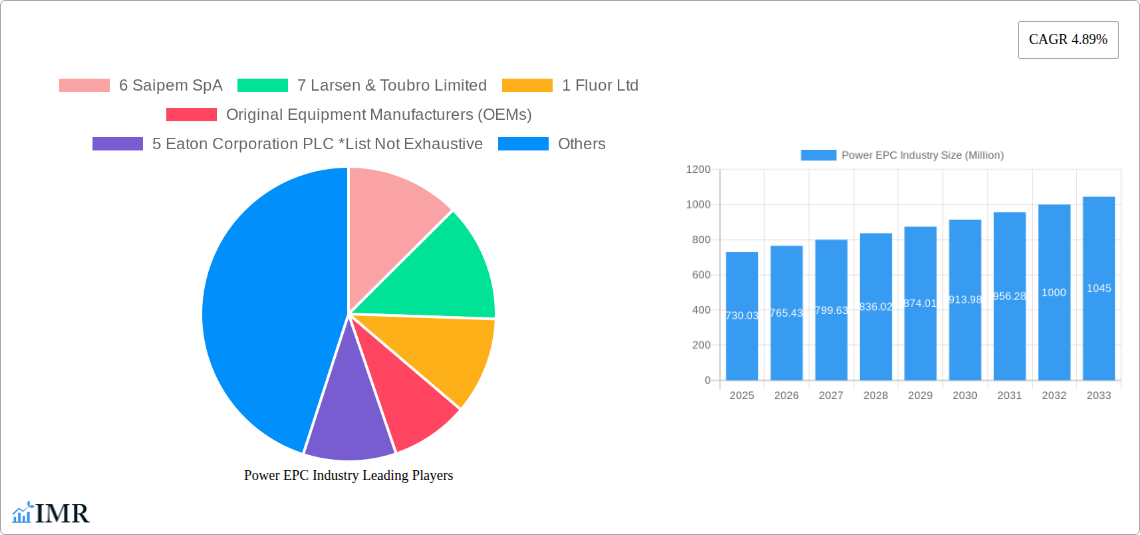
Power EPC Industry Market Size (In Million)
The success of companies in this market will hinge on their ability to adapt to changing technological advancements, secure project financing, manage complex supply chains, and meet stringent environmental regulations. Strategic partnerships, technological innovation, and a strong project execution track record will be crucial for competitiveness. The market's segmentation into different power generation types (thermal, hydroelectric, nuclear, renewables) allows for specialized service offerings. Furthermore, regional variations in energy policies and infrastructure development will necessitate tailored strategies for success. The forecast period, 2025-2033, presents a compelling investment opportunity for both established players and new entrants within specific niches or regions. Understanding the nuances of each segment and region will be critical in capitalizing on market opportunities.
Power EPC Industry Company Market Share
This comprehensive report provides an in-depth analysis of the Power EPC (Engineering, Procurement, and Construction) industry, encompassing market dynamics, growth trends, regional dominance, key players, and future outlook. The study period covers 2019-2033, with 2025 as the base and estimated year. This report is crucial for industry professionals, investors, and strategists seeking to understand and capitalize on opportunities within this dynamic sector. The parent market is the broader energy sector, with the child market specifically focusing on power generation EPC services.
Power EPC Industry Market Dynamics & Structure
The Power EPC industry is characterized by a moderately concentrated market structure, with a few major players holding significant market share. The combined market share of the top 10 companies (Saipem SpA, Larsen & Toubro Limited, Fluor Ltd, McDermott International Inc, Siemens Energy AG, John Wood PLC, ABB Ltd, General Electric Company, Bechtel Corporation, and KBR Inc) is estimated at xx%. Technological innovation, driven by the increasing adoption of renewables and the need for efficient power generation, is a key driver. Stringent regulatory frameworks concerning environmental sustainability and safety standards significantly impact industry operations. The rise of renewable energy sources presents both opportunities and challenges as a competitive substitute to traditional thermal power generation. The end-user demographics encompass power generation companies, industrial facilities, and government entities. The industry has witnessed considerable M&A activity in recent years, with an estimated xx number of deals valued at xx Million in the past five years, primarily driven by consolidation and expansion into new markets.
- Market Concentration: Moderately concentrated, with top 10 players holding xx% market share.
- Technological Innovation: Driven by renewable energy integration and efficiency improvements.
- Regulatory Framework: Stringent environmental and safety regulations.
- Competitive Substitutes: Renewable energy sources posing both challenges and opportunities.
- End-User Demographics: Power generation companies, industrial facilities, and government agencies.
- M&A Trends: Significant activity driven by consolidation and market expansion; xx deals valued at xx Million in the last 5 years.
- Innovation Barriers: High initial investment costs, technological complexity, and regulatory uncertainties.
Power EPC Industry Growth Trends & Insights
The Power EPC market is projected to experience substantial growth during the forecast period (2025-2033). Driven by increasing global energy demand, expanding power generation capacity, and the global shift towards renewable energy sources, the market size is expected to reach xx Million by 2033, exhibiting a CAGR of xx%. This growth is fueled by rising investments in renewable energy projects (solar, wind, hydro), coupled with modernization and expansion efforts in existing thermal power plants. Technological advancements, such as digitalization and automation in EPC processes, are further enhancing efficiency and reducing project timelines. Changing consumer behavior, with a growing preference for cleaner and sustainable energy solutions, is creating a favorable market environment.
Dominant Regions, Countries, or Segments in Power EPC Industry
The Asia-Pacific region is projected to dominate the Power EPC market during the forecast period, driven by robust economic growth, significant infrastructure development, and increasing investments in renewable energy projects. China and India are expected to be the key growth drivers within this region. Within power generation segments, Renewables (solar, wind, hydro) are experiencing the fastest growth, fueled by government incentives, declining technology costs, and environmental concerns.
- Key Drivers:
- Government policies promoting renewable energy adoption.
- Expanding power infrastructure needs.
- Growing investments from both public and private sectors.
- Dominance Factors:
- High growth potential in emerging economies.
- Favorable regulatory environment in certain regions.
- Technological advancements driving cost reduction.
Power EPC Industry Product Landscape
The Power EPC industry offers a diverse range of products and services, encompassing design, engineering, procurement, construction, and commissioning of power plants across various segments. Recent innovations focus on enhancing efficiency, reducing environmental impact, and optimizing project lifecycle management through the use of digital tools, modular construction, and advanced materials. The unique selling propositions often revolve around cost-effectiveness, technological expertise, and project delivery timelines. Technological advancements include the integration of smart grids, AI-powered predictive maintenance, and advanced automation technologies.
Key Drivers, Barriers & Challenges in Power EPC Industry
Key Drivers:
- Increasing global energy demand.
- Government investments in renewable energy infrastructure.
- Technological advancements leading to cost reductions.
- Growing awareness of environmental sustainability.
Key Challenges:
- Supply chain disruptions impacting project timelines and costs. (e.g., xx% increase in material costs in 2022 impacting project budgets by an estimated xx Million)
- Regulatory hurdles and permitting complexities.
- Intense competition among EPC companies.
Emerging Opportunities in Power EPC Industry
- Untapped markets in developing economies.
- Integration of smart grid technologies.
- Growth in distributed generation and microgrids.
- Increased demand for energy storage solutions.
Growth Accelerators in the Power EPC Industry
Technological breakthroughs in renewable energy technologies, strategic partnerships between EPC companies and technology providers, and expansion into new geographical markets are key growth catalysts. Government support programs and incentives further propel market growth.
Key Players Shaping the Power EPC Industry Market
- Saipem SpA
- Larsen & Toubro Limited
- Fluor Ltd
- Original Equipment Manufacturers (OEMs)
- Eaton Corporation PLC
- McDermott International Inc
- Siemens Energy AG
- John Wood PLC
- EPC Developers
- ABB Ltd
- General Electric Company
- Bechtel Corporation
- KBR Inc
- Schneider Electric SE
- Kiewit Corporation
Notable Milestones in Power EPC Industry Sector
- October 2023: NTPC Green Energy Ltd tendered a 300 MW solar EPC package, signifying the growing renewable energy sector.
- June 2022: Tata Power Solar Systems commissioned a 66 MW EPC project, highlighting ongoing investments in renewable energy projects.
In-Depth Power EPC Industry Market Outlook
The Power EPC industry is poised for significant growth, driven by the global energy transition and increasing demand for reliable and sustainable power solutions. Strategic partnerships, technological advancements, and expansion into new markets will shape future growth. The focus on renewable energy will continue to be a key driver, presenting immense opportunities for EPC companies to innovate and contribute to a cleaner energy future.
Power EPC Industry Segmentation
-
1. Power Generation
- 1.1. Thermal
- 1.2. Hydroelectric
- 1.3. Nuclear
- 1.4. Renewables
- 2. Power Tr
Power EPC Industry Segmentation By Geography
-
1. North America
- 1.1. United States
- 1.2. Canada
- 1.3. Rest of North America
-
2. Europe
- 2.1. Germany
- 2.2. United Kingdom
- 2.3. Italy
- 2.4. Spain
- 2.5. France
- 2.6. Rest of Europe
-
3. Asia Pacific
- 3.1. China
- 3.2. India
- 3.3. Japan
- 3.4. Australia
- 3.5. South Korea
- 3.6. Rest of Asia Pacific
-
4. South America
- 4.1. Brazil
- 4.2. Argentina
- 4.3. Chile
- 4.4. Rest of South America
-
5. Middle East and Africa
- 5.1. Saudi Arabia
- 5.2. United Arab Emirates
- 5.3. South Africa
- 5.4. Nigeria
- 5.5. Egypt
- 5.6. Rest of Middle East and Africa
Power EPC Industry Regional Market Share
Geographic Coverage of Power EPC Industry
Power EPC Industry REPORT HIGHLIGHTS
| Aspects | Details |
|---|---|
| Study Period | 2020-2034 |
| Base Year | 2025 |
| Estimated Year | 2026 |
| Forecast Period | 2026-2034 |
| Historical Period | 2020-2025 |
| Growth Rate | CAGR of 4.89% from 2020-2034 |
| Segmentation |
|
Table of Contents
- 1. Introduction
- 1.1. Research Scope
- 1.2. Market Segmentation
- 1.3. Research Methodology
- 1.4. Definitions and Assumptions
- 2. Executive Summary
- 2.1. Introduction
- 3. Market Dynamics
- 3.1. Introduction
- 3.2. Market Drivers
- 3.2.1. 4.; Growing Energy Demand4.; Renewable Energy Transition
- 3.3. Market Restrains
- 3.3.1. 4.; Phasing out of Conventional Sources of Electricity
- 3.4. Market Trends
- 3.4.1. Renewable Expected to be the Fastest-growing Market Segment
- 4. Market Factor Analysis
- 4.1. Porters Five Forces
- 4.2. Supply/Value Chain
- 4.3. PESTEL analysis
- 4.4. Market Entropy
- 4.5. Patent/Trademark Analysis
- 5. Global Power EPC Industry Analysis, Insights and Forecast, 2020-2032
- 5.1. Market Analysis, Insights and Forecast - by Power Generation
- 5.1.1. Thermal
- 5.1.2. Hydroelectric
- 5.1.3. Nuclear
- 5.1.4. Renewables
- 5.2. Market Analysis, Insights and Forecast - by Power Tr
- 5.3. Market Analysis, Insights and Forecast - by Region
- 5.3.1. North America
- 5.3.2. Europe
- 5.3.3. Asia Pacific
- 5.3.4. South America
- 5.3.5. Middle East and Africa
- 5.1. Market Analysis, Insights and Forecast - by Power Generation
- 6. North America Power EPC Industry Analysis, Insights and Forecast, 2020-2032
- 6.1. Market Analysis, Insights and Forecast - by Power Generation
- 6.1.1. Thermal
- 6.1.2. Hydroelectric
- 6.1.3. Nuclear
- 6.1.4. Renewables
- 6.2. Market Analysis, Insights and Forecast - by Power Tr
- 6.1. Market Analysis, Insights and Forecast - by Power Generation
- 7. Europe Power EPC Industry Analysis, Insights and Forecast, 2020-2032
- 7.1. Market Analysis, Insights and Forecast - by Power Generation
- 7.1.1. Thermal
- 7.1.2. Hydroelectric
- 7.1.3. Nuclear
- 7.1.4. Renewables
- 7.2. Market Analysis, Insights and Forecast - by Power Tr
- 7.1. Market Analysis, Insights and Forecast - by Power Generation
- 8. Asia Pacific Power EPC Industry Analysis, Insights and Forecast, 2020-2032
- 8.1. Market Analysis, Insights and Forecast - by Power Generation
- 8.1.1. Thermal
- 8.1.2. Hydroelectric
- 8.1.3. Nuclear
- 8.1.4. Renewables
- 8.2. Market Analysis, Insights and Forecast - by Power Tr
- 8.1. Market Analysis, Insights and Forecast - by Power Generation
- 9. South America Power EPC Industry Analysis, Insights and Forecast, 2020-2032
- 9.1. Market Analysis, Insights and Forecast - by Power Generation
- 9.1.1. Thermal
- 9.1.2. Hydroelectric
- 9.1.3. Nuclear
- 9.1.4. Renewables
- 9.2. Market Analysis, Insights and Forecast - by Power Tr
- 9.1. Market Analysis, Insights and Forecast - by Power Generation
- 10. Middle East and Africa Power EPC Industry Analysis, Insights and Forecast, 2020-2032
- 10.1. Market Analysis, Insights and Forecast - by Power Generation
- 10.1.1. Thermal
- 10.1.2. Hydroelectric
- 10.1.3. Nuclear
- 10.1.4. Renewables
- 10.2. Market Analysis, Insights and Forecast - by Power Tr
- 10.1. Market Analysis, Insights and Forecast - by Power Generation
- 11. Competitive Analysis
- 11.1. Global Market Share Analysis 2025
- 11.2. Company Profiles
- 11.2.1 6 Saipem SpA
- 11.2.1.1. Overview
- 11.2.1.2. Products
- 11.2.1.3. SWOT Analysis
- 11.2.1.4. Recent Developments
- 11.2.1.5. Financials (Based on Availability)
- 11.2.2 7 Larsen & Toubro Limited
- 11.2.2.1. Overview
- 11.2.2.2. Products
- 11.2.2.3. SWOT Analysis
- 11.2.2.4. Recent Developments
- 11.2.2.5. Financials (Based on Availability)
- 11.2.3 1 Fluor Ltd
- 11.2.3.1. Overview
- 11.2.3.2. Products
- 11.2.3.3. SWOT Analysis
- 11.2.3.4. Recent Developments
- 11.2.3.5. Financials (Based on Availability)
- 11.2.4 Original Equipment Manufacturers (OEMs)
- 11.2.4.1. Overview
- 11.2.4.2. Products
- 11.2.4.3. SWOT Analysis
- 11.2.4.4. Recent Developments
- 11.2.4.5. Financials (Based on Availability)
- 11.2.5 5 Eaton Corporation PLC *List Not Exhaustive
- 11.2.5.1. Overview
- 11.2.5.2. Products
- 11.2.5.3. SWOT Analysis
- 11.2.5.4. Recent Developments
- 11.2.5.5. Financials (Based on Availability)
- 11.2.6 4 McDermott International Inc
- 11.2.6.1. Overview
- 11.2.6.2. Products
- 11.2.6.3. SWOT Analysis
- 11.2.6.4. Recent Developments
- 11.2.6.5. Financials (Based on Availability)
- 11.2.7 2 Siemens Energy AG
- 11.2.7.1. Overview
- 11.2.7.2. Products
- 11.2.7.3. SWOT Analysis
- 11.2.7.4. Recent Developments
- 11.2.7.5. Financials (Based on Availability)
- 11.2.8 2 John Wood PLC
- 11.2.8.1. Overview
- 11.2.8.2. Products
- 11.2.8.3. SWOT Analysis
- 11.2.8.4. Recent Developments
- 11.2.8.5. Financials (Based on Availability)
- 11.2.9 EPC Developers
- 11.2.9.1. Overview
- 11.2.9.2. Products
- 11.2.9.3. SWOT Analysis
- 11.2.9.4. Recent Developments
- 11.2.9.5. Financials (Based on Availability)
- 11.2.10 3 ABB Ltd
- 11.2.10.1. Overview
- 11.2.10.2. Products
- 11.2.10.3. SWOT Analysis
- 11.2.10.4. Recent Developments
- 11.2.10.5. Financials (Based on Availability)
- 11.2.11 1 General Electric Company
- 11.2.11.1. Overview
- 11.2.11.2. Products
- 11.2.11.3. SWOT Analysis
- 11.2.11.4. Recent Developments
- 11.2.11.5. Financials (Based on Availability)
- 11.2.12 5 Bechtel Corporation
- 11.2.12.1. Overview
- 11.2.12.2. Products
- 11.2.12.3. SWOT Analysis
- 11.2.12.4. Recent Developments
- 11.2.12.5. Financials (Based on Availability)
- 11.2.13 8 KBR Inc
- 11.2.13.1. Overview
- 11.2.13.2. Products
- 11.2.13.3. SWOT Analysis
- 11.2.13.4. Recent Developments
- 11.2.13.5. Financials (Based on Availability)
- 11.2.14 4 Schneider Electric SE
- 11.2.14.1. Overview
- 11.2.14.2. Products
- 11.2.14.3. SWOT Analysis
- 11.2.14.4. Recent Developments
- 11.2.14.5. Financials (Based on Availability)
- 11.2.15 3 Kiewit Corporation
- 11.2.15.1. Overview
- 11.2.15.2. Products
- 11.2.15.3. SWOT Analysis
- 11.2.15.4. Recent Developments
- 11.2.15.5. Financials (Based on Availability)
- 11.2.1 6 Saipem SpA
List of Figures
- Figure 1: Global Power EPC Industry Revenue Breakdown (Million, %) by Region 2025 & 2033
- Figure 2: Global Power EPC Industry Volume Breakdown (Gigawatt, %) by Region 2025 & 2033
- Figure 3: North America Power EPC Industry Revenue (Million), by Power Generation 2025 & 2033
- Figure 4: North America Power EPC Industry Volume (Gigawatt), by Power Generation 2025 & 2033
- Figure 5: North America Power EPC Industry Revenue Share (%), by Power Generation 2025 & 2033
- Figure 6: North America Power EPC Industry Volume Share (%), by Power Generation 2025 & 2033
- Figure 7: North America Power EPC Industry Revenue (Million), by Power Tr 2025 & 2033
- Figure 8: North America Power EPC Industry Volume (Gigawatt), by Power Tr 2025 & 2033
- Figure 9: North America Power EPC Industry Revenue Share (%), by Power Tr 2025 & 2033
- Figure 10: North America Power EPC Industry Volume Share (%), by Power Tr 2025 & 2033
- Figure 11: North America Power EPC Industry Revenue (Million), by Country 2025 & 2033
- Figure 12: North America Power EPC Industry Volume (Gigawatt), by Country 2025 & 2033
- Figure 13: North America Power EPC Industry Revenue Share (%), by Country 2025 & 2033
- Figure 14: North America Power EPC Industry Volume Share (%), by Country 2025 & 2033
- Figure 15: Europe Power EPC Industry Revenue (Million), by Power Generation 2025 & 2033
- Figure 16: Europe Power EPC Industry Volume (Gigawatt), by Power Generation 2025 & 2033
- Figure 17: Europe Power EPC Industry Revenue Share (%), by Power Generation 2025 & 2033
- Figure 18: Europe Power EPC Industry Volume Share (%), by Power Generation 2025 & 2033
- Figure 19: Europe Power EPC Industry Revenue (Million), by Power Tr 2025 & 2033
- Figure 20: Europe Power EPC Industry Volume (Gigawatt), by Power Tr 2025 & 2033
- Figure 21: Europe Power EPC Industry Revenue Share (%), by Power Tr 2025 & 2033
- Figure 22: Europe Power EPC Industry Volume Share (%), by Power Tr 2025 & 2033
- Figure 23: Europe Power EPC Industry Revenue (Million), by Country 2025 & 2033
- Figure 24: Europe Power EPC Industry Volume (Gigawatt), by Country 2025 & 2033
- Figure 25: Europe Power EPC Industry Revenue Share (%), by Country 2025 & 2033
- Figure 26: Europe Power EPC Industry Volume Share (%), by Country 2025 & 2033
- Figure 27: Asia Pacific Power EPC Industry Revenue (Million), by Power Generation 2025 & 2033
- Figure 28: Asia Pacific Power EPC Industry Volume (Gigawatt), by Power Generation 2025 & 2033
- Figure 29: Asia Pacific Power EPC Industry Revenue Share (%), by Power Generation 2025 & 2033
- Figure 30: Asia Pacific Power EPC Industry Volume Share (%), by Power Generation 2025 & 2033
- Figure 31: Asia Pacific Power EPC Industry Revenue (Million), by Power Tr 2025 & 2033
- Figure 32: Asia Pacific Power EPC Industry Volume (Gigawatt), by Power Tr 2025 & 2033
- Figure 33: Asia Pacific Power EPC Industry Revenue Share (%), by Power Tr 2025 & 2033
- Figure 34: Asia Pacific Power EPC Industry Volume Share (%), by Power Tr 2025 & 2033
- Figure 35: Asia Pacific Power EPC Industry Revenue (Million), by Country 2025 & 2033
- Figure 36: Asia Pacific Power EPC Industry Volume (Gigawatt), by Country 2025 & 2033
- Figure 37: Asia Pacific Power EPC Industry Revenue Share (%), by Country 2025 & 2033
- Figure 38: Asia Pacific Power EPC Industry Volume Share (%), by Country 2025 & 2033
- Figure 39: South America Power EPC Industry Revenue (Million), by Power Generation 2025 & 2033
- Figure 40: South America Power EPC Industry Volume (Gigawatt), by Power Generation 2025 & 2033
- Figure 41: South America Power EPC Industry Revenue Share (%), by Power Generation 2025 & 2033
- Figure 42: South America Power EPC Industry Volume Share (%), by Power Generation 2025 & 2033
- Figure 43: South America Power EPC Industry Revenue (Million), by Power Tr 2025 & 2033
- Figure 44: South America Power EPC Industry Volume (Gigawatt), by Power Tr 2025 & 2033
- Figure 45: South America Power EPC Industry Revenue Share (%), by Power Tr 2025 & 2033
- Figure 46: South America Power EPC Industry Volume Share (%), by Power Tr 2025 & 2033
- Figure 47: South America Power EPC Industry Revenue (Million), by Country 2025 & 2033
- Figure 48: South America Power EPC Industry Volume (Gigawatt), by Country 2025 & 2033
- Figure 49: South America Power EPC Industry Revenue Share (%), by Country 2025 & 2033
- Figure 50: South America Power EPC Industry Volume Share (%), by Country 2025 & 2033
- Figure 51: Middle East and Africa Power EPC Industry Revenue (Million), by Power Generation 2025 & 2033
- Figure 52: Middle East and Africa Power EPC Industry Volume (Gigawatt), by Power Generation 2025 & 2033
- Figure 53: Middle East and Africa Power EPC Industry Revenue Share (%), by Power Generation 2025 & 2033
- Figure 54: Middle East and Africa Power EPC Industry Volume Share (%), by Power Generation 2025 & 2033
- Figure 55: Middle East and Africa Power EPC Industry Revenue (Million), by Power Tr 2025 & 2033
- Figure 56: Middle East and Africa Power EPC Industry Volume (Gigawatt), by Power Tr 2025 & 2033
- Figure 57: Middle East and Africa Power EPC Industry Revenue Share (%), by Power Tr 2025 & 2033
- Figure 58: Middle East and Africa Power EPC Industry Volume Share (%), by Power Tr 2025 & 2033
- Figure 59: Middle East and Africa Power EPC Industry Revenue (Million), by Country 2025 & 2033
- Figure 60: Middle East and Africa Power EPC Industry Volume (Gigawatt), by Country 2025 & 2033
- Figure 61: Middle East and Africa Power EPC Industry Revenue Share (%), by Country 2025 & 2033
- Figure 62: Middle East and Africa Power EPC Industry Volume Share (%), by Country 2025 & 2033
List of Tables
- Table 1: Global Power EPC Industry Revenue Million Forecast, by Power Generation 2020 & 2033
- Table 2: Global Power EPC Industry Volume Gigawatt Forecast, by Power Generation 2020 & 2033
- Table 3: Global Power EPC Industry Revenue Million Forecast, by Power Tr 2020 & 2033
- Table 4: Global Power EPC Industry Volume Gigawatt Forecast, by Power Tr 2020 & 2033
- Table 5: Global Power EPC Industry Revenue Million Forecast, by Region 2020 & 2033
- Table 6: Global Power EPC Industry Volume Gigawatt Forecast, by Region 2020 & 2033
- Table 7: Global Power EPC Industry Revenue Million Forecast, by Power Generation 2020 & 2033
- Table 8: Global Power EPC Industry Volume Gigawatt Forecast, by Power Generation 2020 & 2033
- Table 9: Global Power EPC Industry Revenue Million Forecast, by Power Tr 2020 & 2033
- Table 10: Global Power EPC Industry Volume Gigawatt Forecast, by Power Tr 2020 & 2033
- Table 11: Global Power EPC Industry Revenue Million Forecast, by Country 2020 & 2033
- Table 12: Global Power EPC Industry Volume Gigawatt Forecast, by Country 2020 & 2033
- Table 13: United States Power EPC Industry Revenue (Million) Forecast, by Application 2020 & 2033
- Table 14: United States Power EPC Industry Volume (Gigawatt) Forecast, by Application 2020 & 2033
- Table 15: Canada Power EPC Industry Revenue (Million) Forecast, by Application 2020 & 2033
- Table 16: Canada Power EPC Industry Volume (Gigawatt) Forecast, by Application 2020 & 2033
- Table 17: Rest of North America Power EPC Industry Revenue (Million) Forecast, by Application 2020 & 2033
- Table 18: Rest of North America Power EPC Industry Volume (Gigawatt) Forecast, by Application 2020 & 2033
- Table 19: Global Power EPC Industry Revenue Million Forecast, by Power Generation 2020 & 2033
- Table 20: Global Power EPC Industry Volume Gigawatt Forecast, by Power Generation 2020 & 2033
- Table 21: Global Power EPC Industry Revenue Million Forecast, by Power Tr 2020 & 2033
- Table 22: Global Power EPC Industry Volume Gigawatt Forecast, by Power Tr 2020 & 2033
- Table 23: Global Power EPC Industry Revenue Million Forecast, by Country 2020 & 2033
- Table 24: Global Power EPC Industry Volume Gigawatt Forecast, by Country 2020 & 2033
- Table 25: Germany Power EPC Industry Revenue (Million) Forecast, by Application 2020 & 2033
- Table 26: Germany Power EPC Industry Volume (Gigawatt) Forecast, by Application 2020 & 2033
- Table 27: United Kingdom Power EPC Industry Revenue (Million) Forecast, by Application 2020 & 2033
- Table 28: United Kingdom Power EPC Industry Volume (Gigawatt) Forecast, by Application 2020 & 2033
- Table 29: Italy Power EPC Industry Revenue (Million) Forecast, by Application 2020 & 2033
- Table 30: Italy Power EPC Industry Volume (Gigawatt) Forecast, by Application 2020 & 2033
- Table 31: Spain Power EPC Industry Revenue (Million) Forecast, by Application 2020 & 2033
- Table 32: Spain Power EPC Industry Volume (Gigawatt) Forecast, by Application 2020 & 2033
- Table 33: France Power EPC Industry Revenue (Million) Forecast, by Application 2020 & 2033
- Table 34: France Power EPC Industry Volume (Gigawatt) Forecast, by Application 2020 & 2033
- Table 35: Rest of Europe Power EPC Industry Revenue (Million) Forecast, by Application 2020 & 2033
- Table 36: Rest of Europe Power EPC Industry Volume (Gigawatt) Forecast, by Application 2020 & 2033
- Table 37: Global Power EPC Industry Revenue Million Forecast, by Power Generation 2020 & 2033
- Table 38: Global Power EPC Industry Volume Gigawatt Forecast, by Power Generation 2020 & 2033
- Table 39: Global Power EPC Industry Revenue Million Forecast, by Power Tr 2020 & 2033
- Table 40: Global Power EPC Industry Volume Gigawatt Forecast, by Power Tr 2020 & 2033
- Table 41: Global Power EPC Industry Revenue Million Forecast, by Country 2020 & 2033
- Table 42: Global Power EPC Industry Volume Gigawatt Forecast, by Country 2020 & 2033
- Table 43: China Power EPC Industry Revenue (Million) Forecast, by Application 2020 & 2033
- Table 44: China Power EPC Industry Volume (Gigawatt) Forecast, by Application 2020 & 2033
- Table 45: India Power EPC Industry Revenue (Million) Forecast, by Application 2020 & 2033
- Table 46: India Power EPC Industry Volume (Gigawatt) Forecast, by Application 2020 & 2033
- Table 47: Japan Power EPC Industry Revenue (Million) Forecast, by Application 2020 & 2033
- Table 48: Japan Power EPC Industry Volume (Gigawatt) Forecast, by Application 2020 & 2033
- Table 49: Australia Power EPC Industry Revenue (Million) Forecast, by Application 2020 & 2033
- Table 50: Australia Power EPC Industry Volume (Gigawatt) Forecast, by Application 2020 & 2033
- Table 51: South Korea Power EPC Industry Revenue (Million) Forecast, by Application 2020 & 2033
- Table 52: South Korea Power EPC Industry Volume (Gigawatt) Forecast, by Application 2020 & 2033
- Table 53: Rest of Asia Pacific Power EPC Industry Revenue (Million) Forecast, by Application 2020 & 2033
- Table 54: Rest of Asia Pacific Power EPC Industry Volume (Gigawatt) Forecast, by Application 2020 & 2033
- Table 55: Global Power EPC Industry Revenue Million Forecast, by Power Generation 2020 & 2033
- Table 56: Global Power EPC Industry Volume Gigawatt Forecast, by Power Generation 2020 & 2033
- Table 57: Global Power EPC Industry Revenue Million Forecast, by Power Tr 2020 & 2033
- Table 58: Global Power EPC Industry Volume Gigawatt Forecast, by Power Tr 2020 & 2033
- Table 59: Global Power EPC Industry Revenue Million Forecast, by Country 2020 & 2033
- Table 60: Global Power EPC Industry Volume Gigawatt Forecast, by Country 2020 & 2033
- Table 61: Brazil Power EPC Industry Revenue (Million) Forecast, by Application 2020 & 2033
- Table 62: Brazil Power EPC Industry Volume (Gigawatt) Forecast, by Application 2020 & 2033
- Table 63: Argentina Power EPC Industry Revenue (Million) Forecast, by Application 2020 & 2033
- Table 64: Argentina Power EPC Industry Volume (Gigawatt) Forecast, by Application 2020 & 2033
- Table 65: Chile Power EPC Industry Revenue (Million) Forecast, by Application 2020 & 2033
- Table 66: Chile Power EPC Industry Volume (Gigawatt) Forecast, by Application 2020 & 2033
- Table 67: Rest of South America Power EPC Industry Revenue (Million) Forecast, by Application 2020 & 2033
- Table 68: Rest of South America Power EPC Industry Volume (Gigawatt) Forecast, by Application 2020 & 2033
- Table 69: Global Power EPC Industry Revenue Million Forecast, by Power Generation 2020 & 2033
- Table 70: Global Power EPC Industry Volume Gigawatt Forecast, by Power Generation 2020 & 2033
- Table 71: Global Power EPC Industry Revenue Million Forecast, by Power Tr 2020 & 2033
- Table 72: Global Power EPC Industry Volume Gigawatt Forecast, by Power Tr 2020 & 2033
- Table 73: Global Power EPC Industry Revenue Million Forecast, by Country 2020 & 2033
- Table 74: Global Power EPC Industry Volume Gigawatt Forecast, by Country 2020 & 2033
- Table 75: Saudi Arabia Power EPC Industry Revenue (Million) Forecast, by Application 2020 & 2033
- Table 76: Saudi Arabia Power EPC Industry Volume (Gigawatt) Forecast, by Application 2020 & 2033
- Table 77: United Arab Emirates Power EPC Industry Revenue (Million) Forecast, by Application 2020 & 2033
- Table 78: United Arab Emirates Power EPC Industry Volume (Gigawatt) Forecast, by Application 2020 & 2033
- Table 79: South Africa Power EPC Industry Revenue (Million) Forecast, by Application 2020 & 2033
- Table 80: South Africa Power EPC Industry Volume (Gigawatt) Forecast, by Application 2020 & 2033
- Table 81: Nigeria Power EPC Industry Revenue (Million) Forecast, by Application 2020 & 2033
- Table 82: Nigeria Power EPC Industry Volume (Gigawatt) Forecast, by Application 2020 & 2033
- Table 83: Egypt Power EPC Industry Revenue (Million) Forecast, by Application 2020 & 2033
- Table 84: Egypt Power EPC Industry Volume (Gigawatt) Forecast, by Application 2020 & 2033
- Table 85: Rest of Middle East and Africa Power EPC Industry Revenue (Million) Forecast, by Application 2020 & 2033
- Table 86: Rest of Middle East and Africa Power EPC Industry Volume (Gigawatt) Forecast, by Application 2020 & 2033
Frequently Asked Questions
1. What is the projected Compound Annual Growth Rate (CAGR) of the Power EPC Industry?
The projected CAGR is approximately 4.89%.
2. Which companies are prominent players in the Power EPC Industry?
Key companies in the market include 6 Saipem SpA, 7 Larsen & Toubro Limited, 1 Fluor Ltd, Original Equipment Manufacturers (OEMs), 5 Eaton Corporation PLC *List Not Exhaustive, 4 McDermott International Inc, 2 Siemens Energy AG, 2 John Wood PLC, EPC Developers, 3 ABB Ltd, 1 General Electric Company, 5 Bechtel Corporation, 8 KBR Inc, 4 Schneider Electric SE, 3 Kiewit Corporation.
3. What are the main segments of the Power EPC Industry?
The market segments include Power Generation, Power Tr.
4. Can you provide details about the market size?
The market size is estimated to be USD 730.03 Million as of 2022.
5. What are some drivers contributing to market growth?
4.; Growing Energy Demand4.; Renewable Energy Transition.
6. What are the notable trends driving market growth?
Renewable Expected to be the Fastest-growing Market Segment.
7. Are there any restraints impacting market growth?
4.; Phasing out of Conventional Sources of Electricity.
8. Can you provide examples of recent developments in the market?
October 2023: NTPC Green Energy Ltd (NGEL), on behalf of North Eastern Electric Power Corp. Ltd (NEEPCO), has tendered the EPC package with land for the development of 300 MW of solar projects. The scope of work includes arrangement of land for the solar project and connectivity to the substation, design, engineering, manufacturing, supply, installation, commissioning, and operation and maintenance of the grid-connected solar PV projects.
9. What pricing options are available for accessing the report?
Pricing options include single-user, multi-user, and enterprise licenses priced at USD 4750, USD 5250, and USD 8750 respectively.
10. Is the market size provided in terms of value or volume?
The market size is provided in terms of value, measured in Million and volume, measured in Gigawatt.
11. Are there any specific market keywords associated with the report?
Yes, the market keyword associated with the report is "Power EPC Industry," which aids in identifying and referencing the specific market segment covered.
12. How do I determine which pricing option suits my needs best?
The pricing options vary based on user requirements and access needs. Individual users may opt for single-user licenses, while businesses requiring broader access may choose multi-user or enterprise licenses for cost-effective access to the report.
13. Are there any additional resources or data provided in the Power EPC Industry report?
While the report offers comprehensive insights, it's advisable to review the specific contents or supplementary materials provided to ascertain if additional resources or data are available.
14. How can I stay updated on further developments or reports in the Power EPC Industry?
To stay informed about further developments, trends, and reports in the Power EPC Industry, consider subscribing to industry newsletters, following relevant companies and organizations, or regularly checking reputable industry news sources and publications.
Methodology
Step 1 - Identification of Relevant Samples Size from Population Database


Step 2 - Approaches for Defining Global Market Size (Value, Volume* & Price*)

Note*: In applicable scenarios
Step 3 - Data Sources
Primary Research
- Web Analytics
- Survey Reports
- Research Institute
- Latest Research Reports
- Opinion Leaders
Secondary Research
- Annual Reports
- White Paper
- Latest Press Release
- Industry Association
- Paid Database
- Investor Presentations

Step 4 - Data Triangulation
Involves using different sources of information in order to increase the validity of a study
These sources are likely to be stakeholders in a program - participants, other researchers, program staff, other community members, and so on.
Then we put all data in single framework & apply various statistical tools to find out the dynamic on the market.
During the analysis stage, feedback from the stakeholder groups would be compared to determine areas of agreement as well as areas of divergence