

Key Insights
The Power-to-Gas (P2G) market is poised for substantial growth, projected to expand at a Compound Annual Growth Rate (CAGR) of 6.4% from a market size of 78.9 billion in the base year 2024. This expansion is propelled by the global imperative for energy decarbonization and the increasing integration of renewable energy sources. P2G technologies are vital for mitigating the intermittency of solar and wind power by converting surplus electricity into storable gaseous fuels like hydrogen and methane. Favorable government policies, including subsidies and carbon pricing, alongside advancements in P2G system efficiency and cost-effectiveness, are further stimulating market adoption. The market is segmented by technology (Power-to-Hydrogen, Power-to-Methane), capacity, and end-user (utilities, industrial, commercial). Utilities are currently leading adoption, with industrial and commercial sectors expected to follow as technologies mature.
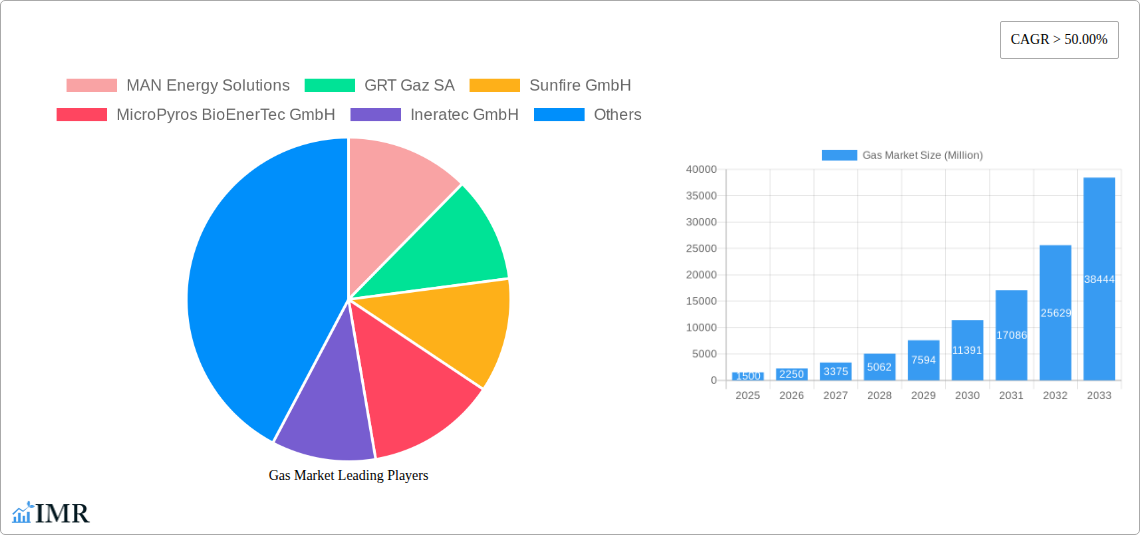
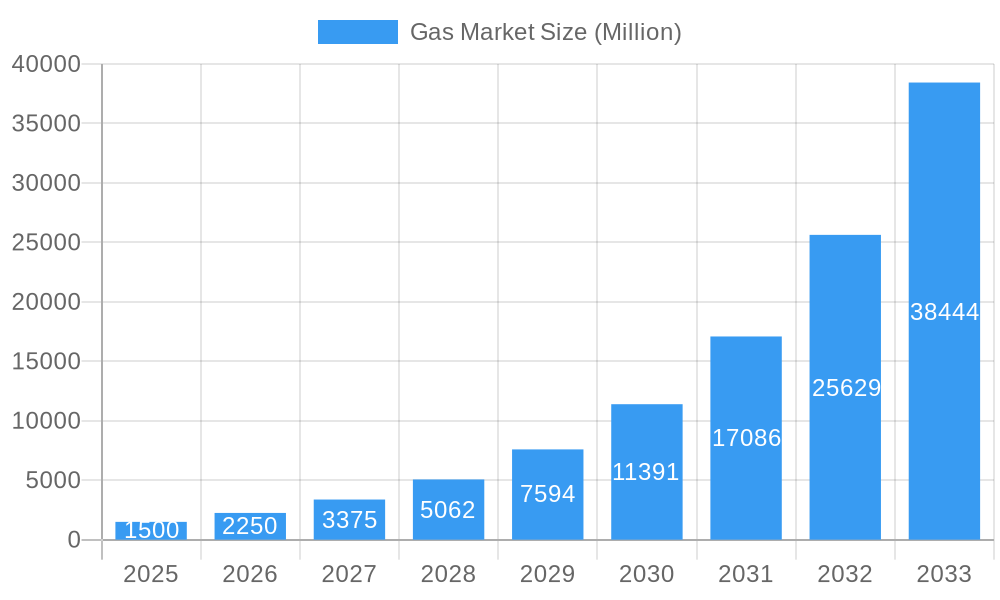
Gas Market Market Size (In Billion)
Geographically, North America and Europe lead the P2G market, supported by robust government initiatives and established renewable energy sectors. The Asia Pacific region is anticipated to experience significant growth, driven by economic development and expanding renewable energy infrastructure. Key market participants include major energy corporations and specialized technology providers. Competition is expected to intensify with technological innovation and new entrants. Challenges remain, including the substantial capital investment required for P2G infrastructure and the ongoing need for efficiency enhancements and cost reductions.
Gas Market Company Market Share
Gas Market: A Comprehensive Market Report (2019-2033)
This comprehensive report provides an in-depth analysis of the global Gas Market, encompassing market dynamics, growth trends, regional dominance, product landscape, key players, and future outlook. With a focus on the parent market of renewable energy and the child markets of Power-to-Hydrogen and Power-to-Methane, this report is an essential resource for industry professionals, investors, and strategists seeking to navigate this rapidly evolving sector. The study period covers 2019-2033, with 2025 as the base and estimated year.
Gas Market Market Dynamics & Structure
The Gas Market, driven by the global shift towards renewable energy sources, exhibits a dynamic interplay of technological advancements, regulatory frameworks, and competitive landscapes. Market concentration is moderate, with several key players vying for market share. Technological innovation, particularly in Power-to-Hydrogen and Power-to-Methane technologies, is a primary driver, while regulatory incentives and carbon reduction targets significantly influence market growth. Competitive product substitutes, such as traditional fossil fuels, pose a challenge, but the increasing cost of carbon emissions and the push for decarbonization are shifting the balance.
Quantitative & Qualitative Insights:
- Market Concentration: Moderate, with top 5 players holding approximately xx% market share in 2025 (estimated).
- M&A Activity: An estimated xx deals in the past 5 years, primarily focused on technological acquisitions and expansion into new markets.
- Innovation Barriers: High capital investment requirements, technological complexities, and standardization challenges hinder innovation.
- End-User Demographics: Utilities represent the largest segment (xx%), followed by Industrial (xx%) and Commercial (xx%).
Gas Market Growth Trends & Insights
The Gas Market is experiencing robust growth, fueled by the escalating demand for clean energy and the declining costs of renewable energy generation. The market size is projected to reach xx Million units by 2033, exhibiting a CAGR of xx% during the forecast period (2025-2033). Adoption rates are increasing rapidly, particularly in regions with supportive government policies and robust renewable energy infrastructure. Technological disruptions, such as advancements in electrolysis and carbon capture technologies, are accelerating market penetration. Consumer behavior is shifting towards sustainable energy solutions, creating a favorable environment for market expansion. The historical period (2019-2024) shows a consistent upward trend, paving the way for substantial future growth.
Dominant Regions, Countries, or Segments in Gas Market
North America and Europe currently dominate the Gas Market, driven by favorable regulatory frameworks, substantial investments in renewable energy infrastructure, and strong government support for hydrogen and methane production. Within these regions, countries like the US and Germany are leading the charge.
By Technology:
- Power-to-Hydrogen: Holds the largest market share (xx%), driven by its versatility and applications in various sectors.
- Power-to-Methane: Shows significant growth potential (xx% CAGR), with applications in transportation and energy storage.
By Capacity:
- More than 1000 KW: This segment holds significant market value due to larger-scale projects and economies of scale.
- 100 to 1000 KW: Experiencing substantial growth as the technology becomes more accessible.
- Less than 100 KW: This segment is expanding due to decentralized applications and off-grid solutions.
By End-User:
- Utilities: The largest segment due to their infrastructure and integration capabilities.
- Industrial: Significant demand driven by industrial processes and decarbonization efforts.
- Commercial: Growing adoption driven by environmental consciousness and cost savings.
Gas Market Product Landscape
The Gas Market is characterized by diverse product offerings, including various electrolyzer systems, gas purification technologies, and storage solutions. Product innovation focuses on enhancing efficiency, reducing costs, and improving scalability. Unique selling propositions include modular designs, advanced materials, and integration with renewable energy sources. Technological advancements are continuously improving the performance and reliability of these systems, driving market growth.
Key Drivers, Barriers & Challenges in Gas Market
Key Drivers:
- Stringent environmental regulations and carbon emission reduction targets.
- Growing demand for clean energy and sustainable transportation fuels.
- Government subsidies and incentives for renewable energy projects.
- Technological advancements reducing the cost of hydrogen and methane production.
Challenges & Restraints:
- High initial investment costs associated with renewable energy infrastructure.
- Intermittency of renewable energy sources requiring efficient energy storage solutions.
- Lack of standardized production and distribution infrastructure for green hydrogen and methane.
- Supply chain disruptions impacting the availability of raw materials and components.
Emerging Opportunities in Gas Market
- Untapped markets in developing economies with high renewable energy potential.
- Innovative applications of green hydrogen and methane in various industries.
- Evolving consumer preferences favoring environmentally friendly energy solutions.
Growth Accelerators in the Gas Market Industry
Strategic partnerships between renewable energy developers, technology providers, and end-users are accelerating market growth. Technological breakthroughs, such as improved electrolyzer efficiency and advanced carbon capture technologies, are significantly reducing production costs. Market expansion strategies focused on emerging markets and new applications are also contributing to the overall growth trajectory.
Key Players Shaping the Gas Market Market
- MAN Energy Solutions
- GRT Gaz SA
- Sunfire GmbH
- MicroPyros BioEnerTec GmbH
- Ineratec GmbH
- AquahydreX Inc
- Siemens Energy AG
- Electrochaea GmbH
- Hitachi Zosen Inova AG
- Sempra Energy
- Nel ASA
Notable Milestones in Gas Market Sector
- June 2022: USD 504.4 million investment by the US Department of Energy in the Advanced Clean Energy Storage project in Utah.
- February 2022: Mitsubishi Power's contract with HydrogenPro for a large-scale electrolyzer system.
In-Depth Gas Market Market Outlook
The Gas Market is poised for continued expansion, driven by strong tailwinds from government policies, technological advancements, and growing consumer demand for clean energy solutions. Strategic partnerships and investments in research and development will further accelerate market growth, creating significant opportunities for industry players. The focus on sustainability and decarbonization will ensure the long-term viability and growth of this sector.
Gas Market Segmentation
-
1. Technology
- 1.1. Power-to-Hydrogen
- 1.2. Power-to-Methane
-
2. Capacity (Qualitative Analysis Only)
- 2.1. More than 1000 KW
- 2.2. 100 to 1000 KW
- 2.3. Less than 100 KW
-
3. y End-User
- 3.1. Utilities
- 3.2. Industrial
- 3.3. Commercial
Gas Market Segmentation By Geography
- 1. North America
- 2. Europe
- 3. Asia Pacific
- 4. South America
- 5. Middle East and Africa
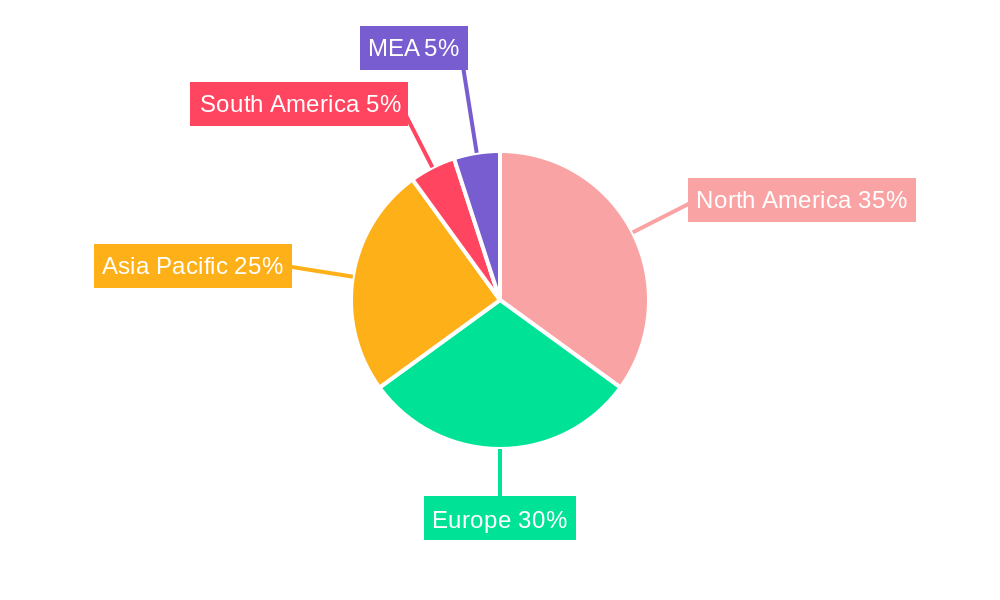
Gas Market Regional Market Share
Geographic Coverage of Gas Market
Gas Market REPORT HIGHLIGHTS
| Aspects | Details |
|---|---|
| Study Period | 2020-2034 |
| Base Year | 2025 |
| Estimated Year | 2026 |
| Forecast Period | 2026-2034 |
| Historical Period | 2020-2025 |
| Growth Rate | CAGR of 6.4% from 2020-2034 |
| Segmentation |
|
Table of Contents
- 1. Introduction
- 1.1. Research Scope
- 1.2. Market Segmentation
- 1.3. Research Objective
- 1.4. Definitions and Assumptions
- 2. Executive Summary
- 2.1. Market Snapshot
- 3. Market Dynamics
- 3.1. Market Drivers
- 3.2. Market Restrains
- 3.3. Market Trends
- 3.4. Market Opportunities
- 4. Market Factor Analysis
- 4.1. Porters Five Forces
- 4.1.1. Bargaining Power of Suppliers
- 4.1.2. Bargaining Power of Buyers
- 4.1.3. Threat of New Entrants
- 4.1.4. Threat of Substitutes
- 4.1.5. Competitive Rivalry
- 4.2. PESTEL analysis
- 4.3. BCG Analysis
- 4.3.1. Stars (High Growth, High Market Share)
- 4.3.2. Cash Cows (Low Growth, High Market Share)
- 4.3.3. Question Mark (High Growth, Low Market Share)
- 4.3.4. Dogs (Low Growth, Low Market Share)
- 4.4. Ansoff Matrix Analysis
- 4.5. Supply Chain Analysis
- 4.6. Regulatory Landscape
- 4.7. Current Market Potential and Opportunity Assessment (TAM–SAM–SOM Framework)
- 4.8. IMR Analyst Note
- 4.1. Porters Five Forces
- 5. Market Analysis, Insights and Forecast 2021-2033
- 5.1. Market Analysis, Insights and Forecast - by Technology
- 5.1.1. Power-to-Hydrogen
- 5.1.2. Power-to-Methane
- 5.2. Market Analysis, Insights and Forecast - by Capacity (Qualitative Analysis Only)
- 5.2.1. More than 1000 KW
- 5.2.2. 100 to 1000 KW
- 5.2.3. Less than 100 KW
- 5.3. Market Analysis, Insights and Forecast - by y End-User
- 5.3.1. Utilities
- 5.3.2. Industrial
- 5.3.3. Commercial
- 5.4. Market Analysis, Insights and Forecast - by Region
- 5.4.1. North America
- 5.4.2. Europe
- 5.4.3. Asia Pacific
- 5.4.4. South America
- 5.4.5. Middle East and Africa
- 5.1. Market Analysis, Insights and Forecast - by Technology
- 6. Global Gas Market Analysis, Insights and Forecast, 2021-2033
- 6.1. Market Analysis, Insights and Forecast - by Technology
- 6.1.1. Power-to-Hydrogen
- 6.1.2. Power-to-Methane
- 6.2. Market Analysis, Insights and Forecast - by Capacity (Qualitative Analysis Only)
- 6.2.1. More than 1000 KW
- 6.2.2. 100 to 1000 KW
- 6.2.3. Less than 100 KW
- 6.3. Market Analysis, Insights and Forecast - by y End-User
- 6.3.1. Utilities
- 6.3.2. Industrial
- 6.3.3. Commercial
- 6.1. Market Analysis, Insights and Forecast - by Technology
- 7. North America Gas Market Analysis, Insights and Forecast, 2020-2032
- 7.1. Market Analysis, Insights and Forecast - by Technology
- 7.1.1. Power-to-Hydrogen
- 7.1.2. Power-to-Methane
- 7.2. Market Analysis, Insights and Forecast - by Capacity (Qualitative Analysis Only)
- 7.2.1. More than 1000 KW
- 7.2.2. 100 to 1000 KW
- 7.2.3. Less than 100 KW
- 7.3. Market Analysis, Insights and Forecast - by y End-User
- 7.3.1. Utilities
- 7.3.2. Industrial
- 7.3.3. Commercial
- 7.1. Market Analysis, Insights and Forecast - by Technology
- 8. Europe Gas Market Analysis, Insights and Forecast, 2020-2032
- 8.1. Market Analysis, Insights and Forecast - by Technology
- 8.1.1. Power-to-Hydrogen
- 8.1.2. Power-to-Methane
- 8.2. Market Analysis, Insights and Forecast - by Capacity (Qualitative Analysis Only)
- 8.2.1. More than 1000 KW
- 8.2.2. 100 to 1000 KW
- 8.2.3. Less than 100 KW
- 8.3. Market Analysis, Insights and Forecast - by y End-User
- 8.3.1. Utilities
- 8.3.2. Industrial
- 8.3.3. Commercial
- 8.1. Market Analysis, Insights and Forecast - by Technology
- 9. Asia Pacific Gas Market Analysis, Insights and Forecast, 2020-2032
- 9.1. Market Analysis, Insights and Forecast - by Technology
- 9.1.1. Power-to-Hydrogen
- 9.1.2. Power-to-Methane
- 9.2. Market Analysis, Insights and Forecast - by Capacity (Qualitative Analysis Only)
- 9.2.1. More than 1000 KW
- 9.2.2. 100 to 1000 KW
- 9.2.3. Less than 100 KW
- 9.3. Market Analysis, Insights and Forecast - by y End-User
- 9.3.1. Utilities
- 9.3.2. Industrial
- 9.3.3. Commercial
- 9.1. Market Analysis, Insights and Forecast - by Technology
- 10. South America Gas Market Analysis, Insights and Forecast, 2020-2032
- 10.1. Market Analysis, Insights and Forecast - by Technology
- 10.1.1. Power-to-Hydrogen
- 10.1.2. Power-to-Methane
- 10.2. Market Analysis, Insights and Forecast - by Capacity (Qualitative Analysis Only)
- 10.2.1. More than 1000 KW
- 10.2.2. 100 to 1000 KW
- 10.2.3. Less than 100 KW
- 10.3. Market Analysis, Insights and Forecast - by y End-User
- 10.3.1. Utilities
- 10.3.2. Industrial
- 10.3.3. Commercial
- 10.1. Market Analysis, Insights and Forecast - by Technology
- 11. Middle East and Africa Gas Market Analysis, Insights and Forecast, 2020-2032
- 11.1. Market Analysis, Insights and Forecast - by Technology
- 11.1.1. Power-to-Hydrogen
- 11.1.2. Power-to-Methane
- 11.2. Market Analysis, Insights and Forecast - by Capacity (Qualitative Analysis Only)
- 11.2.1. More than 1000 KW
- 11.2.2. 100 to 1000 KW
- 11.2.3. Less than 100 KW
- 11.3. Market Analysis, Insights and Forecast - by y End-User
- 11.3.1. Utilities
- 11.3.2. Industrial
- 11.3.3. Commercial
- 11.1. Market Analysis, Insights and Forecast - by Technology
- 12. Competitive Analysis
- 12.1. Company Profiles
- 12.1.1 MAN Energy Solutions
- 12.1.1.1. Company Overview
- 12.1.1.2. Products
- 12.1.1.3. Company Financials
- 12.1.1.4. SWOT Analysis
- 12.1.2 GRT Gaz SA
- 12.1.2.1. Company Overview
- 12.1.2.2. Products
- 12.1.2.3. Company Financials
- 12.1.2.4. SWOT Analysis
- 12.1.3 Sunfire GmbH
- 12.1.3.1. Company Overview
- 12.1.3.2. Products
- 12.1.3.3. Company Financials
- 12.1.3.4. SWOT Analysis
- 12.1.4 MicroPyros BioEnerTec GmbH
- 12.1.4.1. Company Overview
- 12.1.4.2. Products
- 12.1.4.3. Company Financials
- 12.1.4.4. SWOT Analysis
- 12.1.5 Ineratec GmbH
- 12.1.5.1. Company Overview
- 12.1.5.2. Products
- 12.1.5.3. Company Financials
- 12.1.5.4. SWOT Analysis
- 12.1.6 AquahydreX Inc *List Not Exhaustive
- 12.1.6.1. Company Overview
- 12.1.6.2. Products
- 12.1.6.3. Company Financials
- 12.1.6.4. SWOT Analysis
- 12.1.7 Siemens Energy AG
- 12.1.7.1. Company Overview
- 12.1.7.2. Products
- 12.1.7.3. Company Financials
- 12.1.7.4. SWOT Analysis
- 12.1.8 Electrochaea GmbH
- 12.1.8.1. Company Overview
- 12.1.8.2. Products
- 12.1.8.3. Company Financials
- 12.1.8.4. SWOT Analysis
- 12.1.9 Hitachi Zosen Inova AG
- 12.1.9.1. Company Overview
- 12.1.9.2. Products
- 12.1.9.3. Company Financials
- 12.1.9.4. SWOT Analysis
- 12.1.10 Sempra Energy
- 12.1.10.1. Company Overview
- 12.1.10.2. Products
- 12.1.10.3. Company Financials
- 12.1.10.4. SWOT Analysis
- 12.1.11 Nel ASA
- 12.1.11.1. Company Overview
- 12.1.11.2. Products
- 12.1.11.3. Company Financials
- 12.1.11.4. SWOT Analysis
- 12.1.1 MAN Energy Solutions
- 12.2. Market Entropy
- 12.2.1 Company's Key Areas Served
- 12.2.2 Recent Developments
- 12.3. Company Market Share Analysis 2025
- 12.3.1 Top 5 Companies Market Share Analysis
- 12.3.2 Top 3 Companies Market Share Analysis
- 12.4. List of Potential Customers
- 13. Research Methodology
List of Figures
- Figure 1: Global Gas Market Revenue Breakdown (billion, %) by Region 2025 & 2033
- Figure 2: North America Gas Market Revenue (billion), by Technology 2025 & 2033
- Figure 3: North America Gas Market Revenue Share (%), by Technology 2025 & 2033
- Figure 4: North America Gas Market Revenue (billion), by Capacity (Qualitative Analysis Only) 2025 & 2033
- Figure 5: North America Gas Market Revenue Share (%), by Capacity (Qualitative Analysis Only) 2025 & 2033
- Figure 6: North America Gas Market Revenue (billion), by y End-User 2025 & 2033
- Figure 7: North America Gas Market Revenue Share (%), by y End-User 2025 & 2033
- Figure 8: North America Gas Market Revenue (billion), by Country 2025 & 2033
- Figure 9: North America Gas Market Revenue Share (%), by Country 2025 & 2033
- Figure 10: Europe Gas Market Revenue (billion), by Technology 2025 & 2033
- Figure 11: Europe Gas Market Revenue Share (%), by Technology 2025 & 2033
- Figure 12: Europe Gas Market Revenue (billion), by Capacity (Qualitative Analysis Only) 2025 & 2033
- Figure 13: Europe Gas Market Revenue Share (%), by Capacity (Qualitative Analysis Only) 2025 & 2033
- Figure 14: Europe Gas Market Revenue (billion), by y End-User 2025 & 2033
- Figure 15: Europe Gas Market Revenue Share (%), by y End-User 2025 & 2033
- Figure 16: Europe Gas Market Revenue (billion), by Country 2025 & 2033
- Figure 17: Europe Gas Market Revenue Share (%), by Country 2025 & 2033
- Figure 18: Asia Pacific Gas Market Revenue (billion), by Technology 2025 & 2033
- Figure 19: Asia Pacific Gas Market Revenue Share (%), by Technology 2025 & 2033
- Figure 20: Asia Pacific Gas Market Revenue (billion), by Capacity (Qualitative Analysis Only) 2025 & 2033
- Figure 21: Asia Pacific Gas Market Revenue Share (%), by Capacity (Qualitative Analysis Only) 2025 & 2033
- Figure 22: Asia Pacific Gas Market Revenue (billion), by y End-User 2025 & 2033
- Figure 23: Asia Pacific Gas Market Revenue Share (%), by y End-User 2025 & 2033
- Figure 24: Asia Pacific Gas Market Revenue (billion), by Country 2025 & 2033
- Figure 25: Asia Pacific Gas Market Revenue Share (%), by Country 2025 & 2033
- Figure 26: South America Gas Market Revenue (billion), by Technology 2025 & 2033
- Figure 27: South America Gas Market Revenue Share (%), by Technology 2025 & 2033
- Figure 28: South America Gas Market Revenue (billion), by Capacity (Qualitative Analysis Only) 2025 & 2033
- Figure 29: South America Gas Market Revenue Share (%), by Capacity (Qualitative Analysis Only) 2025 & 2033
- Figure 30: South America Gas Market Revenue (billion), by y End-User 2025 & 2033
- Figure 31: South America Gas Market Revenue Share (%), by y End-User 2025 & 2033
- Figure 32: South America Gas Market Revenue (billion), by Country 2025 & 2033
- Figure 33: South America Gas Market Revenue Share (%), by Country 2025 & 2033
- Figure 34: Middle East and Africa Gas Market Revenue (billion), by Technology 2025 & 2033
- Figure 35: Middle East and Africa Gas Market Revenue Share (%), by Technology 2025 & 2033
- Figure 36: Middle East and Africa Gas Market Revenue (billion), by Capacity (Qualitative Analysis Only) 2025 & 2033
- Figure 37: Middle East and Africa Gas Market Revenue Share (%), by Capacity (Qualitative Analysis Only) 2025 & 2033
- Figure 38: Middle East and Africa Gas Market Revenue (billion), by y End-User 2025 & 2033
- Figure 39: Middle East and Africa Gas Market Revenue Share (%), by y End-User 2025 & 2033
- Figure 40: Middle East and Africa Gas Market Revenue (billion), by Country 2025 & 2033
- Figure 41: Middle East and Africa Gas Market Revenue Share (%), by Country 2025 & 2033
List of Tables
- Table 1: Global Gas Market Revenue billion Forecast, by Technology 2020 & 2033
- Table 2: Global Gas Market Revenue billion Forecast, by Capacity (Qualitative Analysis Only) 2020 & 2033
- Table 3: Global Gas Market Revenue billion Forecast, by y End-User 2020 & 2033
- Table 4: Global Gas Market Revenue billion Forecast, by Region 2020 & 2033
- Table 5: Global Gas Market Revenue billion Forecast, by Technology 2020 & 2033
- Table 6: Global Gas Market Revenue billion Forecast, by Capacity (Qualitative Analysis Only) 2020 & 2033
- Table 7: Global Gas Market Revenue billion Forecast, by y End-User 2020 & 2033
- Table 8: Global Gas Market Revenue billion Forecast, by Country 2020 & 2033
- Table 9: Global Gas Market Revenue billion Forecast, by Technology 2020 & 2033
- Table 10: Global Gas Market Revenue billion Forecast, by Capacity (Qualitative Analysis Only) 2020 & 2033
- Table 11: Global Gas Market Revenue billion Forecast, by y End-User 2020 & 2033
- Table 12: Global Gas Market Revenue billion Forecast, by Country 2020 & 2033
- Table 13: Global Gas Market Revenue billion Forecast, by Technology 2020 & 2033
- Table 14: Global Gas Market Revenue billion Forecast, by Capacity (Qualitative Analysis Only) 2020 & 2033
- Table 15: Global Gas Market Revenue billion Forecast, by y End-User 2020 & 2033
- Table 16: Global Gas Market Revenue billion Forecast, by Country 2020 & 2033
- Table 17: Global Gas Market Revenue billion Forecast, by Technology 2020 & 2033
- Table 18: Global Gas Market Revenue billion Forecast, by Capacity (Qualitative Analysis Only) 2020 & 2033
- Table 19: Global Gas Market Revenue billion Forecast, by y End-User 2020 & 2033
- Table 20: Global Gas Market Revenue billion Forecast, by Country 2020 & 2033
- Table 21: Global Gas Market Revenue billion Forecast, by Technology 2020 & 2033
- Table 22: Global Gas Market Revenue billion Forecast, by Capacity (Qualitative Analysis Only) 2020 & 2033
- Table 23: Global Gas Market Revenue billion Forecast, by y End-User 2020 & 2033
- Table 24: Global Gas Market Revenue billion Forecast, by Country 2020 & 2033
Frequently Asked Questions
1. What is the projected Compound Annual Growth Rate (CAGR) of the Gas Market?
The projected CAGR is approximately 6.4%.
2. Which companies are prominent players in the Gas Market?
Key companies in the market include MAN Energy Solutions, GRT Gaz SA, Sunfire GmbH, MicroPyros BioEnerTec GmbH, Ineratec GmbH, AquahydreX Inc *List Not Exhaustive, Siemens Energy AG, Electrochaea GmbH, Hitachi Zosen Inova AG, Sempra Energy, Nel ASA.
3. What are the main segments of the Gas Market?
The market segments include Technology, Capacity (Qualitative Analysis Only), y End-User.
4. Can you provide details about the market size?
The market size is estimated to be USD 78.9 billion as of 2022.
5. What are some drivers contributing to market growth?
4.; Growing Demand to Develop the Natural Gas Infrastructure4.; Increase in Offshore Oil and Gas Exploration and Production (E&P) Activities.
6. What are the notable trends driving market growth?
Power-to-hydrogen to be the Fastest-growing Segment.
7. Are there any restraints impacting market growth?
4.; High Volatility of Oil and Gas Prices.
8. Can you provide examples of recent developments in the market?
June 2022- The United States Department of Energy announced a USD 504.4 million investment to finance Advanced Clean Energy Storage, a clean hydrogen and energy storage facility capable of providing long-term energy storage. Located in Delta, Utah, the facility will combine 220 megawatts of alkaline electrolysis with two 4.5-million-barrel salt caverns to store clean hydrogen. When operational, the projects will capture excess renewable energy, store it as hydrogen, and deploy it as fuel for the Intermountain Power Agency's (IPA) Renewed Project-a hydrogen-capable gas turbine combined cycle power plant that intends to be fueled by 100% clean hydrogen by 2045 incrementally.
9. What pricing options are available for accessing the report?
Pricing options include single-user, multi-user, and enterprise licenses priced at USD 4750, USD 5250, and USD 8750 respectively.
10. Is the market size provided in terms of value or volume?
The market size is provided in terms of value, measured in billion.
11. Are there any specific market keywords associated with the report?
Yes, the market keyword associated with the report is "Gas Market," which aids in identifying and referencing the specific market segment covered.
12. How do I determine which pricing option suits my needs best?
The pricing options vary based on user requirements and access needs. Individual users may opt for single-user licenses, while businesses requiring broader access may choose multi-user or enterprise licenses for cost-effective access to the report.
13. Are there any additional resources or data provided in the Gas Market report?
While the report offers comprehensive insights, it's advisable to review the specific contents or supplementary materials provided to ascertain if additional resources or data are available.
14. How can I stay updated on further developments or reports in the Gas Market?
To stay informed about further developments, trends, and reports in the Gas Market, consider subscribing to industry newsletters, following relevant companies and organizations, or regularly checking reputable industry news sources and publications.
Methodology
Step 1 - Identification of Relevant Samples Size from Population Database


Step 2 - Approaches for Defining Global Market Size (Value, Volume* & Price*)

Note*: In applicable scenarios
Step 3 - Data Sources
Primary Research
- Web Analytics
- Survey Reports
- Research Institute
- Latest Research Reports
- Opinion Leaders
Secondary Research
- Annual Reports
- White Paper
- Latest Press Release
- Industry Association
- Paid Database
- Investor Presentations

Step 4 - Data Triangulation
Involves using different sources of information in order to increase the validity of a study
These sources are likely to be stakeholders in a program - participants, other researchers, program staff, other community members, and so on.
Then we put all data in single framework & apply various statistical tools to find out the dynamic on the market.
During the analysis stage, feedback from the stakeholder groups would be compared to determine areas of agreement as well as areas of divergence