

Key Insights
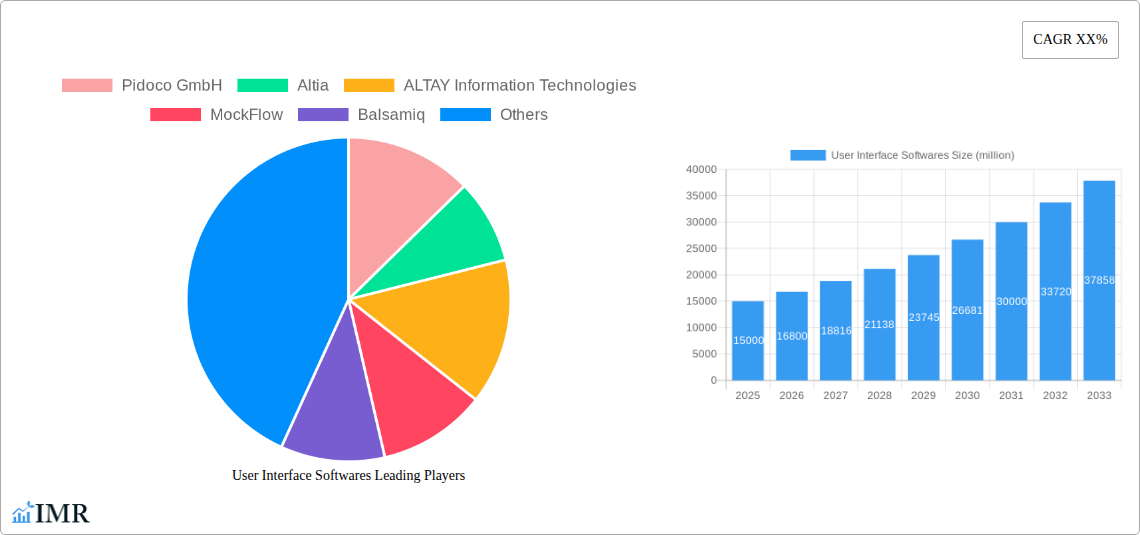
The User Interface (UI) software market is experiencing robust growth, driven by the increasing demand for intuitive and user-friendly digital experiences across various platforms. The market, estimated at $15 billion in 2025, is projected to exhibit a Compound Annual Growth Rate (CAGR) of 12% from 2025 to 2033, reaching approximately $45 billion by 2033. This expansion is fueled by several key factors, including the rising adoption of mobile and web applications, the increasing complexity of software development requiring specialized UI tools, and the growing focus on user experience (UX) design as a key differentiator for businesses. The market is segmented by software type (wireframing, prototyping, design, etc.), deployment (cloud, on-premise), and industry vertical (e-commerce, healthcare, finance, etc.). Competition is fierce, with established players like Adobe and Sketch alongside emerging innovative companies like Figma and ProtoPie vying for market share. The trend towards collaborative design tools and the integration of artificial intelligence (AI) for automated design elements are reshaping the market landscape.
Growth restraints include the high initial investment costs associated with implementing UI software, the need for specialized skills to effectively utilize the tools, and the evolving nature of UI/UX design trends that necessitate continuous learning and adaptation. However, the long-term benefits of improved user experiences, increased efficiency in software development, and enhanced brand image are driving widespread adoption, mitigating these restraints. The North American and European regions currently hold significant market share, but the Asia-Pacific region is expected to witness rapid growth in the coming years, driven by increasing digitalization and technological advancements. The market is dynamic and competitive, making continuous innovation and adaptation crucial for success.
User Interface (UI) Softwares Market Report: 2019-2033
This comprehensive report provides a detailed analysis of the UI Softwares market, encompassing market dynamics, growth trends, regional analysis, competitive landscape, and future outlook. The study period covers 2019-2033, with 2025 as the base and estimated year, and a forecast period of 2025-2033. The historical period analyzed is 2019-2024. The report caters to industry professionals, investors, and businesses seeking insights into this rapidly evolving market segment. The market is segmented by software type (wireframing, prototyping, UI design), deployment (cloud, on-premise), organization size (SMEs, large enterprises), and industry (IT, healthcare, retail etc.) The parent market is Software Development Tools, and the child markets are Wireframing tools, Prototyping tools and UI Design Tools. The market value in 2025 is estimated at $XX billion.
User Interface Softwares Market Dynamics & Structure
The UI Softwares market is characterized by a moderately fragmented landscape, with several established players and emerging competitors vying for market share. Technological innovation, particularly in areas like AI-powered design tools and collaborative platforms, is a key driver. Regulatory frameworks concerning data privacy and security significantly impact market players. The market experiences competitive pressure from open-source alternatives and evolving design trends. The end-user demographic is expanding to include a broader range of professionals, from designers and developers to marketing teams and business stakeholders. M&A activity has been moderate in recent years, with approximately XX deals recorded between 2019 and 2024, indicating a trend towards consolidation.
- Market Concentration: Moderately fragmented, with top 5 players holding approximately XX% market share in 2025.
- Technological Innovation: AI-powered design assistance, collaborative features, and AR/VR integration are major drivers.
- Regulatory Framework: GDPR, CCPA, and other data privacy regulations influence software development and deployment.
- Competitive Substitutes: Open-source tools, free design software, and in-house development present competitive challenges.
- End-User Demographics: Expanding beyond traditional designers to include marketers, business analysts, and product managers.
- M&A Trends: XX M&A deals between 2019-2024, indicating consolidation and strategic acquisitions in the sector.
User Interface Softwares Growth Trends & Insights
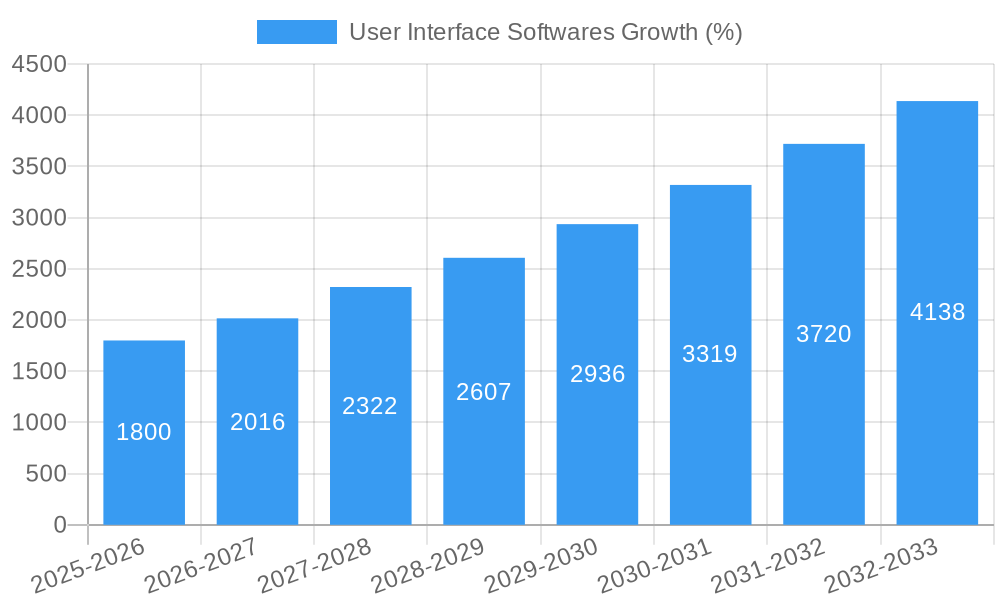
The UI Softwares market exhibits robust growth, driven by increasing demand for user-centric design and the widespread adoption of digital technologies across various industries. The market size experienced a CAGR of XX% during the historical period (2019-2024) and is projected to grow at a CAGR of XX% during the forecast period (2025-2033). This growth is fueled by technological disruptions, such as the rise of low-code/no-code platforms, and shifting consumer behavior towards personalized and intuitive digital experiences. Market penetration is increasing across diverse sectors, with significant adoption in IT, e-commerce, and the healthcare industry. The market value is expected to reach $XX billion by 2033.
Dominant Regions, Countries, or Segments in User Interface Softwares
North America currently holds the largest market share in the UI Softwares market, driven by factors such as high technological adoption, a strong presence of key players, and a mature software development ecosystem. Strong investments in R&D and a skilled workforce contribute to regional dominance. Europe follows as a significant market, with strong growth potential in emerging economies within the region. Asia Pacific is expected to witness the fastest growth, driven by rapid digitalization, rising internet penetration, and a burgeoning tech industry. The cloud-based segment displays high growth potential due to its scalability, cost-effectiveness, and accessibility.
- North America: High technological adoption, presence of major players, strong R&D investment.
- Europe: Mature market with growth potential in emerging economies.
- Asia Pacific: Fastest-growing region due to digitalization and expanding tech industry.
- Cloud-based segment: Highest growth potential driven by scalability and accessibility.
User Interface Softwares Product Landscape
The UI software landscape encompasses a diverse range of tools, from wireframing and prototyping solutions to advanced design and collaboration platforms. Products vary in functionality, pricing, and target user base. Key innovations include AI-powered design assistance, real-time collaboration features, and integration with other development tools. Products are differentiated by unique selling propositions such as ease of use, specific design capabilities (e.g., interaction design, animation), or industry-specific functionalities. Performance is measured by factors like rendering speed, user experience, and collaboration efficiency.
Key Drivers, Barriers & Challenges in User Interface Softwares
Key Drivers:
- Increased demand for user-centric design.
- Growing adoption of digital technologies across industries.
- Rise of low-code/no-code platforms.
- Technological advancements like AI and VR/AR integration.
Challenges and Restraints:
- High initial investment costs for advanced software.
- Competition from open-source alternatives.
- Difficulty in integrating with legacy systems.
- Maintaining data security and user privacy. A breach could lead to a XX million dollar loss in revenue.
Emerging Opportunities in User Interface Softwares
- Untapped Markets: Expansion into emerging economies and niche industries.
- Innovative Applications: Integration with IoT devices and AR/VR experiences.
- Evolving Consumer Preferences: Personalization, accessibility, and intuitive design.
- AI-powered design tools: Increased adoption for design automation and efficiency.
Growth Accelerators in the User Interface Softwares Industry
Strategic partnerships between software providers and technology companies are crucial for market expansion. Technological breakthroughs, such as advancements in AI and machine learning, enhance design capabilities and user experience. The adoption of cloud-based solutions improves accessibility and scalability.
Key Players Shaping the User Interface Softwares Market
- Pidoco GmbH
- Altia
- ALTAY Information Technologies
- MockFlow
- Balsamiq
- Axure
- Adobe Comp
- Sketch
- InVision Studio
- Marvel
- Figma
- Framer
- Flinto
- Principle
- UXPin
- ProtoPie
Notable Milestones in User Interface Softwares Sector
- 2020: Figma's widespread adoption among designers.
- 2021: Launch of several AI-powered UI design tools.
- 2022: Increased focus on accessibility features in UI software.
- 2023: Several mergers and acquisitions among smaller UI software companies.
- 2024: Growing interest in low-code/no-code UI development platforms.
In-Depth User Interface Softwares Market Outlook
The UI Softwares market is poised for continued growth, driven by technological advancements, increasing demand for user-centric design, and expansion into new markets. Strategic partnerships, focus on innovation, and effective marketing will be key to success for market players. The future holds significant opportunities for businesses that can leverage emerging technologies and address the evolving needs of diverse user groups.
User Interface Softwares Segmentation
-
1. Application
- 1.1. Automotive
- 1.2. IT & Telecom
- 1.3. Media & Entertainment
- 1.4. Others
-
2. Types
- 2.1. Standalone Software
- 2.2. Integrated Software
User Interface Softwares Segmentation By Geography
-
1. North America
- 1.1. United States
- 1.2. Canada
- 1.3. Mexico
-
2. South America
- 2.1. Brazil
- 2.2. Argentina
- 2.3. Rest of South America
-
3. Europe
- 3.1. United Kingdom
- 3.2. Germany
- 3.3. France
- 3.4. Italy
- 3.5. Spain
- 3.6. Russia
- 3.7. Benelux
- 3.8. Nordics
- 3.9. Rest of Europe
-
4. Middle East & Africa
- 4.1. Turkey
- 4.2. Israel
- 4.3. GCC
- 4.4. North Africa
- 4.5. South Africa
- 4.6. Rest of Middle East & Africa
-
5. Asia Pacific
- 5.1. China
- 5.2. India
- 5.3. Japan
- 5.4. South Korea
- 5.5. ASEAN
- 5.6. Oceania
- 5.7. Rest of Asia Pacific

User Interface Softwares REPORT HIGHLIGHTS
| Aspects | Details |
|---|---|
| Study Period | 2019-2033 |
| Base Year | 2024 |
| Estimated Year | 2025 |
| Forecast Period | 2025-2033 |
| Historical Period | 2019-2024 |
| Growth Rate | CAGR of XX% from 2019-2033 |
| Segmentation |
|
Table of Contents
- 1. Introduction
- 1.1. Research Scope
- 1.2. Market Segmentation
- 1.3. Research Methodology
- 1.4. Definitions and Assumptions
- 2. Executive Summary
- 2.1. Introduction
- 3. Market Dynamics
- 3.1. Introduction
- 3.2. Market Drivers
- 3.3. Market Restrains
- 3.4. Market Trends
- 4. Market Factor Analysis
- 4.1. Porters Five Forces
- 4.2. Supply/Value Chain
- 4.3. PESTEL analysis
- 4.4. Market Entropy
- 4.5. Patent/Trademark Analysis
- 5. Global User Interface Softwares Analysis, Insights and Forecast, 2019-2031
- 5.1. Market Analysis, Insights and Forecast - by Application
- 5.1.1. Automotive
- 5.1.2. IT & Telecom
- 5.1.3. Media & Entertainment
- 5.1.4. Others
- 5.2. Market Analysis, Insights and Forecast - by Types
- 5.2.1. Standalone Software
- 5.2.2. Integrated Software
- 5.3. Market Analysis, Insights and Forecast - by Region
- 5.3.1. North America
- 5.3.2. South America
- 5.3.3. Europe
- 5.3.4. Middle East & Africa
- 5.3.5. Asia Pacific
- 5.1. Market Analysis, Insights and Forecast - by Application
- 6. North America User Interface Softwares Analysis, Insights and Forecast, 2019-2031
- 6.1. Market Analysis, Insights and Forecast - by Application
- 6.1.1. Automotive
- 6.1.2. IT & Telecom
- 6.1.3. Media & Entertainment
- 6.1.4. Others
- 6.2. Market Analysis, Insights and Forecast - by Types
- 6.2.1. Standalone Software
- 6.2.2. Integrated Software
- 6.1. Market Analysis, Insights and Forecast - by Application
- 7. South America User Interface Softwares Analysis, Insights and Forecast, 2019-2031
- 7.1. Market Analysis, Insights and Forecast - by Application
- 7.1.1. Automotive
- 7.1.2. IT & Telecom
- 7.1.3. Media & Entertainment
- 7.1.4. Others
- 7.2. Market Analysis, Insights and Forecast - by Types
- 7.2.1. Standalone Software
- 7.2.2. Integrated Software
- 7.1. Market Analysis, Insights and Forecast - by Application
- 8. Europe User Interface Softwares Analysis, Insights and Forecast, 2019-2031
- 8.1. Market Analysis, Insights and Forecast - by Application
- 8.1.1. Automotive
- 8.1.2. IT & Telecom
- 8.1.3. Media & Entertainment
- 8.1.4. Others
- 8.2. Market Analysis, Insights and Forecast - by Types
- 8.2.1. Standalone Software
- 8.2.2. Integrated Software
- 8.1. Market Analysis, Insights and Forecast - by Application
- 9. Middle East & Africa User Interface Softwares Analysis, Insights and Forecast, 2019-2031
- 9.1. Market Analysis, Insights and Forecast - by Application
- 9.1.1. Automotive
- 9.1.2. IT & Telecom
- 9.1.3. Media & Entertainment
- 9.1.4. Others
- 9.2. Market Analysis, Insights and Forecast - by Types
- 9.2.1. Standalone Software
- 9.2.2. Integrated Software
- 9.1. Market Analysis, Insights and Forecast - by Application
- 10. Asia Pacific User Interface Softwares Analysis, Insights and Forecast, 2019-2031
- 10.1. Market Analysis, Insights and Forecast - by Application
- 10.1.1. Automotive
- 10.1.2. IT & Telecom
- 10.1.3. Media & Entertainment
- 10.1.4. Others
- 10.2. Market Analysis, Insights and Forecast - by Types
- 10.2.1. Standalone Software
- 10.2.2. Integrated Software
- 10.1. Market Analysis, Insights and Forecast - by Application
- 11. Competitive Analysis
- 11.1. Global Market Share Analysis 2024
- 11.2. Company Profiles
- 11.2.1 Pidoco GmbH
- 11.2.1.1. Overview
- 11.2.1.2. Products
- 11.2.1.3. SWOT Analysis
- 11.2.1.4. Recent Developments
- 11.2.1.5. Financials (Based on Availability)
- 11.2.2 Altia
- 11.2.2.1. Overview
- 11.2.2.2. Products
- 11.2.2.3. SWOT Analysis
- 11.2.2.4. Recent Developments
- 11.2.2.5. Financials (Based on Availability)
- 11.2.3 ALTAY Information Technologies
- 11.2.3.1. Overview
- 11.2.3.2. Products
- 11.2.3.3. SWOT Analysis
- 11.2.3.4. Recent Developments
- 11.2.3.5. Financials (Based on Availability)
- 11.2.4 MockFlow
- 11.2.4.1. Overview
- 11.2.4.2. Products
- 11.2.4.3. SWOT Analysis
- 11.2.4.4. Recent Developments
- 11.2.4.5. Financials (Based on Availability)
- 11.2.5 Balsamiq
- 11.2.5.1. Overview
- 11.2.5.2. Products
- 11.2.5.3. SWOT Analysis
- 11.2.5.4. Recent Developments
- 11.2.5.5. Financials (Based on Availability)
- 11.2.6 Axure
- 11.2.6.1. Overview
- 11.2.6.2. Products
- 11.2.6.3. SWOT Analysis
- 11.2.6.4. Recent Developments
- 11.2.6.5. Financials (Based on Availability)
- 11.2.7 Adobe Comp
- 11.2.7.1. Overview
- 11.2.7.2. Products
- 11.2.7.3. SWOT Analysis
- 11.2.7.4. Recent Developments
- 11.2.7.5. Financials (Based on Availability)
- 11.2.8 Sketch
- 11.2.8.1. Overview
- 11.2.8.2. Products
- 11.2.8.3. SWOT Analysis
- 11.2.8.4. Recent Developments
- 11.2.8.5. Financials (Based on Availability)
- 11.2.9 InVision Studio
- 11.2.9.1. Overview
- 11.2.9.2. Products
- 11.2.9.3. SWOT Analysis
- 11.2.9.4. Recent Developments
- 11.2.9.5. Financials (Based on Availability)
- 11.2.10 Marvel
- 11.2.10.1. Overview
- 11.2.10.2. Products
- 11.2.10.3. SWOT Analysis
- 11.2.10.4. Recent Developments
- 11.2.10.5. Financials (Based on Availability)
- 11.2.11 Figma
- 11.2.11.1. Overview
- 11.2.11.2. Products
- 11.2.11.3. SWOT Analysis
- 11.2.11.4. Recent Developments
- 11.2.11.5. Financials (Based on Availability)
- 11.2.12 Framer
- 11.2.12.1. Overview
- 11.2.12.2. Products
- 11.2.12.3. SWOT Analysis
- 11.2.12.4. Recent Developments
- 11.2.12.5. Financials (Based on Availability)
- 11.2.13 Flinto
- 11.2.13.1. Overview
- 11.2.13.2. Products
- 11.2.13.3. SWOT Analysis
- 11.2.13.4. Recent Developments
- 11.2.13.5. Financials (Based on Availability)
- 11.2.14 Principle
- 11.2.14.1. Overview
- 11.2.14.2. Products
- 11.2.14.3. SWOT Analysis
- 11.2.14.4. Recent Developments
- 11.2.14.5. Financials (Based on Availability)
- 11.2.15 UXPin
- 11.2.15.1. Overview
- 11.2.15.2. Products
- 11.2.15.3. SWOT Analysis
- 11.2.15.4. Recent Developments
- 11.2.15.5. Financials (Based on Availability)
- 11.2.16 ProtoPie
- 11.2.16.1. Overview
- 11.2.16.2. Products
- 11.2.16.3. SWOT Analysis
- 11.2.16.4. Recent Developments
- 11.2.16.5. Financials (Based on Availability)
- 11.2.1 Pidoco GmbH
List of Figures
- Figure 1: Global User Interface Softwares Revenue Breakdown (million, %) by Region 2024 & 2032
- Figure 2: North America User Interface Softwares Revenue (million), by Application 2024 & 2032
- Figure 3: North America User Interface Softwares Revenue Share (%), by Application 2024 & 2032
- Figure 4: North America User Interface Softwares Revenue (million), by Types 2024 & 2032
- Figure 5: North America User Interface Softwares Revenue Share (%), by Types 2024 & 2032
- Figure 6: North America User Interface Softwares Revenue (million), by Country 2024 & 2032
- Figure 7: North America User Interface Softwares Revenue Share (%), by Country 2024 & 2032
- Figure 8: South America User Interface Softwares Revenue (million), by Application 2024 & 2032
- Figure 9: South America User Interface Softwares Revenue Share (%), by Application 2024 & 2032
- Figure 10: South America User Interface Softwares Revenue (million), by Types 2024 & 2032
- Figure 11: South America User Interface Softwares Revenue Share (%), by Types 2024 & 2032
- Figure 12: South America User Interface Softwares Revenue (million), by Country 2024 & 2032
- Figure 13: South America User Interface Softwares Revenue Share (%), by Country 2024 & 2032
- Figure 14: Europe User Interface Softwares Revenue (million), by Application 2024 & 2032
- Figure 15: Europe User Interface Softwares Revenue Share (%), by Application 2024 & 2032
- Figure 16: Europe User Interface Softwares Revenue (million), by Types 2024 & 2032
- Figure 17: Europe User Interface Softwares Revenue Share (%), by Types 2024 & 2032
- Figure 18: Europe User Interface Softwares Revenue (million), by Country 2024 & 2032
- Figure 19: Europe User Interface Softwares Revenue Share (%), by Country 2024 & 2032
- Figure 20: Middle East & Africa User Interface Softwares Revenue (million), by Application 2024 & 2032
- Figure 21: Middle East & Africa User Interface Softwares Revenue Share (%), by Application 2024 & 2032
- Figure 22: Middle East & Africa User Interface Softwares Revenue (million), by Types 2024 & 2032
- Figure 23: Middle East & Africa User Interface Softwares Revenue Share (%), by Types 2024 & 2032
- Figure 24: Middle East & Africa User Interface Softwares Revenue (million), by Country 2024 & 2032
- Figure 25: Middle East & Africa User Interface Softwares Revenue Share (%), by Country 2024 & 2032
- Figure 26: Asia Pacific User Interface Softwares Revenue (million), by Application 2024 & 2032
- Figure 27: Asia Pacific User Interface Softwares Revenue Share (%), by Application 2024 & 2032
- Figure 28: Asia Pacific User Interface Softwares Revenue (million), by Types 2024 & 2032
- Figure 29: Asia Pacific User Interface Softwares Revenue Share (%), by Types 2024 & 2032
- Figure 30: Asia Pacific User Interface Softwares Revenue (million), by Country 2024 & 2032
- Figure 31: Asia Pacific User Interface Softwares Revenue Share (%), by Country 2024 & 2032
List of Tables
- Table 1: Global User Interface Softwares Revenue million Forecast, by Region 2019 & 2032
- Table 2: Global User Interface Softwares Revenue million Forecast, by Application 2019 & 2032
- Table 3: Global User Interface Softwares Revenue million Forecast, by Types 2019 & 2032
- Table 4: Global User Interface Softwares Revenue million Forecast, by Region 2019 & 2032
- Table 5: Global User Interface Softwares Revenue million Forecast, by Application 2019 & 2032
- Table 6: Global User Interface Softwares Revenue million Forecast, by Types 2019 & 2032
- Table 7: Global User Interface Softwares Revenue million Forecast, by Country 2019 & 2032
- Table 8: United States User Interface Softwares Revenue (million) Forecast, by Application 2019 & 2032
- Table 9: Canada User Interface Softwares Revenue (million) Forecast, by Application 2019 & 2032
- Table 10: Mexico User Interface Softwares Revenue (million) Forecast, by Application 2019 & 2032
- Table 11: Global User Interface Softwares Revenue million Forecast, by Application 2019 & 2032
- Table 12: Global User Interface Softwares Revenue million Forecast, by Types 2019 & 2032
- Table 13: Global User Interface Softwares Revenue million Forecast, by Country 2019 & 2032
- Table 14: Brazil User Interface Softwares Revenue (million) Forecast, by Application 2019 & 2032
- Table 15: Argentina User Interface Softwares Revenue (million) Forecast, by Application 2019 & 2032
- Table 16: Rest of South America User Interface Softwares Revenue (million) Forecast, by Application 2019 & 2032
- Table 17: Global User Interface Softwares Revenue million Forecast, by Application 2019 & 2032
- Table 18: Global User Interface Softwares Revenue million Forecast, by Types 2019 & 2032
- Table 19: Global User Interface Softwares Revenue million Forecast, by Country 2019 & 2032
- Table 20: United Kingdom User Interface Softwares Revenue (million) Forecast, by Application 2019 & 2032
- Table 21: Germany User Interface Softwares Revenue (million) Forecast, by Application 2019 & 2032
- Table 22: France User Interface Softwares Revenue (million) Forecast, by Application 2019 & 2032
- Table 23: Italy User Interface Softwares Revenue (million) Forecast, by Application 2019 & 2032
- Table 24: Spain User Interface Softwares Revenue (million) Forecast, by Application 2019 & 2032
- Table 25: Russia User Interface Softwares Revenue (million) Forecast, by Application 2019 & 2032
- Table 26: Benelux User Interface Softwares Revenue (million) Forecast, by Application 2019 & 2032
- Table 27: Nordics User Interface Softwares Revenue (million) Forecast, by Application 2019 & 2032
- Table 28: Rest of Europe User Interface Softwares Revenue (million) Forecast, by Application 2019 & 2032
- Table 29: Global User Interface Softwares Revenue million Forecast, by Application 2019 & 2032
- Table 30: Global User Interface Softwares Revenue million Forecast, by Types 2019 & 2032
- Table 31: Global User Interface Softwares Revenue million Forecast, by Country 2019 & 2032
- Table 32: Turkey User Interface Softwares Revenue (million) Forecast, by Application 2019 & 2032
- Table 33: Israel User Interface Softwares Revenue (million) Forecast, by Application 2019 & 2032
- Table 34: GCC User Interface Softwares Revenue (million) Forecast, by Application 2019 & 2032
- Table 35: North Africa User Interface Softwares Revenue (million) Forecast, by Application 2019 & 2032
- Table 36: South Africa User Interface Softwares Revenue (million) Forecast, by Application 2019 & 2032
- Table 37: Rest of Middle East & Africa User Interface Softwares Revenue (million) Forecast, by Application 2019 & 2032
- Table 38: Global User Interface Softwares Revenue million Forecast, by Application 2019 & 2032
- Table 39: Global User Interface Softwares Revenue million Forecast, by Types 2019 & 2032
- Table 40: Global User Interface Softwares Revenue million Forecast, by Country 2019 & 2032
- Table 41: China User Interface Softwares Revenue (million) Forecast, by Application 2019 & 2032
- Table 42: India User Interface Softwares Revenue (million) Forecast, by Application 2019 & 2032
- Table 43: Japan User Interface Softwares Revenue (million) Forecast, by Application 2019 & 2032
- Table 44: South Korea User Interface Softwares Revenue (million) Forecast, by Application 2019 & 2032
- Table 45: ASEAN User Interface Softwares Revenue (million) Forecast, by Application 2019 & 2032
- Table 46: Oceania User Interface Softwares Revenue (million) Forecast, by Application 2019 & 2032
- Table 47: Rest of Asia Pacific User Interface Softwares Revenue (million) Forecast, by Application 2019 & 2032
Frequently Asked Questions
1. What is the projected Compound Annual Growth Rate (CAGR) of the User Interface Softwares?
The projected CAGR is approximately XX%.
2. Which companies are prominent players in the User Interface Softwares?
Key companies in the market include Pidoco GmbH, Altia, ALTAY Information Technologies, MockFlow, Balsamiq, Axure, Adobe Comp, Sketch, InVision Studio, Marvel, Figma, Framer, Flinto, Principle, UXPin, ProtoPie.
3. What are the main segments of the User Interface Softwares?
The market segments include Application, Types.
4. Can you provide details about the market size?
The market size is estimated to be USD XXX million as of 2022.
5. What are some drivers contributing to market growth?
N/A
6. What are the notable trends driving market growth?
N/A
7. Are there any restraints impacting market growth?
N/A
8. Can you provide examples of recent developments in the market?
N/A
9. What pricing options are available for accessing the report?
Pricing options include single-user, multi-user, and enterprise licenses priced at USD 2900.00, USD 4350.00, and USD 5800.00 respectively.
10. Is the market size provided in terms of value or volume?
The market size is provided in terms of value, measured in million.
11. Are there any specific market keywords associated with the report?
Yes, the market keyword associated with the report is "User Interface Softwares," which aids in identifying and referencing the specific market segment covered.
12. How do I determine which pricing option suits my needs best?
The pricing options vary based on user requirements and access needs. Individual users may opt for single-user licenses, while businesses requiring broader access may choose multi-user or enterprise licenses for cost-effective access to the report.
13. Are there any additional resources or data provided in the User Interface Softwares report?
While the report offers comprehensive insights, it's advisable to review the specific contents or supplementary materials provided to ascertain if additional resources or data are available.
14. How can I stay updated on further developments or reports in the User Interface Softwares?
To stay informed about further developments, trends, and reports in the User Interface Softwares, consider subscribing to industry newsletters, following relevant companies and organizations, or regularly checking reputable industry news sources and publications.
Methodology
Step 1 - Identification of Relevant Samples Size from Population Database


Step 2 - Approaches for Defining Global Market Size (Value, Volume* & Price*)

Note*: In applicable scenarios
Step 3 - Data Sources
Primary Research
- Web Analytics
- Survey Reports
- Research Institute
- Latest Research Reports
- Opinion Leaders
Secondary Research
- Annual Reports
- White Paper
- Latest Press Release
- Industry Association
- Paid Database
- Investor Presentations

Step 4 - Data Triangulation
Involves using different sources of information in order to increase the validity of a study
These sources are likely to be stakeholders in a program - participants, other researchers, program staff, other community members, and so on.
Then we put all data in single framework & apply various statistical tools to find out the dynamic on the market.
During the analysis stage, feedback from the stakeholder groups would be compared to determine areas of agreement as well as areas of divergence
