

Key Insights
The venture capital (VC) industry is experiencing robust growth, projected to maintain a Compound Annual Growth Rate (CAGR) exceeding 5% from 2025 to 2033. This expansion is fueled by several key drivers. Firstly, a surge in technological innovation across sectors like artificial intelligence, biotechnology, and sustainable energy is attracting significant investment. Secondly, the increasing availability of alternative investment options and the growing appetite for higher risk, higher return opportunities among institutional and individual investors is bolstering the VC market. Finally, government initiatives promoting innovation and entrepreneurship, coupled with favorable regulatory environments in many regions, further stimulate VC activity. While geographical variations exist, North America and Europe currently dominate the market, though Asia is experiencing rapid growth, attracting substantial investment from firms like GGV Capital and IDG Capital. The competitive landscape is marked by prominent players like Tiger Global Management, Sequoia Capital, and DST Global, constantly vying for promising startups. However, potential restraints include economic downturns that can impact investor confidence and funding availability, as well as increased regulatory scrutiny aimed at enhancing transparency and accountability within the industry. Market segmentation is largely driven by investment stage (seed, Series A, etc.), industry focus, and geographical location. The forecast indicates continued market expansion driven by the factors mentioned above, but also highlights the importance of navigating economic volatility and adjusting to evolving regulatory frameworks.
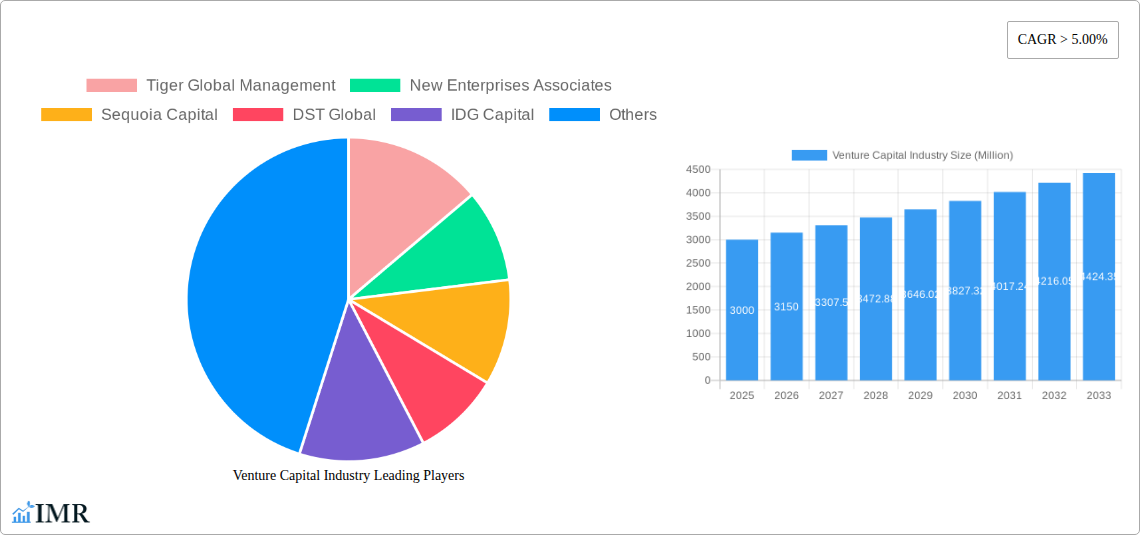
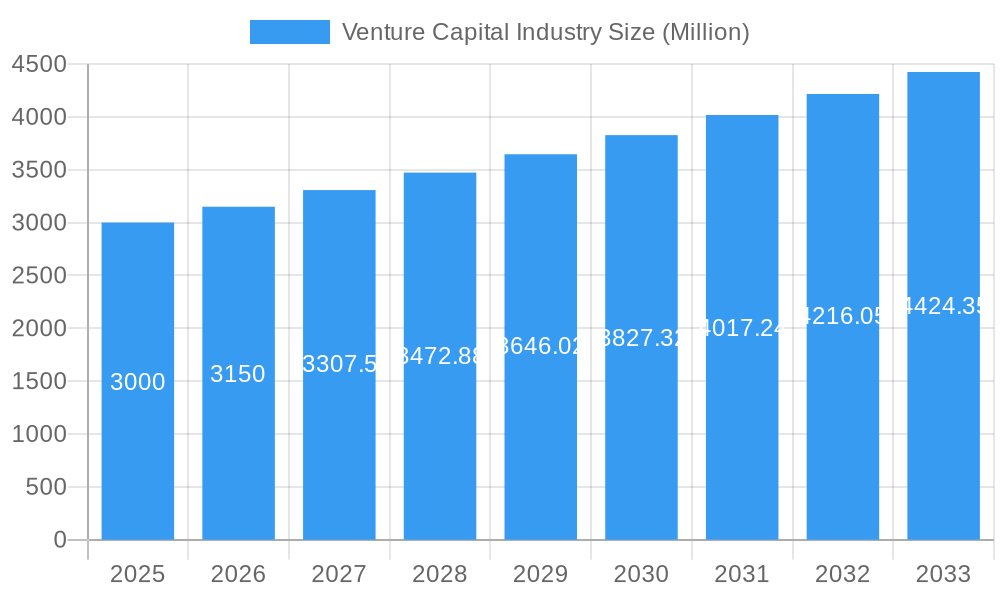
Venture Capital Industry Market Size (In Billion)
The continued growth in the VC industry is anticipated to be influenced by several factors including evolving technological advancements, shifting investor preferences, and the increasing attractiveness of high-growth emerging markets. The presence of prominent investors like Sequoia Capital and Tiger Global Management signals the considerable confidence placed in the sector's long-term potential. While market fluctuations are inevitable, the inherent resilience of the VC market, demonstrated by its ability to adapt to changing economic conditions, positions it for sustained expansion over the forecast period. The ongoing focus on sectors promising substantial returns, combined with a greater diversity of investors, further reinforces the positive outlook for the VC industry's future. The involvement of institutional investors, alongside established players, suggests a maturation of the industry, likely contributing to its continued stability and growth. Data suggests strong opportunities for VC firms focused on cutting-edge technologies and sustainable solutions.
Venture Capital Industry Company Market Share
Venture Capital Industry: A Comprehensive Market Report (2019-2033)
This in-depth report provides a comprehensive analysis of the Venture Capital (VC) industry, encompassing market dynamics, growth trends, key players, and future projections. The study period covers 2019-2033, with 2025 as the base and estimated year. The report analyzes parent markets (global investment markets) and child markets (specific VC investment segments like Fintech, Biotech, etc.) to offer granular insights. Expect detailed quantitative and qualitative data, presented with clear, concise insights for professionals in the VC industry.
Venture Capital Industry Market Dynamics & Structure
The Venture Capital industry is characterized by a dynamic interplay of factors influencing its structure and growth. Market concentration is relatively high, with a few large firms commanding significant market share. Tiger Global Management, Sequoia Capital, and New Enterprise Associates consistently rank among the top players. However, a significant portion of the market consists of smaller, specialized firms. Technological innovation, particularly within FinTech and AI, is a major driver, with rapid advancements fueling new investment opportunities.
- Market Concentration: Top 10 firms hold an estimated xx% of the market share (2025).
- Technological Innovation: AI, FinTech, and Biotech are key innovation drivers, attracting significant VC funding.
- Regulatory Frameworks: Varying regulations across jurisdictions impact investment strategies and deal flow.
- Competitive Product Substitutes: Private equity and angel investing provide alternative funding sources.
- End-User Demographics: Startups and small-to-medium enterprises (SMEs) are the primary end-users.
- M&A Trends: Consolidation is increasing, with larger firms acquiring smaller ones to expand their reach and expertise. An estimated xx M&A deals were recorded in 2024. Innovation barriers include access to talent, regulatory complexities, and intense competition.
Venture Capital Industry Growth Trends & Insights
The global Venture Capital market is experiencing robust growth, driven by a confluence of factors. From 2019 to 2024, the market exhibited a Compound Annual Growth Rate (CAGR) of xx%, reaching a market size of USD xx billion in 2024. This growth is attributed to increased startup activity, technological advancements, and favorable investment climates in several regions. The adoption rate of VC funding by startups is increasing, with higher penetration in technology-driven sectors. Technological disruptions, such as the rise of blockchain and artificial intelligence, are creating new investment opportunities and reshaping the VC landscape. Consumer behavior shifts towards digitalization and sustainability are influencing investment strategies, leading to increased focus on relevant sectors. The forecast period (2025-2033) projects a CAGR of xx%, pushing the market value to USD xx billion by 2033.
Dominant Regions, Countries, or Segments in Venture Capital Industry
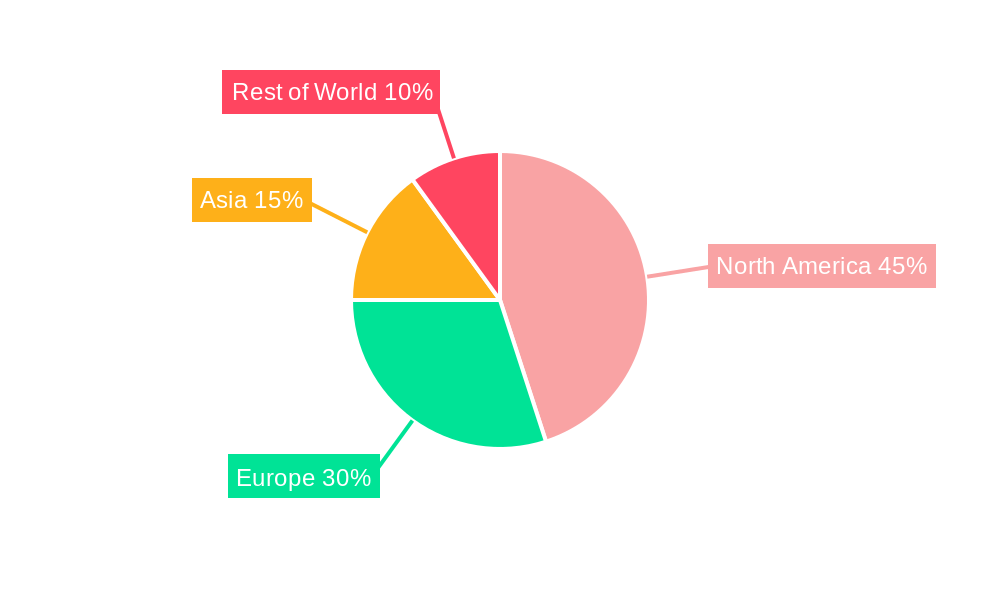
The Americas, particularly the United States, remain the dominant region in the VC industry. This dominance is fueled by a thriving startup ecosystem, robust regulatory frameworks, and abundant access to capital. Europe is also witnessing significant growth, particularly in specific sectors such as FinTech and sustainable technologies. Asia, especially China and India, represents a rapidly expanding market, with increasing government support for innovation and entrepreneurship.
- The Americas (US Dominance): Strong startup ecosystem, mature regulatory frameworks, and abundant capital. Held approximately xx% market share in 2024.
- Europe (Rapid Growth): High concentration of innovative startups in specific sectors (Fintech, etc.).
- Asia (Emerging Market): Government support for innovation and a large pool of entrepreneurs.
The key drivers of regional dominance include favorable economic policies, well-developed infrastructure, and a supportive regulatory environment. Market share is projected to shift gradually towards Asia in the forecast period, though the Americas will remain a major player.
Venture Capital Industry Product Landscape
The Venture Capital industry's "product" is investment capital, tailored to different stages of startup development (seed, Series A, etc.). Innovation focuses on improving investment processes through data analytics, AI-driven due diligence, and more efficient deal structuring. The key performance metrics include return on investment (ROI), portfolio company growth, and fund performance. Unique selling propositions of various VC firms include their specialized sector expertise, network of contacts, and mentorship capabilities. Technological advancements in data analytics and AI are enhancing due diligence and investment decision-making.
Key Drivers, Barriers & Challenges in Venture Capital Industry
Key Drivers:
- Increased startup activity globally.
- Technological advancements creating new investment opportunities.
- Favorable regulatory environments in certain regions.
- Growing demand for innovative technologies and solutions.
Key Barriers and Challenges:
- Intense competition among VC firms.
- Regulatory hurdles and compliance requirements.
- Difficulty in assessing and managing investment risk.
- Supply chain disruptions impacting startup growth. This caused a xx% decrease in deals closed in Q2 2022.
Emerging Opportunities in Venture Capital Industry
- Untapped markets in emerging economies.
- Investments in sustainable and ethical businesses.
- Growth of impact investing.
- Focus on AI and machine learning-driven startups.
Growth Accelerators in the Venture Capital Industry
Technological breakthroughs, particularly in AI and FinTech, are driving long-term growth. Strategic partnerships between VC firms and corporations are fostering innovation and investment opportunities. Expansion into new markets, particularly in emerging economies, presents significant growth potential.
Key Players Shaping the Venture Capital Industry Market
- Tiger Global Management
- New Enterprise Associates
- Sequoia Capital
- DST Global
- IDG Capital
- Index Ventures
- Healthcare Royalty Partners
- GGV Capital
- Nanjing Zijin Investment
- Greylock Partners
- (List Not Exhaustive)
Notable Milestones in Venture Capital Industry Sector
- 2020 Q4: USD 41 billion invested in the Americas across 2,725 deals; USD 38.8 billion in the US alone across 2,526 deals.
- 2020 Q4: Europe sets a second consecutive quarterly record with USD 14.3 billion raised across 1,192 deals.
- 2022: IDG Capital Vietnam invests in METAIN, signifying the rising trend of NFT-empowered real estate.
In-Depth Venture Capital Industry Market Outlook
The Venture Capital industry is poised for continued growth, driven by ongoing technological advancements and expansion into new markets. Strategic partnerships and innovative investment strategies will play a crucial role in shaping the future of the industry. The increasing adoption of digital technologies and a growing focus on sustainability will create new opportunities for investment. The market's long-term outlook is positive, with significant potential for growth and innovation in the coming years.
Venture Capital Industry Segmentation
-
1. Type
- 1.1. Local Investors
- 1.2. International Investors
-
2. Industry
- 2.1. Real Estate
- 2.2. Financial Services
- 2.3. Food & Beverages
- 2.4. Healthcare
- 2.5. Transport & Logistics
- 2.6. IT & ITeS
- 2.7. Education
- 2.8. Other Industries
Venture Capital Industry Segmentation By Geography
- 1. North America
- 2. Latin America
- 3. Europe
- 4. Asia Pacific
- 5. Middle East and Africa
Venture Capital Industry Regional Market Share
Geographic Coverage of Venture Capital Industry
Venture Capital Industry REPORT HIGHLIGHTS
| Aspects | Details |
|---|---|
| Study Period | 2020-2034 |
| Base Year | 2025 |
| Estimated Year | 2026 |
| Forecast Period | 2026-2034 |
| Historical Period | 2020-2025 |
| Growth Rate | CAGR of 16.68% from 2020-2034 |
| Segmentation |
|
Table of Contents
- 1. Introduction
- 1.1. Research Scope
- 1.2. Market Segmentation
- 1.3. Research Objective
- 1.4. Definitions and Assumptions
- 2. Executive Summary
- 2.1. Market Snapshot
- 3. Market Dynamics
- 3.1. Market Drivers
- 3.2. Market Restrains
- 3.3. Market Trends
- 3.4. Market Opportunities
- 4. Market Factor Analysis
- 4.1. Porters Five Forces
- 4.1.1. Bargaining Power of Suppliers
- 4.1.2. Bargaining Power of Buyers
- 4.1.3. Threat of New Entrants
- 4.1.4. Threat of Substitutes
- 4.1.5. Competitive Rivalry
- 4.2. PESTEL analysis
- 4.3. BCG Analysis
- 4.3.1. Stars (High Growth, High Market Share)
- 4.3.2. Cash Cows (Low Growth, High Market Share)
- 4.3.3. Question Mark (High Growth, Low Market Share)
- 4.3.4. Dogs (Low Growth, Low Market Share)
- 4.4. Ansoff Matrix Analysis
- 4.5. Supply Chain Analysis
- 4.6. Regulatory Landscape
- 4.7. Current Market Potential and Opportunity Assessment (TAM–SAM–SOM Framework)
- 4.8. IMR Analyst Note
- 4.1. Porters Five Forces
- 5. Market Analysis, Insights and Forecast 2021-2033
- 5.1. Market Analysis, Insights and Forecast - by Type
- 5.1.1. Local Investors
- 5.1.2. International Investors
- 5.2. Market Analysis, Insights and Forecast - by Industry
- 5.2.1. Real Estate
- 5.2.2. Financial Services
- 5.2.3. Food & Beverages
- 5.2.4. Healthcare
- 5.2.5. Transport & Logistics
- 5.2.6. IT & ITeS
- 5.2.7. Education
- 5.2.8. Other Industries
- 5.3. Market Analysis, Insights and Forecast - by Region
- 5.3.1. North America
- 5.3.2. Latin America
- 5.3.3. Europe
- 5.3.4. Asia Pacific
- 5.3.5. Middle East and Africa
- 5.1. Market Analysis, Insights and Forecast - by Type
- 6. Global Venture Capital Industry Analysis, Insights and Forecast, 2021-2033
- 6.1. Market Analysis, Insights and Forecast - by Type
- 6.1.1. Local Investors
- 6.1.2. International Investors
- 6.2. Market Analysis, Insights and Forecast - by Industry
- 6.2.1. Real Estate
- 6.2.2. Financial Services
- 6.2.3. Food & Beverages
- 6.2.4. Healthcare
- 6.2.5. Transport & Logistics
- 6.2.6. IT & ITeS
- 6.2.7. Education
- 6.2.8. Other Industries
- 6.1. Market Analysis, Insights and Forecast - by Type
- 7. North America Venture Capital Industry Analysis, Insights and Forecast, 2020-2032
- 7.1. Market Analysis, Insights and Forecast - by Type
- 7.1.1. Local Investors
- 7.1.2. International Investors
- 7.2. Market Analysis, Insights and Forecast - by Industry
- 7.2.1. Real Estate
- 7.2.2. Financial Services
- 7.2.3. Food & Beverages
- 7.2.4. Healthcare
- 7.2.5. Transport & Logistics
- 7.2.6. IT & ITeS
- 7.2.7. Education
- 7.2.8. Other Industries
- 7.1. Market Analysis, Insights and Forecast - by Type
- 8. Latin America Venture Capital Industry Analysis, Insights and Forecast, 2020-2032
- 8.1. Market Analysis, Insights and Forecast - by Type
- 8.1.1. Local Investors
- 8.1.2. International Investors
- 8.2. Market Analysis, Insights and Forecast - by Industry
- 8.2.1. Real Estate
- 8.2.2. Financial Services
- 8.2.3. Food & Beverages
- 8.2.4. Healthcare
- 8.2.5. Transport & Logistics
- 8.2.6. IT & ITeS
- 8.2.7. Education
- 8.2.8. Other Industries
- 8.1. Market Analysis, Insights and Forecast - by Type
- 9. Europe Venture Capital Industry Analysis, Insights and Forecast, 2020-2032
- 9.1. Market Analysis, Insights and Forecast - by Type
- 9.1.1. Local Investors
- 9.1.2. International Investors
- 9.2. Market Analysis, Insights and Forecast - by Industry
- 9.2.1. Real Estate
- 9.2.2. Financial Services
- 9.2.3. Food & Beverages
- 9.2.4. Healthcare
- 9.2.5. Transport & Logistics
- 9.2.6. IT & ITeS
- 9.2.7. Education
- 9.2.8. Other Industries
- 9.1. Market Analysis, Insights and Forecast - by Type
- 10. Asia Pacific Venture Capital Industry Analysis, Insights and Forecast, 2020-2032
- 10.1. Market Analysis, Insights and Forecast - by Type
- 10.1.1. Local Investors
- 10.1.2. International Investors
- 10.2. Market Analysis, Insights and Forecast - by Industry
- 10.2.1. Real Estate
- 10.2.2. Financial Services
- 10.2.3. Food & Beverages
- 10.2.4. Healthcare
- 10.2.5. Transport & Logistics
- 10.2.6. IT & ITeS
- 10.2.7. Education
- 10.2.8. Other Industries
- 10.1. Market Analysis, Insights and Forecast - by Type
- 11. Middle East and Africa Venture Capital Industry Analysis, Insights and Forecast, 2020-2032
- 11.1. Market Analysis, Insights and Forecast - by Type
- 11.1.1. Local Investors
- 11.1.2. International Investors
- 11.2. Market Analysis, Insights and Forecast - by Industry
- 11.2.1. Real Estate
- 11.2.2. Financial Services
- 11.2.3. Food & Beverages
- 11.2.4. Healthcare
- 11.2.5. Transport & Logistics
- 11.2.6. IT & ITeS
- 11.2.7. Education
- 11.2.8. Other Industries
- 11.1. Market Analysis, Insights and Forecast - by Type
- 12. Competitive Analysis
- 12.1. Company Profiles
- 12.1.1 Tiger Global Management
- 12.1.1.1. Company Overview
- 12.1.1.2. Products
- 12.1.1.3. Company Financials
- 12.1.1.4. SWOT Analysis
- 12.1.2 New Enterprises Associates
- 12.1.2.1. Company Overview
- 12.1.2.2. Products
- 12.1.2.3. Company Financials
- 12.1.2.4. SWOT Analysis
- 12.1.3 Sequoia Capital
- 12.1.3.1. Company Overview
- 12.1.3.2. Products
- 12.1.3.3. Company Financials
- 12.1.3.4. SWOT Analysis
- 12.1.4 DST Global
- 12.1.4.1. Company Overview
- 12.1.4.2. Products
- 12.1.4.3. Company Financials
- 12.1.4.4. SWOT Analysis
- 12.1.5 IDG Capital
- 12.1.5.1. Company Overview
- 12.1.5.2. Products
- 12.1.5.3. Company Financials
- 12.1.5.4. SWOT Analysis
- 12.1.6 Index Ventures
- 12.1.6.1. Company Overview
- 12.1.6.2. Products
- 12.1.6.3. Company Financials
- 12.1.6.4. SWOT Analysis
- 12.1.7 Healthcare Royalty Partners
- 12.1.7.1. Company Overview
- 12.1.7.2. Products
- 12.1.7.3. Company Financials
- 12.1.7.4. SWOT Analysis
- 12.1.8 GGV Capital
- 12.1.8.1. Company Overview
- 12.1.8.2. Products
- 12.1.8.3. Company Financials
- 12.1.8.4. SWOT Analysis
- 12.1.9 Nanjing Zijin Investment
- 12.1.9.1. Company Overview
- 12.1.9.2. Products
- 12.1.9.3. Company Financials
- 12.1.9.4. SWOT Analysis
- 12.1.10 Greylock Partners**List Not Exhaustive
- 12.1.10.1. Company Overview
- 12.1.10.2. Products
- 12.1.10.3. Company Financials
- 12.1.10.4. SWOT Analysis
- 12.1.1 Tiger Global Management
- 12.2. Market Entropy
- 12.2.1 Company's Key Areas Served
- 12.2.2 Recent Developments
- 12.3. Company Market Share Analysis 2025
- 12.3.1 Top 5 Companies Market Share Analysis
- 12.3.2 Top 3 Companies Market Share Analysis
- 12.4. List of Potential Customers
- 13. Research Methodology
List of Figures
- Figure 1: Global Venture Capital Industry Revenue Breakdown (billion, %) by Region 2025 & 2033
- Figure 2: North America Venture Capital Industry Revenue (billion), by Type 2025 & 2033
- Figure 3: North America Venture Capital Industry Revenue Share (%), by Type 2025 & 2033
- Figure 4: North America Venture Capital Industry Revenue (billion), by Industry 2025 & 2033
- Figure 5: North America Venture Capital Industry Revenue Share (%), by Industry 2025 & 2033
- Figure 6: North America Venture Capital Industry Revenue (billion), by Country 2025 & 2033
- Figure 7: North America Venture Capital Industry Revenue Share (%), by Country 2025 & 2033
- Figure 8: Latin America Venture Capital Industry Revenue (billion), by Type 2025 & 2033
- Figure 9: Latin America Venture Capital Industry Revenue Share (%), by Type 2025 & 2033
- Figure 10: Latin America Venture Capital Industry Revenue (billion), by Industry 2025 & 2033
- Figure 11: Latin America Venture Capital Industry Revenue Share (%), by Industry 2025 & 2033
- Figure 12: Latin America Venture Capital Industry Revenue (billion), by Country 2025 & 2033
- Figure 13: Latin America Venture Capital Industry Revenue Share (%), by Country 2025 & 2033
- Figure 14: Europe Venture Capital Industry Revenue (billion), by Type 2025 & 2033
- Figure 15: Europe Venture Capital Industry Revenue Share (%), by Type 2025 & 2033
- Figure 16: Europe Venture Capital Industry Revenue (billion), by Industry 2025 & 2033
- Figure 17: Europe Venture Capital Industry Revenue Share (%), by Industry 2025 & 2033
- Figure 18: Europe Venture Capital Industry Revenue (billion), by Country 2025 & 2033
- Figure 19: Europe Venture Capital Industry Revenue Share (%), by Country 2025 & 2033
- Figure 20: Asia Pacific Venture Capital Industry Revenue (billion), by Type 2025 & 2033
- Figure 21: Asia Pacific Venture Capital Industry Revenue Share (%), by Type 2025 & 2033
- Figure 22: Asia Pacific Venture Capital Industry Revenue (billion), by Industry 2025 & 2033
- Figure 23: Asia Pacific Venture Capital Industry Revenue Share (%), by Industry 2025 & 2033
- Figure 24: Asia Pacific Venture Capital Industry Revenue (billion), by Country 2025 & 2033
- Figure 25: Asia Pacific Venture Capital Industry Revenue Share (%), by Country 2025 & 2033
- Figure 26: Middle East and Africa Venture Capital Industry Revenue (billion), by Type 2025 & 2033
- Figure 27: Middle East and Africa Venture Capital Industry Revenue Share (%), by Type 2025 & 2033
- Figure 28: Middle East and Africa Venture Capital Industry Revenue (billion), by Industry 2025 & 2033
- Figure 29: Middle East and Africa Venture Capital Industry Revenue Share (%), by Industry 2025 & 2033
- Figure 30: Middle East and Africa Venture Capital Industry Revenue (billion), by Country 2025 & 2033
- Figure 31: Middle East and Africa Venture Capital Industry Revenue Share (%), by Country 2025 & 2033
List of Tables
- Table 1: Global Venture Capital Industry Revenue billion Forecast, by Type 2020 & 2033
- Table 2: Global Venture Capital Industry Revenue billion Forecast, by Industry 2020 & 2033
- Table 3: Global Venture Capital Industry Revenue billion Forecast, by Region 2020 & 2033
- Table 4: Global Venture Capital Industry Revenue billion Forecast, by Type 2020 & 2033
- Table 5: Global Venture Capital Industry Revenue billion Forecast, by Industry 2020 & 2033
- Table 6: Global Venture Capital Industry Revenue billion Forecast, by Country 2020 & 2033
- Table 7: Global Venture Capital Industry Revenue billion Forecast, by Type 2020 & 2033
- Table 8: Global Venture Capital Industry Revenue billion Forecast, by Industry 2020 & 2033
- Table 9: Global Venture Capital Industry Revenue billion Forecast, by Country 2020 & 2033
- Table 10: Global Venture Capital Industry Revenue billion Forecast, by Type 2020 & 2033
- Table 11: Global Venture Capital Industry Revenue billion Forecast, by Industry 2020 & 2033
- Table 12: Global Venture Capital Industry Revenue billion Forecast, by Country 2020 & 2033
- Table 13: Global Venture Capital Industry Revenue billion Forecast, by Type 2020 & 2033
- Table 14: Global Venture Capital Industry Revenue billion Forecast, by Industry 2020 & 2033
- Table 15: Global Venture Capital Industry Revenue billion Forecast, by Country 2020 & 2033
- Table 16: Global Venture Capital Industry Revenue billion Forecast, by Type 2020 & 2033
- Table 17: Global Venture Capital Industry Revenue billion Forecast, by Industry 2020 & 2033
- Table 18: Global Venture Capital Industry Revenue billion Forecast, by Country 2020 & 2033
Frequently Asked Questions
1. What is the projected Compound Annual Growth Rate (CAGR) of the Venture Capital Industry?
The projected CAGR is approximately 16.68%.
2. Which companies are prominent players in the Venture Capital Industry?
Key companies in the market include Tiger Global Management, New Enterprises Associates, Sequoia Capital, DST Global, IDG Capital, Index Ventures, Healthcare Royalty Partners, GGV Capital, Nanjing Zijin Investment, Greylock Partners**List Not Exhaustive.
3. What are the main segments of the Venture Capital Industry?
The market segments include Type, Industry.
4. Can you provide details about the market size?
The market size is estimated to be USD 396.7 billion as of 2022.
5. What are some drivers contributing to market growth?
N/A
6. What are the notable trends driving market growth?
Distribution of Start-Ups Witnessing Venture Capital Industry Globally.
7. Are there any restraints impacting market growth?
N/A
8. Can you provide examples of recent developments in the market?
In 2022, IDG Capital Vietnam Confirms Investment in METAIN to Lead NFT-Empowered Real Estate Trend in Vietnam. IDG Capital also shows its ambition to lead the NFT Real estate trend and reveals its plan to proactively engage with global investors to attract investment into the Vietnam real estate market. With the high security, instantaneous settlement, transparent, seamless transaction process, blockchain, smart contract, and NFT (Non-fungible token) technology is transforming the real estate industry and will become the key trend in the next decades.
9. What pricing options are available for accessing the report?
Pricing options include single-user, multi-user, and enterprise licenses priced at USD 4750, USD 5250, and USD 8750 respectively.
10. Is the market size provided in terms of value or volume?
The market size is provided in terms of value, measured in billion.
11. Are there any specific market keywords associated with the report?
Yes, the market keyword associated with the report is "Venture Capital Industry," which aids in identifying and referencing the specific market segment covered.
12. How do I determine which pricing option suits my needs best?
The pricing options vary based on user requirements and access needs. Individual users may opt for single-user licenses, while businesses requiring broader access may choose multi-user or enterprise licenses for cost-effective access to the report.
13. Are there any additional resources or data provided in the Venture Capital Industry report?
While the report offers comprehensive insights, it's advisable to review the specific contents or supplementary materials provided to ascertain if additional resources or data are available.
14. How can I stay updated on further developments or reports in the Venture Capital Industry?
To stay informed about further developments, trends, and reports in the Venture Capital Industry, consider subscribing to industry newsletters, following relevant companies and organizations, or regularly checking reputable industry news sources and publications.
Methodology
Step 1 - Identification of Relevant Samples Size from Population Database


Step 2 - Approaches for Defining Global Market Size (Value, Volume* & Price*)

Note*: In applicable scenarios
Step 3 - Data Sources
Primary Research
- Web Analytics
- Survey Reports
- Research Institute
- Latest Research Reports
- Opinion Leaders
Secondary Research
- Annual Reports
- White Paper
- Latest Press Release
- Industry Association
- Paid Database
- Investor Presentations

Step 4 - Data Triangulation
Involves using different sources of information in order to increase the validity of a study
These sources are likely to be stakeholders in a program - participants, other researchers, program staff, other community members, and so on.
Then we put all data in single framework & apply various statistical tools to find out the dynamic on the market.
During the analysis stage, feedback from the stakeholder groups would be compared to determine areas of agreement as well as areas of divergence